
2 minute read
4. Data and Methods

from Mobility on Demand in the Los Angeles Region: Evaluation of the Use and Performance of the MOD Pilot

Figure 1: MOD Pilot Timeline
We focus on the time period prior to the COVID-19 emergency and we analyze data from three sources: 1) an in-person, pre-pilot intercept of all transit riders at the three original MOD stations administered by Metro in early January 2019 (N= 668), 2) an online survey completed by 465 Via riders between November 2019 and February 2020, and 3) Via trip data for all trips requested or completed to or from these three stations between January 28, 2019 and February 26, 2020. Together, the three datasets enable us to examine: station users and how they traveled to/from stations prior the MOD program, Via trips and characteristics during the MOD program, and the characteristics of Via users compared to all station users. In principle, these data together should give us a window into most facets of Via use and its effects: we can see how people traveled at these stations before the pilot
began, observe the pattern of Via trips during the pilot, and compare the characteristics of station users with Via riders.
The primary limitation we face is that the datasets are not directly comparable for a number of reasons. The Via trip data are an administrative record maintained by the firm and as such are both thorough and highly reliable: they show us the complete universe of Via trips taken. These data are also composed of trip details: when they happened, where they went, and so on. They include almost no data, however, about who passengers are or their motivations for choosing Via. For those data we need the station and Via rider surveys. Both of these surveys had response rates that are within the normal range for social science survey research, but they are surveys that rely on voluntary participation and are samples of a population whose underlying parameters we do not know. They do not show us the complete universe of station users or Via riders and as such they are inherently less reliable.
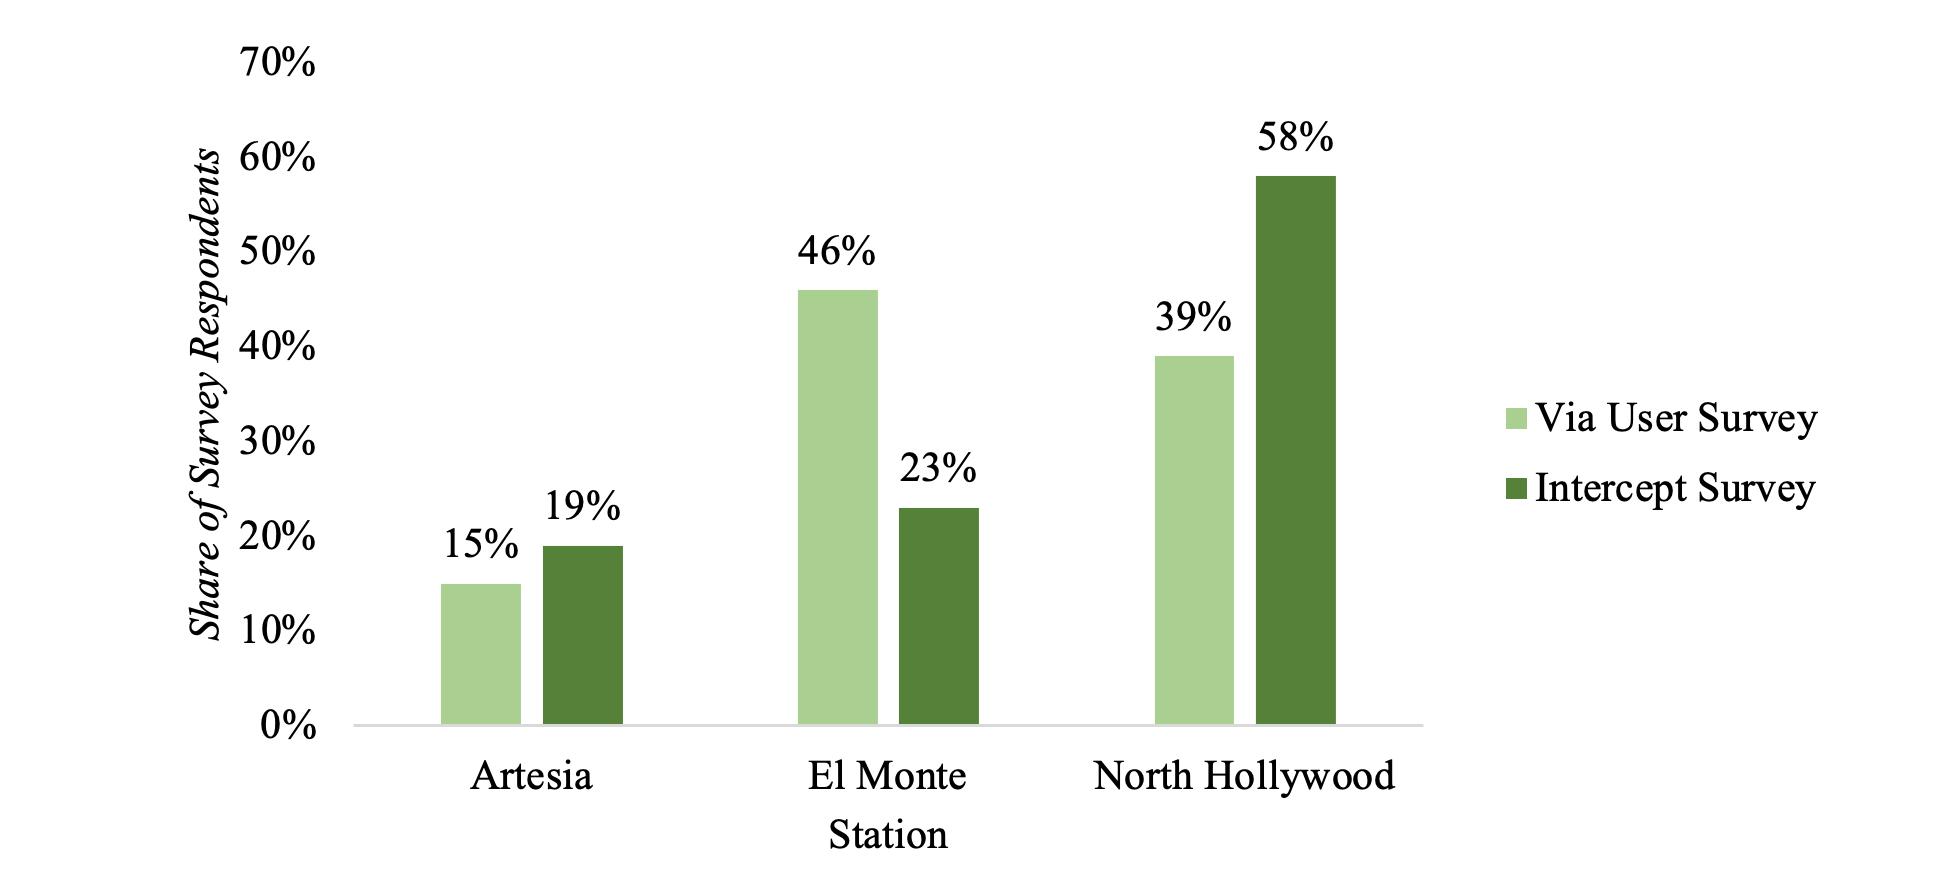
The Via user survey, in particular, gives us some cause for caution. Its geographic response was biased in a different direction than the pre-pilot Metro rider intercept survey. North Hollywood transit riders are overrepresented in the intercept survey data compared to the Via rider survey, while El Monte riders are relatively overrepresented in the Via user survey relative to the intercept survey (see Figure 2). As we will discuss further below, a major limitation is that the Via rider survey also under samples frequent riders. The people who used the service most were least likely to respond to a survey about it.
Figure 2: Share of Respondents by Station and Survey
In part as a result of the limited comparability between these surveys, the following sections are divided into three distinct analyses: first, we examine Via trip

