
3 minute read
5 Results: Via Travel To/From Metro Stations

from Mobility on Demand in the Los Angeles Region: Evaluation of the Use and Performance of the MOD Pilot

characteristics and compare how Via trips stack up to next other modes used to access or depart Metro stations. Second, we compare surveyed Metro riders to Via survey respondents. And third, we examine the spatial patterns of Via trips serving the three Metro stations.
Between January 28, 2019 and February 26, 2020, travelers requested a total of 101,338 Via trips to/from the North Hollywood, El Monte, and Artesia stations as part of the LA MOD program (see Figure 2). Of these, 79,741 trips were completed. This works out to about 7,795 requested trips per month and 6,133 completed trips.
Figure 3: Share of Via Trip Requests by Metro Station
More travelers participated in the pilot through the El Monte and North Hollywood stations compared to Artesia. Via use at all three stations grew steadily throughout the pilot until dipping in February 2020 (see Figure 4). The trend lines do suggest that ridership in each pilot area grew after the service areas were expanded.
Figure 4. Number of Trip Requests Over Time by Station
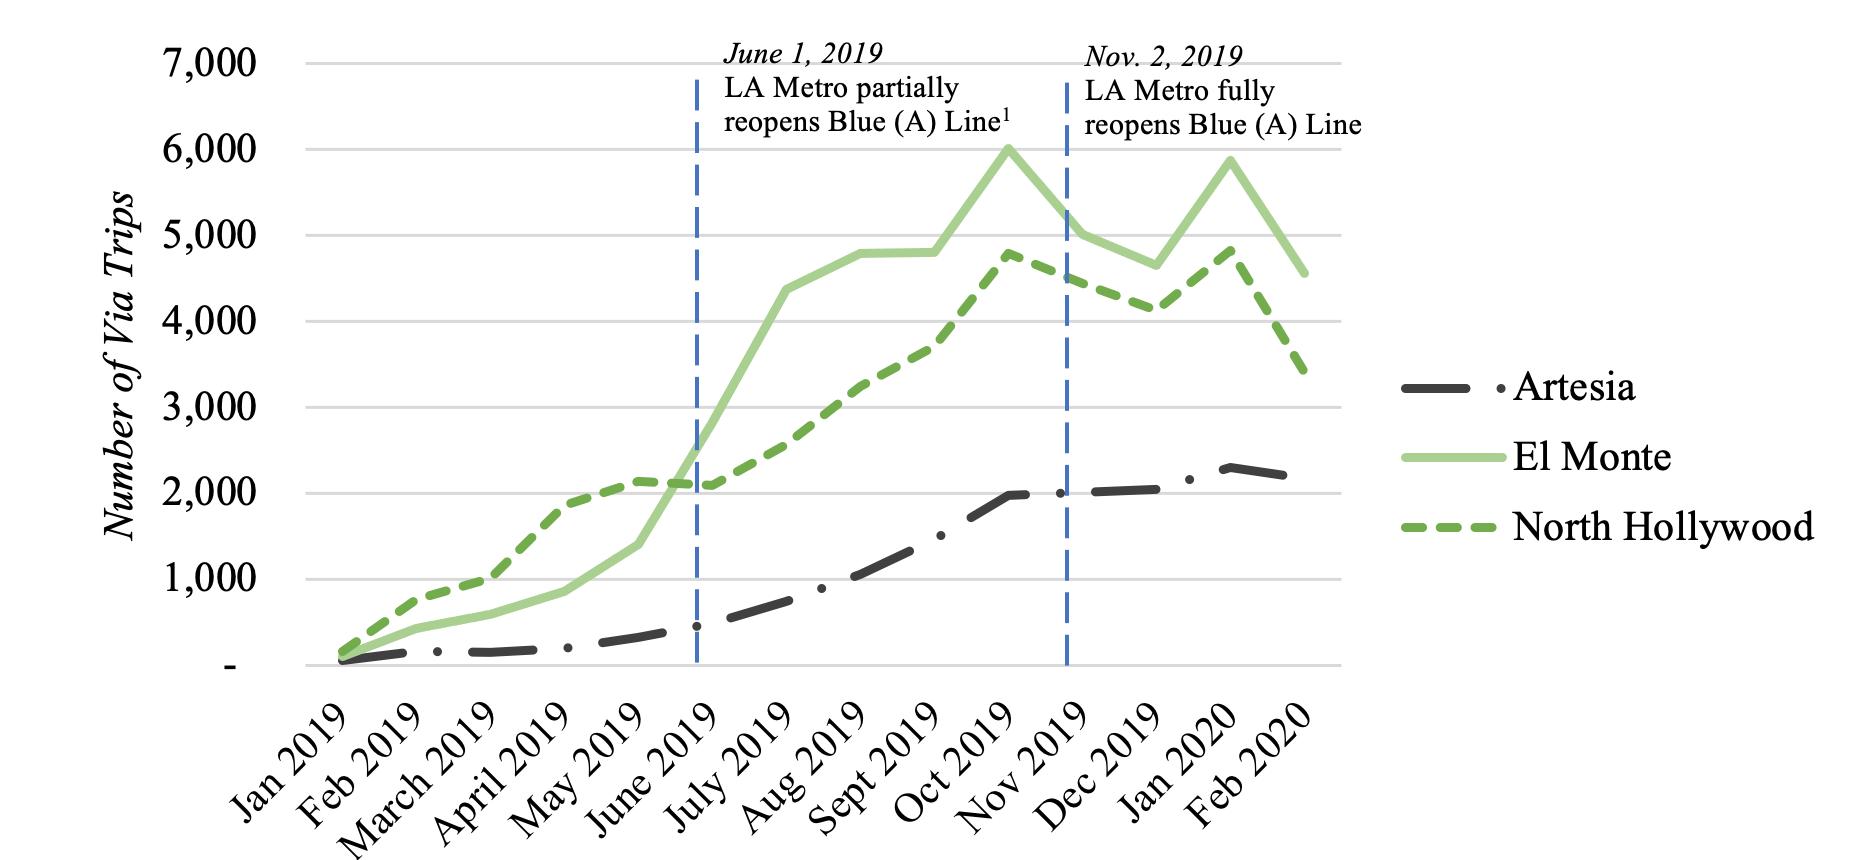
The Southern Segment of the Blue (A) Line between Downtown Long Beach and Compton Station reopened June 1, 2019.
An important point: almost all requested and completed trips (99 percent) were made through the app, with just 1 percent of requests made through the call center. Thus, the population without smartphones, which as we show below is a substantial portion of Metro riders overall, was either not reached by this program or did not find the program appealing.
About three-quarters (79 percent, n=79,741) of trip requests resulted in completed trips (i.e., the driver picked up the passenger and took them to or from the station). Table 1 shows that other trip requests were not fulfilled for a variety of reasons. The most common reason a request was not completed was because requesters did not accept the trip that Via offered (this was 12 percent of total trip requests, n=12,558). Trips that requesters did not accept, along with those that requesters cancelled, had longer average ETAs compared to completed trips (11.02, 12.04, and 9.01 min, respectively), which at least suggests that the requesters had hoped for faster travel. Among completed rides, the ETAs were quite accurate, averaged across rides; average actual wait times were just 0.03 minutes (2.1 seconds) longer than average ETAs. Actual wait times ranged from between 6 minutes faster to 8 minutes slower than predicted ETAs.1
1 This estimate excludes outliers in the bottom 1 percent and 99 percent of data.
Of total trip requests, fewer than 1 percent (n=961) were WAV requests, although 9.9 percent of Los Angeles County residents report a disability including 5.7 percent with an ambulatory disability (2018 1-year ACS). About one-quarter (75.8 percent) of these trips were completed; a higher share of WAV requests was not offered trips compared to overall trips (7.7 percent vs. 3.1 percent).
Ride Status Table 1: Trip Characteristics, All Trip Requests January 2019 - February 2020
Number of Trip Requests Percentage of Total Trip Requests Mean ETA (min)
WAV Requests Percentage of WAV Trip Requests
Completed 79,741 78.7 percent 9.0 728 75.8 percent
Admin cancelled 173 0.2 percent 10.8 10 1.0 percent
Rider no show 689 0.7 percent 11.1 4 0.4 percent
Rider cancelled 5,011 4.9 percent 12.0 68 7.1 percent
Trip not offered to riders 3,166 3.1 percent N/A 74 7.7 percent
Rider did not accept trip offer 12,558 12.4 percent 11.0 77 8.0 percent
Total 101,338 100.0 percent 961 100.0 percent
Riders waited, on average, 9.0 minutes for a Via trip, and 85 percent of trips arrived within 15 minutes. A caveat to these results is that Via automatically cancelled a trip (refused a rider trip request) if a trip could not be provided within 20 minutes; average wait times would likely be longer if the acceptable wait time threshold were increased. Figure 4 shows that, combined with in-vehicle trip time, the average Via trip lasted 19.8 minutes from origin to destination, which—according to the prepilot survey data—was around the same time it took people to drive or ride hail to the station prior to the pilot.
Figure 5: Average Time To/From Station by Mode

Via trip requests were evenly distributed across the hours that Via service was offered (see Figure 6). We note again that for most of the pilot, Via service was not available after 8pm.
Figure 6: Temporal Trip Distribution


