2nd Place Ying Zheng

Evaluating the cooling effects of greening on urban microclimate in high density urban area

Evaluating the cooling effects of greening on urban microclimate in high density urban area

Urban Micro climate in High Density Urban Area: A Case Study in Shenzhen, China

Shenzhen is a continuously expanding megacity with a population of 17 million permanent residents in 2020 (Shenzhen Bureau of Statistics, 2021). In four decades from 1978 to 2018, Shenzhen has growth from a fishing village to a global innovation metropolis, and it made world history with its rapid development. Shenzhen as a case study, several characteristics are listed below:
1. Shenzhen was designated the earliest Special Economic Zone in China. As an experimental district, this city is an ideal case for research to China’s urban development.
2. Shenzhen has a large migrant population outweighs the permanent res idents. Most migrants live in urban villages, which are vital to urban con struction of Shenzhen.

3. Shenzhen has noticeable urban heat island effect. Regulating local urban climate by urban greennig not only helps the city deal with high temper ature or heat waves but also guides other fast-urbanizing regions to con struct resilient cities.

Shenzhen(outside the gate)
Shenzhen Special Economic Zone(inside the gate)
Shenzhen, China
Shenzhen was originally a fishing village with a population of 30,000 in 1970 (Unit ed Nations, 2018) .
In 1980, Chinese revolutionary lead er, Deng Xiaoping named Shenzhen a Special Economic Zone, meaning a region in which governments facilitate business and trade are widely used in most devel oping and developed countries.


In 1988 the first trading market for elec tronic components was established. The introduction of trading and marketization of the industry gave birth to a genera tion of millionares in Shenzhen. In 1994, the first trading shopping mall was built, marking the beginning of the transforma tion of the industrial zone.


+ Commercial Zone
The pace of economic interaction and co operation across a broad range of issues between the two SEZs and adjacent Hong Kong and Macao has accelerated after handover of the latter two regions to China in 1997 and 1999, respectively.
+ Commercial + Offices +Residential
In 2000, Shenzhen International Hi-tech Equity Exchange was established. 2004,Shenzhen became the first city in mainland China without a rural adminis trative structure. In 2008, “one district and four cities” were designated as the first national innova tion-oriented city pilot.
developed zone
In 2017 Guangdong-Hong Kong-Macao Greater Bay Area(Greater Bay) was es tablished. To achieve a win-win situation through complementary. In deep develop of Shenzhen sustainable development.


Images for Baishizhou area (Source: Baidu)
Urban villages (chengzhongcun by Chinese) are a phenomenal case in Shenzhen’s urbanisation. In these vil lages, buildings are called “handshake buildings” because of the high density. The overwhelming density thus created issues such as no vegetation coverage, poor sanitary conditions, overcrowded population, and environ mental pollution. The existence of these environmental issues has caused changes in the microclimate environ ment in these villages, giving rise to the Urban Heat Island effect (UHI). The UHI is an urban area has much warmer temperature than the surrounding area due to human activities.


Images for Baishizhou area (Source: Baidu Map)
A case study area, one of the community in the Baishizhou area that has the highest density without planting in Shenzhen, China, used for design and environmental simulation assessment.Currently, this area faces the most typical and urgent social and environmental problems regarding morphological diversity, building in tensification, population structure, media exposure, and research attention.
The aim of this design is to explore the potential of urban greening strategies to improve the urban micro climate qualities in the high-density urban area. Thus, this design focus on evaluating the cooling effects of greening on urban microclimate in a high-density urban area.
This study proposed a hybrid 3D visualisation research method using the software combination of Rhino7, Dragonfly and Envi-met. In the simulation process, input data for ENVI-met microclimatic modelling is set in Grasshopper using a collection of designated components which automatically translate different inputs to Area Input (.INX) and Simulation (.SIM) Files for each iteration. These data include the building 3D model, and the Shenzhen climatic data (wind speed and direction, hourly air temperature and relative humidity). Cli matic data are derived from Visual Crossing and building information from the Baidu map. After collecting the data, simulate the urban microclimate of the original model under same weather conditions. The simula tions ran for 23 hours for both areas, the test period from 00:00 to 23:00 on the 9th of August 2019, which is the hottest day.


Buildings: Brick wall(burned) Color : Red Selected individual building for analysis


Road: Asphalt Road Color : Black
Base surface (boundary): Concrete, used/dirty Color :Orange
Simulation Model Size(m): 162m(L) x162m(W) x60m(H)
Simulation Model Area(Number of Grids) xyz-Grids:85x85x40 Size of grid cell (meters) x,y,z: 2x2x2

Geographic Location(Latitude, Longitude):22.5,114.10
Method of vertical grid generation:Equidistant Reference time zone:GMT+8
Simulation Model Date:09-Aug-19
Start & Duration of Simulation:00:00,24h
Initial Wind Speed:3.3m/s
Wind Direction:184°
Shurb: Spherical Color: Green Height(m)5m
Buildings: Green wall (ivy) Color: Green Selected individual building for analysis Tree: Bluebell Color :Green Height(m)18.42m

Clolor: Green(under the tree)
Pavement: Concrete, used/dirty Color :Grey
Initial Temperatur of Atmosphere: 28°C
Initial Relative Humidity at 1.4m height(%): 77.23%
[0100B2] BRICK WALL(Burned):0.24m (Substrate Thickness)
[01NASS]Green(Ivy)+sandy loam subsreate:0.12m(Plant Thickness) 0.24m(Substrate Thickness)
[0100ST] Asphalt Rd
[0100PP] Pavement (Concrete),used/dirty
Albero
[020031] Bluebell Tree(middle), Rd side
[01SLDS] Spheriical,large trunk,dense, small (5m)


The author designed urban greening systems, nature-based solutions which can cool down temperature in the area. Based on the results of CFD simulation, the following design intervention strategies were proposed:


1 preserve all the existing buildings and renovate transportation to promote interaction between the building programs and streetscape.
2 Add plants and green space along the sidewalks, bicycle lanes, and road medians to create a comfortable microclimate on the street level.
3 Redesign the building facades and roofs for more green coverage and cooling effect.

4 The simulation is repeated based on an improved nature-based design scenario to compare the building mi croclimate with and without plants.

are three points (A,B,C)


Point A in the centre of the area.


Point B next to the building.
Point C in the street, in front of the entrance.


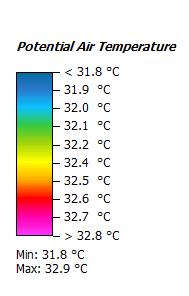
Evaluating the outdoor thermal comfort based on PMV. PMV (Predicted Mean Vote) is an empirical index that is the best known human thermal comfort model especially for indoor


The PMV scale is defined between -4 (very
and +4 (very hot) where 0 is the thermal neutral (comfort) value.


Exterior building surface
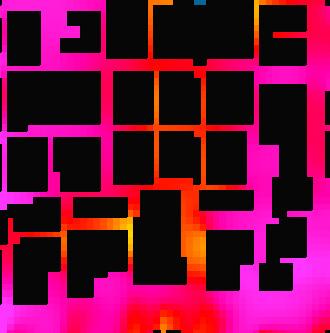
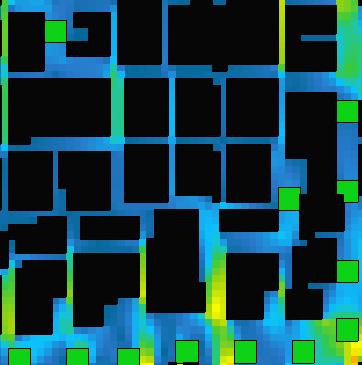
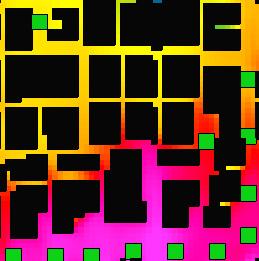
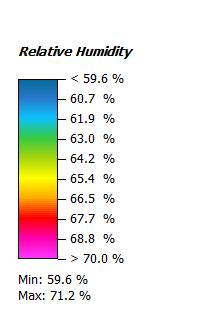
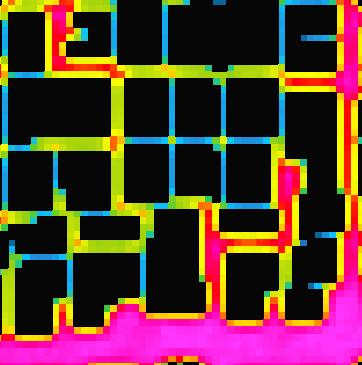
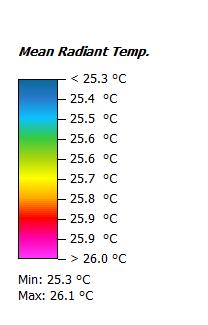
A typical summer day, August 09, was simulated. A hybrid 3D visualisation research method was used. The weather data recorded by visualcrossing.com. The resulting microclimate data at 8 am, 14 pm and 18 pm were generated and analysed, since the study involves observing the changing of microclimate at different time periods within a hot summer day. Data were analysed to study the microclimate and human thermal comfort conditions at the ground level (1.4m). Calculates the classic PMV value based on the Fangers (1972) model extended for outdoor conditions. A typical human subject was used to calculate PMV, which is a 35-year-old male, 1.75m in height, 75kg in weight, with a clothing index of 0.9, and a metabolic rate of 86.21W. Page 11-13 shows the changing of temperature, wind speed, relative humidity, mean radiant temperature, and PMV dur ing the test time period. These figures show the difference between the study area before design and the study area after design. Some key findings can be derived from the figures as below.
1. High building density has a serious negative impact on microclimate. For instance, due to the high building density, the pathways in the area are in shadow. As a result, the vertical greenery design has limited effect in cooling the pathway between buildings within the area. Besides, it can be found from the wind speed simula tion results that, since the distance between the buildings in the area is narrow, it is difficult for the air to pass through smoothly. Thus, the wind speed between buildings is close to zero at ground level (1.4m).
2. Ivy is the most effective climber for cooling buildings, reducing humidity and mean radiant temperature. For example, compared to data before design, point C of the designed area has a 10% lower relative humidity, and a 17°C lower mean radiant temperature at 14:00 pm. Moreover, the use of green roofs and green walls can have a significant impact on the cooling effect within a given building (page13-14). The results show that the green roofs have a maximum cooling effect up to 30°C on the exterior surfaces of the building on the test day.
3. Urban greening systems design will improve the microclimate of the area, especially for outdoor thermal comfort. This is shown on page 12. Shades of plants have a strong potential to interact with the thermal per formance of building material. Shade provided by trees or other objects reduces building surface temperatures on summer days. The PMV of the designed scenario is significantly lower than the original value in the hottest time. The largest difference was recorded at point C at 3 pm.
This study develops a hybrid method for microclimate simulation to evaluate urban microclimate using the software combination of Rhino7, Dragonfly and ENVI-Met. This method was used to simulate the microcli mate in a high-density residential area, known as urban villages in Shenzhen, China. In the case study, both original models and design models are tested. The results demonstrate that: 1. high building density has a serious negative impact on microclimate, 2. urban greening can contribute positively to the cooling effect, pro viding outdoor thermal comfort. Besides, this method can help to incorporate the implementation of greening schemes in downtown development and visualize the potential cooling benefits of different design scenarios. Therefore, it has a significant contribution to analyse and visualize the potential cooling effect of different greening design scenarios to support design decision-making. The future study will continue to test out the most suitable greening systems and plant species to mitigate environmental damages and urban heat island effects in megacities.
I am very thankful to my principal supervisor Prof. Greg Keeffe, School of Natural and Built Environment, Queen’s University Belfast, UK for the discussions and suggestions that helped me develop this project. Mean while, I am particularly grateful to the China Scholarship Council of Chinese government for the funding support provided to conduct this research project.