Machine learning pollution hotspots in urban street canyon


 Jeffrey Man-Hei Chang PhD Candidate at The University of Hong Kong

The synergy of urban street canyons and vehicular air pollutants gives raise to public health concerns in Hong Kong. With the stagnant wind over compact high rise fabric, road emissions are contributing to the heavy polluted hotspots in the roadside environment.
Hong Kong is a high density city with considerable spatial variability in microclimate and pollutant dispersion pattern. With the complex land surface, urban morphology and heavy transportation with strong street canyon characteristics, Hong Kong is an ideal location for the study of urban air pollution.
The nexus of urban street canyon effects and heavily polluted traffic emissions give rise to the thermal and pollutant exposure threats in urban megacities, and therefore the rapid identification of pollutant hot spots are crucial in minimizing the potential health effects for the general public.

In this study, Mong Kok a compact urban downtown area of Hong Kong (with a 320 meters x 320 meters grid) is selected as the target domain for this study. The building elevation data for 55 buildings were referenced from the ALOS Global Digital Surface Model (AW3D30) and lidar scanned digital elevation model from the local authorities. (Figure 1)
Hourly traffic flow and vehicular emission inventory data were incorporated to understand how the urban building morphology and pollutant dispersion from traffic contributing to the roadside pollution hotspots.

Figure 1 Domain illustration and satellite images of this study: (Source: Google Earth Engine)

Figure 2 The illustration of Street Canyon effect in Mong Kok

The first part of the research aims to investigate the variability in wind attributes, buildings and diurnal traffic emissions interact with each other to contribute to the spatial temporal distribution of NOx profile in Mong Kok’s street canyon domain.
Wind attributes are a key factor in governing the momentum of air pollutant dispersion inside compact urban form, with variations in wind directions, the flow patterns differ a lot.
1. Wind parallel to canyon Channelization and venturi effect could be observed
2. Wind perpendicular to canyon Vertically rotating wind flow creates vortex inside the street canyon (Figure 3)

Figure 3 Illustration of wind and pollutant dispersion patterns with wind perpendicular to canyon
The diurnal traffic flow also dominates the magnitude of NOx concentration exposed to the citizen on different levels of buildings. In this study, ENVI met v.5 was used as an analysis tool to simulate the 3 dimensional variation in NOx concentration with varying:
• Windspeed
• Wind Direction
• Daily Traffic Flow
People in Hong Kong are usually living in high rise residential buildings, while most of the pollution models only consider the hotspots on ground level environment
With the 3D NOx profile modelling, the study investigates whether the livings in Hong Kong is “living in higher, better air”
Computational Fluid Dynamics (CFD) models and atmospheric numerical downscaling models are commonly used to simulate the microclimate and pollution dispersion behaviors in urban environments. While these models are usually time and resource intensive, they hinder the possibilities of making ultra high resolution air pollution and microclimate forecasts into operational product within a short time.
In this study, the geographic information system (GIS) data were extracted from local traffic data and a digital elevation model, the postprocessing of data with QGIS and library packages were applied to generate the static parameters (including Aspect ratio, Sky view factor, Wind exposition and Wind effect) for the study.
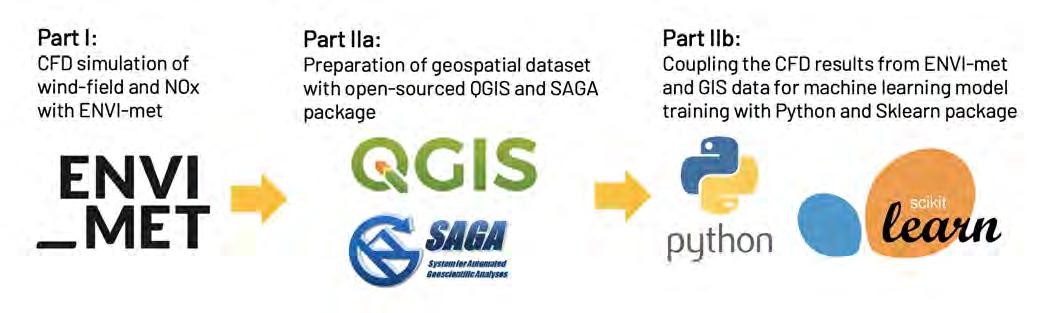
As this data may represent the impact from urban canopy configurations and traffic flows on wind field and NOx concentration on the roadside environment, a multivariate regression model with a machine learning algorithm “Support Vector Machines” was then applied with Python programming language to generate a fast response identification tool for simulating pollution hotspots under different scenarios. (Figure 4)


This research study is a part of the author’s PhD dissertation under supervision and funding support by Dr. Nicky Y.F. Lam from Department of Geography, The University of Hong Kong.
The second part of this study provides an opportunity to examine the possibility of data fusion of CFD model outputs and GIS data with machine learning techniques.
Roads in Hong Kong are categorized according to their functions and capacities. In this study, Primary Roads are 2 way streets for traffic between centers within the main urban areas.


While Residential Roads are usually 1 way with direct route access from district distributor roads to buildings and land within districts.

Three variables were incorporated into the model runs, and other meteorological parameters remained unchanged.
1. Wind Direction (4 options)

2. Windspeed (3 options)
3. Daily Traffic Value for Primary Road (4 options)


Except for T1 Nathan Road (Primary Road), the diurnal road emission sources profile for other 6 roads have been kept unchanged throughout the simulations.

The setting of hourly traffic flow in this study was referred to The Annual Traffic Census 2017 (ATC) report issued by the Transports Department, HKSAR. (Figure 8)

Hourly traffic flow data may influence the total road emission along the street canyon, while the traffic composition and emission factors play a golden key in the diagnostics of the emission sources on roads.
The proportion of vehicles in percentage from 0700 to 2300 (16 hours average) were retrieved from ATC report, and the distribution can be referred to Figure 9
1. Impacts of varying incoming wind direction on horizontal and vertical flow over the street canyon domain
Figure 10 ENVI met Simulation Result (Wind Field)
Four simulations were modelled with the configurations of 3 m/s wind and daily traffic value of 25000 at T1 (Nathan Road)

1. For E Wind and W Wind, when the incoming wind is perpendicular to the canyon, stronger u component wind can be observed at the beginning of the street canyon and weakened after reaching Nathan Road.
For vertical wind patterns, the strongest wind were commonly observed near to the windward side of buildings.
2. For S Wind and N Wind, when the incoming wind is parallel to the canyon, turbulence in u component wind can be observed over the road crossings.
By comparing with the perpendicular wind, flow was fully developed in the South North corridor with v component wind, and no obvious weakening in flow could be observed.
3. In general, the vertical flow w is close to 0 m/s near to the ground surface of Nathan Road , which had illustrated the stagnant air conditions can exist in any incoming wind direction over the canyons.


By coupling the road and background emissions into the meteorological field, ENVI met model has illustrated the NOx concentration profile with different incoming wind direction in the morning rush hour (08:00 HKT) and evening rush hour (16:00 HKT). The simulations tell us some pollutant characteristics within the Mong Kok street canyon domain (Figure 11 and 12):
1. The accumulation of NOx is more significant with Easterly wind
2. NOx can propagate to higher building levels (~23 meters) with Easterly wind
3. With incoming wind parallel to the canyon (S Wind or N Wind), the boundary limit for NOx pollutant propagation is around 10 meters high
4. The building height difference between windward and leeward sides amplifies the street canyon vortex effect and favors pollutant accumulations
2 experimental scenarios on road emission were simulated to examine the characteristics of NOx dispersion over the street canyon, and account on the pollutant exposure from high density traffic Primary Roads.


Scenario 1 Consider road emission from T1 to T7
Emissions for 7 different road segments were imported according to the hourly traffic flow and traffic composition data as illustrated in the previous section, and the diurnal NOx profile at ground level (0.5 meter) were demonstrated in Figure 13.
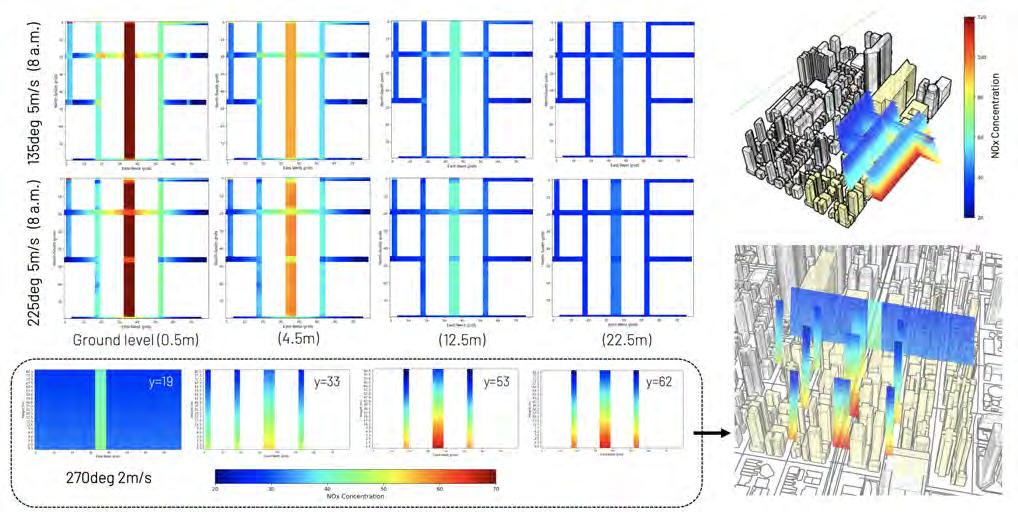
Since the NOx profile shown in Scenario 1 were the total air pollutant accumulated from seven road emission contributions, it is hard to differentiate the impact from Primary Road on the neighboring road environment. Therefore, Scenario 2 was set as a control experiment to investigate the pollutant dispersion effects from Primary Road.
With the model configuration of 3 m/s easterly wind, the model outputs had shown a strong dispersion exists during rush hours (08 am and 04 pm), and which up to 100 �g/m3 of NOx pollutant could diffuse from Nathan Road to the inner street corridor. For vertical profile analysis, the pollutant from Primary Road can even diffuse to the inner roads at height > 32.5 meters.
The result had remarked an important message that the downwind areas from Primary Roads are vulnerable to the direct pollution impacts of wind effects.
Diurnal vertical profiles on different roads in Figure 15 showcased the NOx contribution from varying traffic flow on Primary Road and wind direction impacts. In terms of Primary Road, it is expected that more traffic means a higher pollutant concentration on road surface. While when pollutants elevated, the NOx concentration drops dramatically after reaching about 10 meters high from the ground surface, and the value is halved.
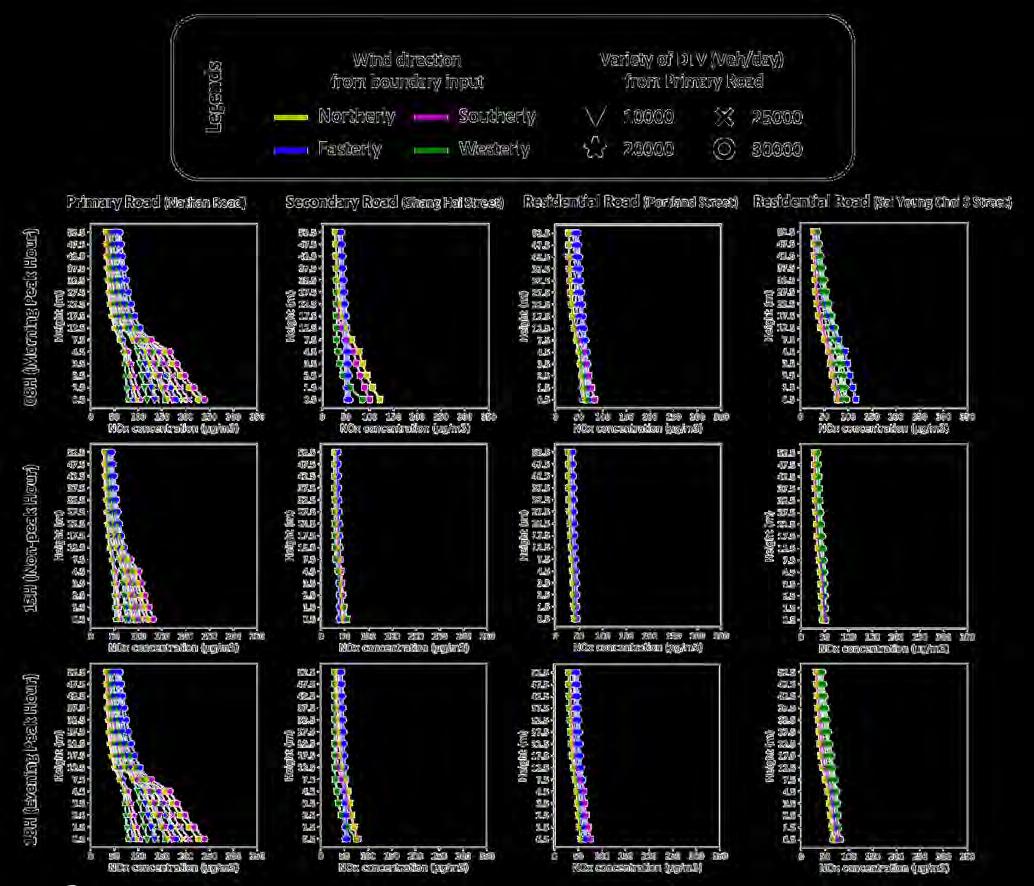
This may suggest that if people are living at a level above 10 meters (i.e. 4th Floor or above), their pollution exposure will be smaller than those living downstairs, and the result can be used as a guideline for future residential developments with crowded roads.


CFD models offer a high resolution spatiotemporal models in NOx hotspots inside street canyons, while computational resources and time is always research concerns. By using machine learned model with GIS data, the real time forecast of pollutant hotspots with varying meteorological boundaries and traffic flow is achieved.
ENVI met offers a comprehensive simulation on microclimate and urban air pollutants with high resolution spatiotemporal models, while running these CFD model are computationally intensive and time costly, hindering the efficiency in rapid hotspot forecasts.
In this study, an ENVI met postprocessing model with machine learning techniques was developed. By incorporating the geospatial data into Support Vector Machines algorithm, the 3 dimensional NOx profile over the street canyon could be rapidly visualized.
The aspect ratio is the ratio of the mean height of the buildings to the width of the street. The ratio is especially crucial when it comes to determining the type of airflow in the canyon. (Figure 16)

The building heights are referenced by ALOS Global Digital Surface Model and Digital Elevation Model by the government. And the width of roads is referred to the road hierarchy guidelines.
Figure 16 Geometry of an unsymmetric canyon with aspect ratio
A Sky View Factor represents the ratio at a point in space between the visible sky and a hemisphere centered over the analyzed location. (Figure 17)
At a point where the SVF = O, the entire sky is blocked from view by obstacles. If there is an obstacle blocking parts of the sky view, the SVF will be greater than 0
Wind Effect and Wind Exposition are calculated with SAGA GIS tools. Digital elevation data are imported for the calculation in the captioned indexes. The “Wind Effect” is a dimensionless index, with the values below 1 indicating wind shadowed areas (leeward slopes), whereas the areas exposed to wind are above 1 (windward slopes).
And for “Wind Exposition”, the index calculates the average “Wind Effect” for all directions using angular steps. Like Wind Effect, when values are below 1, the area is wind shadowed, and vice versa. (Figure 18)


Pollutants can disperse with air momentum transfer, by referring to the simulation outputs from ENVI met, NOx plumes can be transported by wind into the areas further away from main roads, and the concentration of pollutants decreases with distance.
48 ENVI met runs with three varying parameters (Wind Direction, Windspeed and Daily Traffic value for Primary Road) are serving as the ground truth representation of wind field and NOx patterns inside the Mong Kok domain in Hong Kong.
By using Support Vector Machines in data mining, a supervised machine learning algorithm based on Python language, the relationships between wind field, NOx and geospatial data are established under the cost function
SVMs are the supervised machine learning method which is commonly used for data classification, regression and outlier detection. The Epsilon Support Vector Regression approach used in this study helps to dynamically minimize the sum of errors (ε) and find the best combination of feature groupings by allocating coefficients (� ) to each variable (�i), as in Eq. (1) and (2)
The linear kernel with regularization parameter (C) = 1 and kernel coefficient (gamma) = 1 were adopted in SVM simulations. With the trained model, the input of real time traffic flow and meteorological values can generate the NOx profile forecast within a short period of time.


Simulation runs with ENVI met were trained with support vector regression and GIS data to build a statistical relationship between the parameters, and the simulation time for single level NOx conc. with coupled model (CFD_SVM) had dramatically dropped by ~90%
ENVI met simulation for hourly output: 110 minutes
With CFD SVM model for hourly output: 3 minutes
Two evaluation metrics including R2 scores, and Mean Absolute Bias (MAE) were used to evaluate the model performance. (Figure 20)
• The model performs better with S Wind and W Wind scenarios (lower MAE in NOx concentration)

• Under estimation exists with E Wind scenario, which higher concentration in NOx are modelled with ENVI met simulations

The street canyon effect and devastating traffic pollution makes Hong Kong an ideal place to explore solutions for real time forecasts in the vertical profile of roadside air pollutants.
The analysis shows the impact of wind attributes and road emission intensity on the development of highly polluted hotspots inside an urban street canyon. Comparative studies on varying wind and traffic flow conditions were simulated with ENVI met v.5 model, and it can be concluded that inside the street canyon with taller windward facing buildings, stronger vortex are created and drive the air pollutant to accumulate.
With the comprehensive modelling of fluid dynamics and aerosol dispersion physics, the high resolution spatiotemporal profile for NOx hotspots is illustrated. The results provide an important message about the severity of potential health threats over time and spatial variation in densely populated communities. Relevant interventions or policies could be made to minimize the pollutant exposures to citizens living in these pollutant prone areas.
Besides, the experiment here serves as a trial study on postprocessing the ENVI met model outputs into machine learning models for finding the coefficients and statistical relationships between urban geometry, meteorological contribution and pollutant sources from anthropogenic activities. It is stimulating that the model had shown good accuracy and consistency with original ENVI met model output, while saving up to 90% of simulation time and computational resources.
Real time forecast for 3 dimensional pollutant profile on a crowded roadside environment have never been achieved with meter scale CFD models. While in aid of the development of a trained machine learning model from ENVI met CFD model outputs, the real time high resolution pollutant forecast has become possible.