Metron-IQ Report 1.5.1
Epona Podiatry Center, LLC Name: Onesy Owner: Ashton Smith Owner ID: Species: Equine Breed: --Unknown--
Sex: --Unknown-Age: 12 Patient ID: Date: 14-Feb-2022
This report is a computer-generated analysis of one or more images and does not constitute a diagnosis. The diagnosis is made only by your veterinarian.
www.MetronMind.com
Page 1
Lateral Hoof X-Ray 23:00:02
Owner: Ashton Smith
Animal: Onesy
Date: 14-Feb-2022
LF
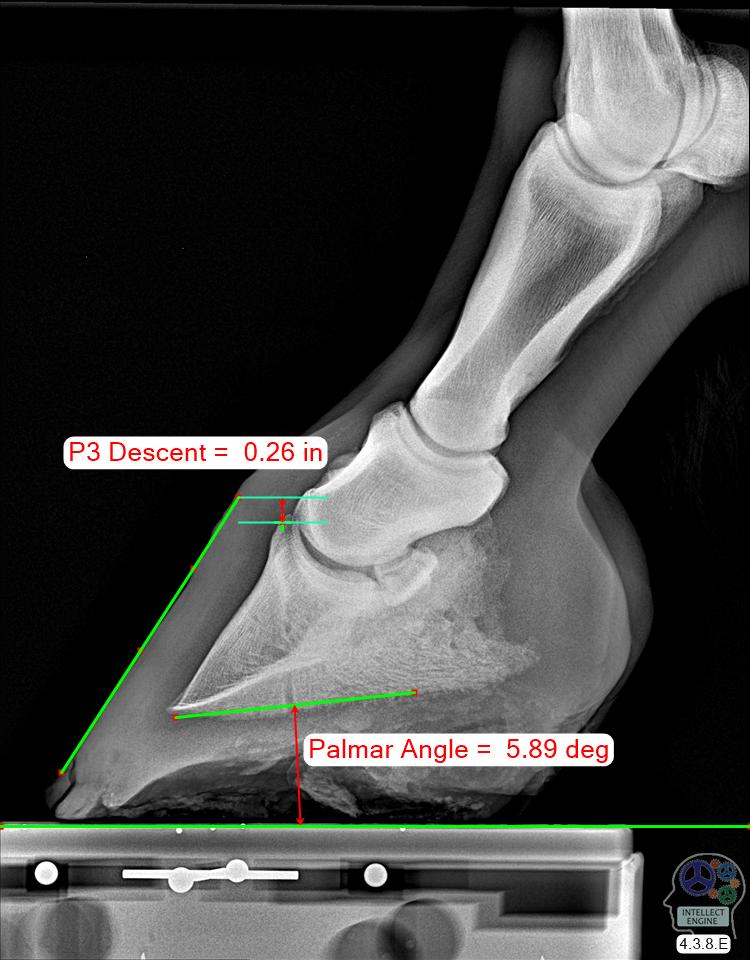
The Palmar Angle measurement helps to assess the dorso-palmar balance of the hoof. Horses with low palmar angle tend to be 'low at the heel', and horses with high palmar angle tend to be 'high at the heel'. No one value is 'correct' for all animals, but extreme values are to be avoided.
The Palmar Angle for this hoof is 5.9 degrees. This value is indicated on the histogram to the left by the vertical black line labelled 'This Hoof'. Angles substantialy higher or lower than normal are to be avoided, if possible. The Palmar Angle is in the 3rd quartile when compared to a large group of horses.
Data from 6,968 hooves of mixed breed.
Page 2
Owner: Ashton Smith 1. 2. 3. 4. 5. 6. 7. 8. 9. 10.
Palmar Angle P3 Descent P3 Dist. to Ground Hoof Angle Prox. HL Zone Dist. HL Zone Toe/Support % Coffin-Joint Angle Pastern-Joint Angle P2 Length
Animal: Onesy
5.9 deg 0.26 in 1.16 in 57.2 deg 0.67 in 0.63 in 67.8 % -13.8 deg 14.7 deg 1.69 in
LF
4.70
1. Palmar Angle
0.20
2. P3 Descent 0.40
5. Prox. HL Zone
49.2
4. Hoof Angle 0.40
6. Dist. HL Zone
10.5
8. Coffin-Joint Angle
Date: 14-Feb-2022
64.9
7. Toe/Support % 4.5
9. Pastern-Joint Angle
Data from 6,968 hooves of mixed breed. Central green zones correspond to 70% of the population. Red zones represent "15th percentile and lower" and "85th percentile and higher". Median values are shown in upper right corner of each graph. Linear measures have been scaled by 'P2 Length'.
1.66
10. P2 Length
Page 3
Owner: Ashton Smith
Animal: Onesy
Date: 14-Feb-2022
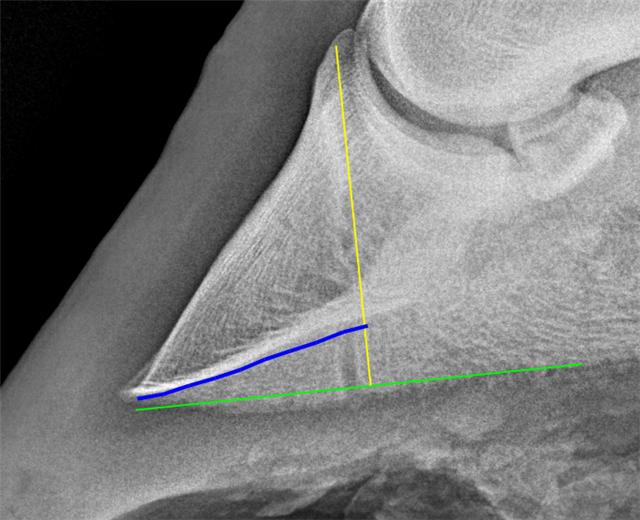
P3 Analysis
LF
The value of the Palmar Metric for this hoof is 6.9.
The 'Palmar Metric' measures the concavity of the pedal bone (P3). The red curve shows the average value for a population of horses as a function of age. As the graph above shows, this metric tends to decrease as the horse ages. The red cross shows this P3's concavity relative to average for it's age. 755 data points from hooves of 'large' horses of mixed breed. 'Large' is defined as a 'P2 Length' greater than 1.6 inches. The red curve shows a cubic trendline for the data. On average, concavity is lost with age, especially in the case of larger, heavier horses.
Page 4
Lateral Hoof Photo 15:53:19
Owner: Ashton Smith
Animal: Onesy
Date: 14-Feb-2022
LF
The Hoof Angle measurement helps to assess the dorso-palmar balance of the hoof. Horses with low hoof angle tend to be 'low at the heel', and horses with high hoof angle tend to be 'high at the heel'. No one value is 'correct' for all animals, but extreme values are to be avoided.
The Hoof Angle for this hoof is 57.6 degrees. This value is indicated on the histogram to the left by the vertical black line labelled 'This Hoof'. Angles substantialy higher or lower than normal are to be avoided, if possible. The Hoof Angle is in the 4th (high) quartile when compared to a large group horses which have been measured.
Data from 2,800 hooves of mixed breed.
Page 5
Owner: Ashton Smith 1. 2. 3. 4. 5. 6. 7. 8.
Hoof Angle Wall Deviation Heel Angle Heel Height Foot Length Heel-Bulb Dist Heel Height % Heel-Bulb %
Animal: Onesy
57.6 deg 0.11 in 51.3 deg 2.12 in 4.89 in 1.50 in 43.4 % 30.7 %
LF
50.1
1. Hoof Angle
0.12
2. Wall Deviation 5.1
5. Foot Length
Date: 14-Feb-2022
43.4
3. Heel Angle 21.8
7. Heel Height %
Data from 2,800 hooves of mixed breed. Central green zones correspond to 70% of the population. Red zones represent "15th percentile and lower" and "85th percentile and higher". Median values are shown in upper right corner of each graph.
18.7
8. Heel-Bulb %
Page 6
DP Hoof X-Ray 23:00:02
Owner: Ashton Smith
Animal: Onesy
Date: 14-Feb-2022
LF
The Coffin-Joint Tilt measurement helps to assess the medial-lateral balance of the hoof. A value of zero occurs when the axis of rotation of the coffin-joint is parallel to ground. A positive value means 'medial heel lower'. The P1-alignment value is not related to the conformation of the hoof, but rather, gives a measure of how well aligned the radiographic appartus was. This value should be low (say, within +/- 3 degrees) in order to trust the Coffin-Joint Tilt value.
The Coffin-Joint Tilt for this hoof is 1.1 degrees. This value is indicated on the histogram to the left by the vertical black line labelled 'This Hoof'. It is preferred to be in the green zone, or perhaps the blue. The red zone is far away from the norm. The Coffin-Joint Tilt value is in a good range corresponding to above average medial-lateral balance.
Data from 3,700 hooves of mixed breed.
Page 7
DP Hoof Photo 15:53:19
Owner: Ashton Smith
Animal: Onesy
Date: 14-Feb-2022
LF
The 'Splay' measurement helps to assess the frontal view of the hoof. Horses with low splay values tend to be contracted or clubby, and horses with high splay tend to be weak walled and/or have weak bars. No one value is 'correct' for all animals, but extreme values are to be avoided.
The Splay for this hoof is 124.5 percent. This value is indicated on the histogram to the left by the vertical black line labelled 'This Hoof'. Splay values substantialy higher or lower than normal are to be avoided, if possible. The Splay value is in the 2nd quartile when compared to a large group horses which have been measured.
Data from 1,880 hooves of mixed breeds.
Page 8
Solar Hoof Photo 15:53:19
Owner: Ashton Smith
Animal: Onesy
Date: 14-Feb-2022
LF
The 'Heel-Width Percentage' measurement gives the width of the heel points as a percentage of the widest part of the foot. This can be used as a way to check for 'contracted heels'.
The Heel-Width for this hoof is 46.1 percent (of the widest part of the foot). This value is indicated on the histogram to the left by the vertical black line labelled 'this hoof'. Heel-Width is in the 1st (low) quartile when compared to a large group horses which have been measured.
Data from 2,394 images of hooves of mixed breeds.
Page 9
Owner: Ashton Smith 1. 2. 3. 4. 5. 6.
Heel/Width % Heel-Bulb/Length % Toe/Length % Inside/Width % Frog/Heel Angle Frog/Toe Angle
Animal: Onesy
46.1 % 15.4 % 47.8 % 50.2 % 88.8 deg 95.0 deg
55.6
1. Heel/Width %
LF
21.4
2. Heel-Bulb/Length % 49.0
4. Inside/Width %
Date: 14-Feb-2022
90.0
5. Frog/Heel Angle
Data from 2,394 images of hooves of mixed breeds. Central green zones correspond to 70% of the population. Red zones represent "15th percentile and lower" and "85th percentile and higher". Median values are shown in upper right corner of each graph.
56.1
3. Toe/Length % 90.0
6. Frog/Toe Angle
Page 10
Interpretation Epona Podiatry Center, LLC
LF
(Based on: Lateral X-ray, DP X-ray, Lateral Photo, Frontal Photo, Solar Photo)
1. High on the heel: remove heel to lower the Palmar Angle and Hoof Angle. 2. Alignment of the radiograph is poor, so cannot judge meadial-lateral balance reliably. 3. Toe is short. Do not shorten further. 4. Heels are contracted. 5. Stance is 'broken forward'. Was horse standing with Cannon vertical? 6. Palmar Metric: P3 concavity is good for the horse's age.
This page interprets the measures relative to statistical norms derived fron a large population. There is a wide range of morphologies of the hoof, and what works for one horse may not for another. Statements on this page are based soley on image measurements and cannot take into account other factors such as soft tissue quality, bruises, moisture content, intended use of the horse, etc. So, you must employ your own judgement when making use of these statements.
Page 11