7 minute read
Share of Global Greenhouse Gas Emission
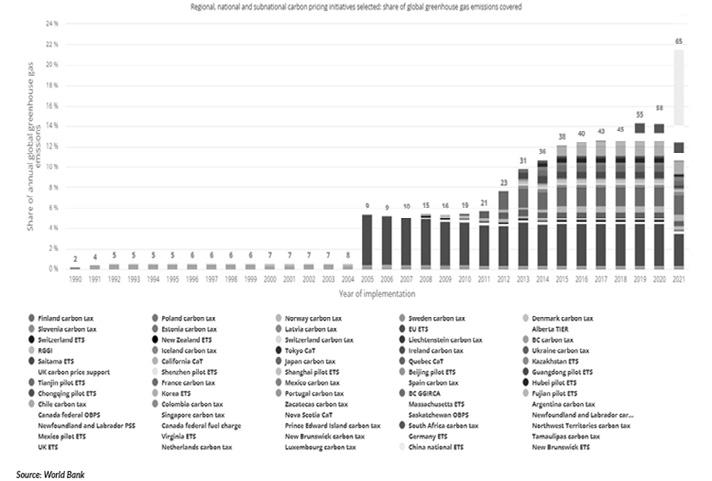
REGIONAL, NATIONAL, SUB-NATIONAL CARBON PRICING INITIATIVE SELECTED: SHARE OF GLOBAL GREENHOUSE GAS EMISSION COVERED
Source: EQiSearch
Advertisement

The economic recovery in China appears to be particularly energy-intensive. The primary energy demand intensity of China’s GDP between 2019 and 2021 improved by an average of only 1% annually, compared with 1.2% between 2008 and 2010 when China enacted a huge economic boost, and an average improvement rate of 3.7% from 2010 to 2019. China’s energy intensity in 2021 was impacted primarily by evolutions in the electricity sector. With rapid GDP growth and additional electrification of energy services, electricity demand in China grew by 10% in 2021, faster than economic growth at 8.4%. The increasein demand of almost 700 TWh was the largest ever experienced in China. With demand growth outstripping the increase of low emissions supply, coal was called on to fill 56% of the rise in electricity demand. This was despite the country also seeing its largest ever increase in renewable power output in 2021. Electricity generation from renewables in China neared 2,500 TWh in 2021, accounting for 28% of the total generation in the country CO2 emissions in India rebounded strongly in 2021 to rise 80 Mt above 2019 levels, led by growth in coal use for electricity generation. Coalfired generation reached an all-time high in India, jumping 13% above the level in 2020 when coal generation had declined by 3.7%. This was in part because the growth of renewables slowed to one-third of its average rate of the previous five years.


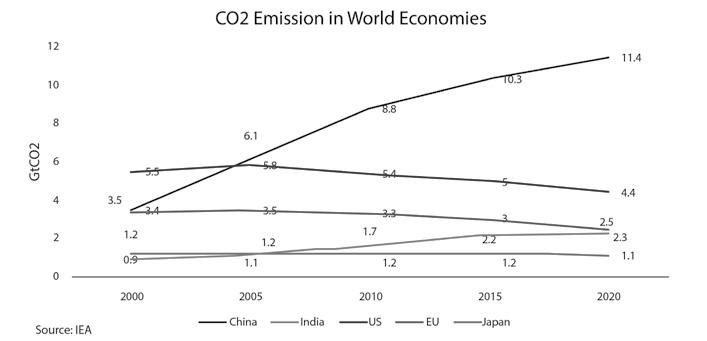
iSearch Global economic output in advanced economies recovered to pre-pandemic levels in 2021, but CO2 emissions rebounded less sharply, signaling a more permanent trajectory of structural decline. CO2 emissions in the United States in 2021 were 4% below their 2019 level. In the European Union, they were 2.4% lower. In Japan, emissions dropped by 3.7% in 2020 and rebounded by less than 1% in 2021. Across advanced economies overall, structural changes such as increased uptake of renewables, electrification, and energy efficiency improvements avoided an additional 100 Mt of CO2 emissions in 2021 compared with 2020.
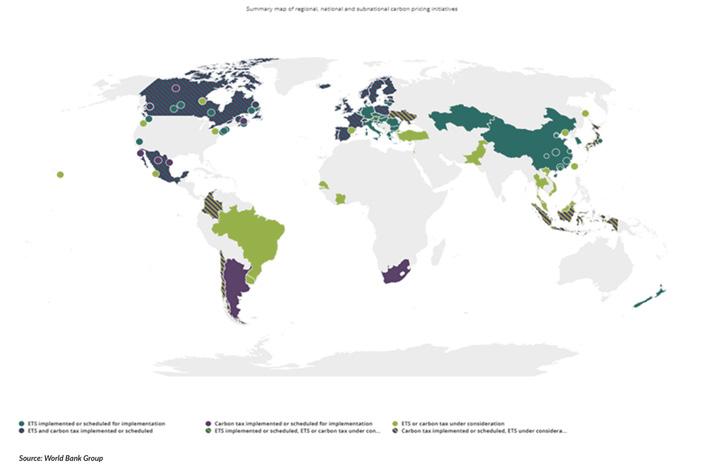
SUMMARY MAP OF REGIONAL, NATIONAL, AND SUB-NATIONAL CARBON PRICING INITIATIVE
Source: EQiSearch
NUMBER OF MECHANISM WITH GHG EMISSION
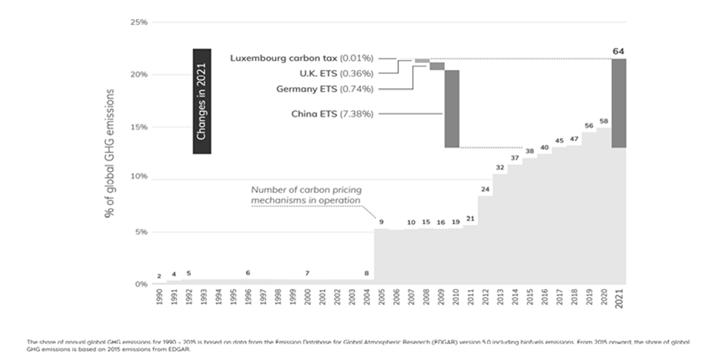

Source: World Bank Source: EQiSearch
SHARE OF GLOBAL GREENHOUSE GAS EMISSIONS COVERED BY CARBON TAXES AND EMISSIONS TRADING SYSTEMS
In March 2021, the Chinese government announced the 14thFive Year Plan, which included energy and climate goals for 2021–2025. The plan proposes a 13.5% reduction in energy intensity and an 18% reduction in CO2 emissions intensity from 2020 levels. A 20% target for non-fossil energy in total energy consumption was also outlined. More detailed climate targets, including an economy-wide CO2 emissions cap (independent of the ETS), will likely be outlined in the forthcoming 14thFive Year Plan on GHG Emissions Control and Prevention. Energy sector-specific plans are expected to be released later in a year, which is also anticipated to contain targets on coal consumption and production, as well as renewable energy development. The Ministry of Ecology and Environment (China) is also working on an action plan to peak CO2 emissions by 2030, including the development of action plans and targets at the provincial and industry level. These targets can help design an absolute cap for the national ETS. In addition, policy developments in the energy sector will also interact with China’s national ETS. These include the energy use quota exchange policy, which has been identified as a priority for 2021 and is being developed by the Environment and Natural Resource Department at the National Development and Reform Commission. The design for the national energy use quota market is due to be released by the end of 2021. The national Renewable Portfolio Standard was launched in 2020, with the province, grid, and company-wide targets to be established. Covered entities can also trade green certificates to reach their targets. The influence of these policies on the electricity market will have a connection with the national ETS cap and allocation. Finally, China’s ongoing structural reform to liberalize the power sector may also open the possibility of regulating direct emissions in the future. Currently, due to China’s regulated power structure, both direct and indirect emissions are covered under the national ETS.


Source: EQiSearch

In 2020, the European Green Deal was also announced, including a proposal for the European Climate Law legislating a 2050 climate neutrality objective and a 2030 Climate Target Plan to reduce net emissions by at least 55% by 2030. There will be a revision of the EU ETS, with a proposal expected in June 2021 to align it with the more ambitious 2030 target. The EU is planning to extend the ETS to maritime transport, ensure the contribution of the aviation sector is in line with new objectives, and assess the possibility of also extending carbon pricing to the transport and buildings sectors.
Following its departure from the EU, the United Kingdom stopped participating in the EU ETS on January 1, 2021. On the same day, the U.K. ETS came into operation, closely resembling the design of Phase 4 of the EU ETS. Covering the power, industry, and domestic aviation sector, the cap will reduce emissions by 4.2 MT (Metric tons) annually and will be revised in 2024 in line with the country’s 2050 net-zero trajectory.
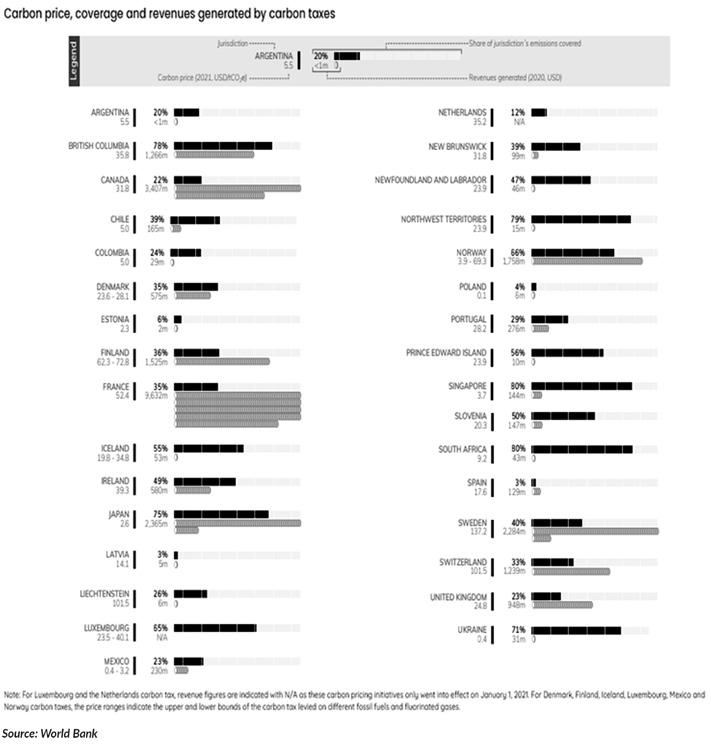
Germany’s national fuel ETS also came into operation, covering all fuel emissions not regulated under the EU ETS around 40% of national GHG emissions. The Netherlands Industry Carbon Tax Act (Wet CO₂- Heffing Industries) entered into force on January 1, 2021, with a rate of EUR 30 ($35.24)/tCO2e. The policy targets industrial installations in the Netherlands subject to the EU ETS acting as a top-up fee as well as waste incinerators and facilities emitting large amounts of nitrous oxide that are not covered under the EU ETS. Luxembourg’s carbon tax, which covers emissions from transport, shipping, and buildings, also started operation at EUR 31.56 ($37.07)/tCO2 for petrol, EUR 34.16 ($40.12)/tCO2 for diesel, and EUR 20 ($23.49)/tCO2 for all other energy products except electricity. In July 2020, the Mexican state of Tamaulipas passed legislation enacting a carbon tax starting in 2021, equivalent to about MXN 250 ($12.23)/ tCO2e to fixed sources and facilities that emit more than 25 tCO2e of GHG monthly. A majority of carbon prices remain far below the $40–80/tCO2e range needed in 2020 to meet the 2°C temperature goal of the Paris Agreement. Even higher prices will be needed over the next decade to reach the 1.5°C targets. In the Republic of Korea, prices fell from May 2020 onward before starting to move up again in late summer, while the California–Quebec market price stayed around the auction floor price of $ 16.68/ tCO2e. Though auctions were undersubscribed in May and August 2020, stronger demand returned by November. In the Regional Greenhouse Gas Initiative (RGGI), prices also remained relatively stable. This provides a stark contrast to the 2007–2008 financial crisis and subsequent economic downturn, which led to sustained price depressions across multiple systems.

Price Increases in Carbon Taxes and Emissions Trading Systems Jurisdiction Carbon Pricing Instrument 2020 Price Price Increase
Latvia Carbon tax
Canada Federal backstop (output-based pricing system and carbon tax) EUP 9 ($10.57) CAD 30/ tCO2e ($23.88) EUR 12/tCO2e ($14.1/tCO2e)
CAD 40/tCO2e ($31.83/tCO2e) Post-2021: CAD 15/tCO2e (11.94 $/tCO2e) annual increase to reach CAD 170/tCO2e ($ 135.30 /tCO2e) by 2030
Ireland Carbon tax EUR 26/ tCO2 ($30.54/ tCO2e) Tax rate for petrol and diesel to EUR 33.5/tCO2 ($39.35/tCO2e), the same increase applies to other fuels from May 1, 2021 Target rate for 2030 increased from EUR 80/ tCO2 to EUR 100/tCO2 ($93.97 to $117.46 / tCO2e)2
Germany National fuel ETS Rises to EUR 55 ($ 64.60) by 2025
Source: World Bank Source: EQiSearch



Source: EQiSearch
