journal Issue 26 | October 2019 Communicating Astronomy with the Public
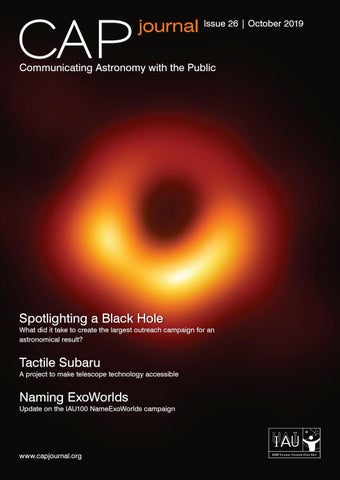
Spotlighting a Black Hole
What did it take to create the largest outreach campaign for an astronomical result?
Tactile Subaru
A project to make telescope technology accessible
Naming ExoWorlds
Update on the IAU100 NameExoWorlds campaign
www.capjournal.org
News News
As part of the 100th anniversary commemorations, the International Astronomical Union (IAU) is organising the IAU100 NameExoWorlds global competition to allow any country in the world to give a popular name to a selected exoplanet and its host star. The final results of the competion will be announced in Decmeber 2019. Credit: IAU/L. Calรงada.
Editorial Welcome to the 26th edition of the CAPjournal! To start off, the first part of 2019 brought in a radical new era in astronomy with the first ever image showing a shadow of a black hole. For CAPjournal #26, part of the team who collaborated on the promotion of this image hs written a piece to show what it took to produce one of the largest astronomy outreach campaigns to date. We also highlight two other large outreach campaigns in this edition. The first is a peer-reviewed article about the 2016 solar eclipse in Indonesia from the founder of the astronomy website lagiselatan, Avivah Yamani. Next, an update on NameExoWorlds, the largest IAU100 campaign, as we wait for the announcement of new names for the ExoWorlds in December. Additionally, this issue touches on opportunities for more inclusive astronomy. We bring you a peer-reviewed article about outreach for inclusion by Dr. Kumiko Usuda-Sato and the speech “Diversity Across Astronomy Can Further Our Research” delivered by award-winning astronomy communicator Dr. Amelia Ortiz-Gil at the IAU100 Flagship event in Brussels earlier this year. Now, looking toward the future, we at CAPjournal will be building upon our know-how and best practices of ten years of existence and implementing new changes to policies and practices in order to better serve you in our community and one of the best planets in the universe, Earth: Diverse Editorial Board The astronomy outreach and education community is diverse, working in many areas of life and culture everywhere in the world. In order to mirror this diversity of you, the astronomy communication practitioners, we will identify and invite people with a variety of outreach, education, and communication expertise from across the globe to form a new, dynamic Editorial Board. Greener Policies We who publish the CAPjournal at the IAU Office of Astronomy Outreach are committed to reducing our ecological impact. Twice a year we publish more than 6000 copies and ship to nearly 5000 addresses worldwide—a small burden on the environment, but a burden nonetheless. Beginning with this edition we will be reducing our printed edition, checking in with our subscribers and facilitate better digital access. We will continue to make the CAPjournal accessible to everyone, but we hope you will join us as we transition into other ways that reduce our carbon footprint even more. CAPjournal is reaffirming its entrance into the next decade and will continue to address the needs of the larger community into the 2020s and beyond. Stay tuned as we move forward together. Clear skies and great observations,
Contents Explained in 60 Seconds: The First Ever Image of a Black Hole 4 IAU100 NameExoWorlds: A Call to Promote Global Citizenship 5 Diversity Across Astronomy Can Further Our Research 7 An Unprecedented Global Communications Campaign for the Event Horizon Telescope First Black Hole Image 11 Touch the Universe: Developing and Disseminating Tactile Telescope Models Created with a 3D Printer 24 Strategising the New Media Role for Engaging the Public Case Study: Total Solar Eclipse 31
Lina Canas Editor-in-Chief of CAPjournal Izumi Hansen Managing Editor of CAPjournal
News Announcement Opinion Cover: The first direct visual evidence of a supermassive black hole in the centre of Messier 87 was captured by a global, decades long campaign by the Event Horizon Telescope (EHT) Collaboration. Credit: EHT Collaboration
Best practice Research & Applications
Column
Explained in 60 Seconds: The First Ever Image of a Black Hole Kazuhiro Hada National Astronomical Observatory of Japan kazuhiro.hada@nao.ac.jp
Earlier this year the world was hit with one of the biggest astronomical breakthroughs this decade: the first image of a black hole. Even to astronomers, black holes are one of the most mysterious objects in the Universe. About a century ago, the existence of a black hole was predicted from Einstein’s general theory of relativity. Its strong gravity warps the surrounding spacetime and anything nearby, even light, can be absorbed into the black hole. Astronomers now widely theorise
that a massive black hole exists at the center of almost every galaxy. Although a black hole itself does not shine, the accreting matter surrounding the black hole becomes so hot that it emits intense radiation. As a result, the black hole is expected to be pictured as a dark “shadow” surrounded by the bright ring of emissions. However, the angular extent of the shadow is so tiny on the sky that no direct picture of the black hole shadow had ever been obtained. Even for the nearest super-
massive black hole, an angular resolution at least 1000 times better than the Hubble Space Telescope was required to spatially resolve its shadow. This imaging feat required astronomers from around the world to assemble a global network of radio telescopes, called the Event Horizon Telescope (EHT). The resulting Earth-sized diameter radio telescope achieved a super-sharp angular resolution to capture the image of the black hole. Initial observations began in April 2017, when the EHT observed the core of M87, a supergiant elliptical galaxy located at 55 million light-years from the Earth. Following careful data calibration and analysis lasting two years, the team released the first EHT image of M87*, the center of galaxy Messier 87, in April 2019 (Figure 1). The image reveals a bright circular ring surrounding a dark central area. The obser ved feature is in beautiful agreement the prediction from Einstein’s theory as well as recent state-of-the-art supercomputer simulations. Furthermore, from the observed diameter of the ring, the mass of the central black hole was determined to be 6.5 billion times that of the Sun. The detection of the dark shadow is the first-ever visual evidence for a black hole and shows the extreme real-life distortion of spacetime just near the event horizon. This image opens a new window for black hole physics and astronomy. The EHT network is still rapidly evolving by adding more stations and enhancing sensitivity. Further EHT observations of M87* and other nearby supermassive black holes will yield higher quality images and the possibility of movies, which will tell us in even greater detail about the physics of black holes and gas dynamics.
Figure 1. The first image of the shadow of a black hole, located at the centre of galaxy M87. Credit: EHT Collaboration
4
CAPjournal, No. 26, October 2019
Announcement
IAU100 NameExoWorlds: A Call to Promote Global Citizenship Eduardo Monfardini Penteado
downer@strw.leidenuniv.nl Bethany Downer
IAU100 NameExoWorlds nameexoworlds@oao.iau.org
IAU100 Secretariat downer@strw.leidenuniv.nl
Jorge Rivero González IAU100 Coordinator rivero@strw.leidenuniv.nl Bethany Downer IAU100 Secretariat
IAU100 NameExoWorlds is a global project designed by the International Astronomical Union (IAU) in celebration of the organisation’s first hundredth anniversary in 2019. People from all over the world are invited to suggest names for exoworlds in a global effort to bring astronomy closer to the public and to stimulate a feeling of global citizenship.
Introduction The 100th anniversary of the International Astronomical Union (IAU)1 is an important milestone being enthusiastically celebrated through thousands of local, regional and global activities taking place worldwide. These events have
included stargazing for people who are elderly or refugees, dark skies celebrations, and parties for the 50th anniversary of the moon landing. For the anniversary, the IAU, through the IAU100 NameExoWorlds Steering Committee and national committees, is
organising the IAU100 NameExoWorlds global initiative2 (Figure 2). Typically astronomical names are chosen by members of specific groups within the IAU3. But the NameExoWorlds project, based on a previous edition held in 2015, invites countries to develop their own national contest to select a name for an assigned system
Figure 1. An artist’s impression of the Proxima b planet of the red dwarf star Proxima Centauri. Credit: ESO/M. Kornmesser
CAPjournal, No. 26, October 2019
5
IAU100 NameExoWorlds: A Call to Promote Global Citizenship
composed of one exoplanet and its host star (Figure 1), allowing the members of the public to engage with the planetary naming process. This way the chosen names will represent well-known characteristics of each participating country, increasing the interest for astronomy within the country and providing the opportunity to each state to immortalize its own culture in the sky.
National Outreach Coordinators (NOC), under the umbrella of the IAU Office for Astronomy Outreach (IAU OAO). Countries without NOCs also had the chance to create their own national committees. All United Nations (UN) Member States, plus UN Observer States, and all dependent territories were welcomed to participate in an inclusive effort to engage the whole world in this special initiative.
to answer these mysteries firsthand—we hope that people will find the value in preserving Earth and think of themselves as citizens of our one, isolated planet.
What Are Exoworlds?
Each national committee has been collecting names from the public, and most committees, as of October 2019, will then shortlist potential names. Some committees will put these names up for a national public vote while others will do the vote themselves. These votes will take place between October 2019 and November 2019. If the chosen names are in agreement with all IAU naming rules and approved by the IAU, they will be accepted as official names of those stars and planets.
The IAU approved names from all countries’ final submissions will be released all at once in December 2019.
The term “exoworlds” refers to, in the context of this project, the systems composed of one exoplanet and their host star. Each participating country was assigned one system that is known to consist of one gas giant planet orbiting a single star, so all participating countries have the opportunity to name similar celestial objects. When possible, the assigned systems are somehow linked to the countries by the facilities or scientists involved in the discovery of the exoplanet. Additionally, all assigned stars can be observed with a small telescope from the latitude of the capital of each country.
How Does the Project Work? The core idea of the project is to engage as many people as possible in a global effort to name these exoworlds through national public contests. National committees have been created in each participating country to be responsible for developing the respective naming projects at the national level. Most of the national committees were formed by the local
The chosen popular names that meet the IAU criteria will be officially recognised by the IAU, and be used in conjunction with the scientific designations. Those who suggested the selected names will be recognized for their contribution.
Notes 1
https://www.iau-100.org/
2
http://www.nameexoworlds.iau.org/
3
https://www.iau.org/public/themes/naming/
Results Thus Far To date, about 100 countries are par ticipating in the project by organizing national contests, proving that the public interest in astronomy is substantial. As a global and multicultural project in its nature, we expect millions of people around the world to be engaged in the project by the end of the initiative. Countries worldwide have embraced this initiative as a common goal: to unite in global citizenship on our planet, one world among many. By feeling a connection to other planets—-developing an interest in their unanswered mysteries and understanding that we won’t be able
Biographies Eduardo Monfardini Penteado is the IAU100 NameExoWorlds coordinator based in Rio de Janeiro, Brazil. Jorge Rivero González is the IAU 100 Coordinator based in Leiden University, the Netherlands. B e t h a ny D o w n e r i s t h e I AU10 0 Communications Editor based in Leiden University, the Netherlands. Figure 2. Logo for the IAU100 NameExoWorlds initiative. Courtesy of the IAU100 NameExoWorlds initiative
6
CAPjournal, No. 26, October 2019
Amelia Ortiz-Gil
Keywords
Astronomy Observatory of Valencia, Spain amelia.ortiz@uv.es
Diversity, inclusion, research
Opinion
The Use of Picture Postcards in Disseminating Diversity Across Astronomy Can Further Our Research Astronomy
Astronomer Amelia Ortiz-Gil delivered a speech on the impact of inclusion and diversity in astronomy at the IAU100 Flagship event in Brussels, Belgium on April 12, 2019. The following opinion piece is adapted from her speech. Let me start with a small quiz: What do these people have in common? Leonardo da Vinci, Isaac Newton, John Goodricke, Thomas Edison, Albert Einstein and Stephen Hawking. They are famous. They were all scientists—all male and white, by the way. And, most interestingly, they all experienced some kind of disability, either physical or cognitive. Da Vinci probably was dyslexic. Newton suffered from stuttering and epilepsy, and probably from some form of autism, too. Goodricke was deaf. Edison was almost completely deaf and had a learning disability. Albert Einstein also had a learning disability and possibly dyslexia, while Hawking suffered from amyotrophic lateral sclerosis (ALS). They are examples of individuals with a disability that in some way or another found the means and support to thrive—
Years
and excel—in science. But how many others have not been as lucky? There is an unknown but certainly not negligible number of talented individuals that may think they are not apt for science because they have a disability. Often this idea gets reinforced when they find that the required knowledge and tools are out of their reach because these tools are closed behind some barriers. But in most cases these barriers are just the product of arbitrary decisions that are not inherent to the knowledge itself. Take, for example, a graph. Below are two versions of the same graph (Figure 1). The graph on the left uses only colour for coding, which is highly not colour-blind friendly. The left one uses both colour and shapes to distinguish different lines. This graph is not only more colour-blind friendly; it is also better for anyone who can see it.
People can feel so discouraged by these types of obstacles that they don’t even try. And this barrier is made even worse if they belong to a racial or cultural minority or an underserved social group (Hamrick, 2019). But how many people with disabilities are there? Estimates of the proportion of the population with one or more disabilities are very hard to make because they vary depending on the definition of the term “disability.” According to a 2016 report published in the USA, about 11% of the working-age population reported some type of disability. A 2019 report stated that 19.5% of undergraduate students reported a disability (Hamrick, 2019). Another study, this one in Europe, claims that up to 10% of the population, or 2 to 3 pupils in every classroom, are affected by specific learning disabilities, such as dyslexia, dyscalculia and autism
Years
Figure 1. Examples of graphs that are not colour-blind friendly (left) and colour-blind friendly (right) based on colour and shape. Credit: Penn State University
CAPjournal, No. 26, October 2019
7
Accessibility and Diversity in Astonomy
(Butterworth, 2013). This study also indicated that children are frequently affected by more than one learning disability. The report Women, Minorities and Persons with Disabilities in Science and Engineering (Hamrick, 2019) from the National Science Foundation provides statistical information about the participation of these three groups in science and engineering education and employment. In summary, it shows how women, persons with disabilities, and minority groups are clearly underrepresented in science and engineering. That is, their representation in these fields is smaller than their representation in the general population. So, what can be done to avoid this loss of talent and to improve the scientific excellence of research groups and institutions at the same time?
influence on those areas, too. This exchange enriches all the sciences involved. Likewise, diversity in research teams is highly enriching. Diversity in research teams leads to diversity in research methods and diversity in the questions that are being asked. People who are different bring unique information and experiences, broadening the viewpoints and leading to innovative solutions.
Inclusion is reached by creating a safe environment in which everybody can speak out and act freely without fear of embarrassment, where individuals feel like they belong and have value, and where everybody is treated equally and treated with respect. In creating this safe environment, managers and leaders play a fundamental role, and it is therefore very important that they are committed to achieving inclusion in their teams. It is critical also to embrace the differences, taking advantage of what diversity has to offer, and not to just ignore them and pretend that they do not matter. Finally, diversity and inclusion must go hand in hand because diversity without inclusion is far less effective.
During the last decade or so, many sociological studies have found that inclusive and diverse research groups and institutions are more successful than more homogeneous ones. Some of the reasons to support these results are quite intuitive. For example, scientific excellence depends on creativit y, and diversit y fosters c reati vit y bec ause of people’s di f fe re nt bac kgrounds, abili t ie s (functional or other), culture, and so on. These translate into different ways to address and resolve problems. The search for diversity allows us to draw candidates from the widest possible pool of talent, embracing people that are diverse in background, functional abilities, culture, race, etc. (Harvard, 2018). Not only do they provide new information because of their different backgrounds, but interacting with people who are different forces us to become better, more precise communicators because we have to prepare better, anticipate alternative points of view and expect that reaching a consensus will take effort (Phillips, 2014; Powell, 2018). Diversity also helps us learn to overcome cultural biases and misunderstandings, leading to more tolerant and inclusive environments. Research groups that are diverse report increased productivity, more citations, and increases in grant income (Powell, 2018).
Astronomy is by its own nature an example of inclusion of sciences, as well as culture and philosophy. It gathers together different fields from many other fundamental sciences like mathematics, physics, chemistr y, geology and many more. That means that astronomy benefits from discoveries made in other areas, and that astronomy has an
I will just mention a case recently published in Nature (Gewin, 2018). The Dunlap Institute for Astronomy and Astrophysics of the University of Toronto in Canada established more equitable hiring practices. And after five years, the percentage of women in the institute rose from 25% to 49%, grant income rose by a factor of 26 and citations increased by a factor of 10. In the Nature article,
The answer is through diversity and inclusion. In the contex t of this discussion, by diversity I mean a variety of race, gender, functional abilities, socio-economic background, culture, religion, education and so on.
8
Figure 2. Inspiring Stars logo. Credit: IAU/Inspiring Stars
the director of the institute, Prof. Bryan Gaensler, claims that his experience shows that “more-diverse teams lead to excellent research.” On the other hand, in recent years many regulations have been passed at the national and international level concerning accessibility and inclusion policies. I would like to mention one that is relevant in our case. The International Council for Science (now the International Science Council, or ISC), in its Statute 5, presents the Principle of Universality of Science. It includes the need for equitable access to data, information, and other resources for research. And in advocating the free and responsible practice of science, the ISC promotes equitable opportunities for access to science and its benefits, and opposes discrimination based on such factors as ethnic origin, religion, citizenship, language, political or other opinion, sex, gender identity, sexual orientation, disability, or age. The International Astronomical Union (IAU) is a member of the Council and following this mandate created the Working Group on Astronomy for Equity and Inclusion in 2015, after discussions about it at the 2015 General Assembly in Hawaii. It is currently composed of around 200 members. Most of them are astronomers and experts in accessibility, while some are outreach professionals and educators. The working group deals mainly with the topics of visual impairments, deafness, motor disabilities, neurological diversity, behavioural disabilities, patients in hospitals, and inclusion of minorities.1
CAPjournal, No. 26, October 2019
The main goals of the Working Group on Equity and Inclusion are to gather a community of experts that will identify and find solutions to challenges in accessibility in addition to compiling and developing new tools, online resources, and best practices to eventually propose formal declarations for the endorsement of the IAU. The working group is collaborating closely with two IAU offices, the Office of Astronomy for Development and the Office for Astronomy Outreach. The work thus far has resulted in the traveling exhibit Inspiring Stars (Figure 2), an exhibit to promote the concept of “inclusion” at outreach, instructional, and professional levels. The exhibit also aims to broaden the horizons of children, parents, teachers and astronomers through showcasing assistive research tools for inspiring a love of science and the possibility of contributing to research in spite of apparent obstacles. Our work has also resulted in a dedicated IAU webpage to news, best practice guidelines, and resources for specific disabilities. One resource, for example, is the first comparative sign language dictionary for astronomical terms. The working group organised a one-day meeting on astronomy and inclusion in 2016 in Colombia and this year we are organising a symposium in Tokyo, Japan titled Astronomy for Equity, Diversity and Inclusion. We will discuss best practices in accounting for disabilities; barriers to access; new technologies 2; astronomy for society, sustainable development goals; the IAU100 perspectives on equity, diversity and inclusion; and diversity in research. One of the outcomes of this meeting will be The Mitaka Resolutions. This document will describe a set of viewpoints and propose subsequent actions, in alignment with the new IAU Strategic Plan 2020-2030 towards achieving higher levels of equity, diversity and inclusion in astronomy. The Mitaka Resolutions will be submit ted to the IAU Executive Committee to be officially endorsed by the IAU General Assembly in Korea in 2021.
There are many challenges that we have to overcome in our goal to reach effective diversity and inclusion in science. To name a few, there are unconscious biases, hiring processes tailored for just part of the potential applicants, admission tests that are biased against women and minorities, physical barriers to access the scientific information, discomfort or interpersonal conflicts caused by diversity in groups, and many more (Miller et al., 2014; Plaut, 2014; Cooper, 2015; Moss-Racusina et. al., 2012; Dobbin et al., 2016; Welle et al., 2014; Amodio, 2014; Booksh et al., 2018). Many of these challenges were addressed at the firstiinclusive astronomy meeting that was held at Vanderbilt University in the USA in 2015. The main outcome of the meeting were the Nashville Recommendations for Inclusive Astronomy, a document that was afterwards endorsed by the American Astronomical Society. Large astronomy projects are also incorporating inclusion policies and guidelines, like the creation of COINS (Committee On Inclusion iN SDSS) at the Sloan Digital Sky Survey.
2 These technologies include reading devices for the blind, 3D printers and thermal printers for the blind, tactile tablets, hearing aids for the deaf, software that translates spoken sentences into written ones, captioning technologies, online sign language dictionaries, adaptations of telescopes for people in wheelchairs, and so on.
References Amodio, D.M., ‘The Neuroscience of Prejudice and Stereotyping’, Nature Reviews Neuroscience, 15, 2014, p. 670-682. https:// www.nature.com/articles/nrn3800 Booksh, K.S., Madsen, L.D., ‘Academic Pipeline for Scientists with Disabilities’, MRS Bulletin, 3, 8, 2018, p.625-632. https://www. cambridge.org/core/journals/mrs-bulletin/ article/academic-pipeline-for-scientists-with-disabilities/864A63ED2F88AC7EB3D1E3F6214D2352 Butterworth, B., Kovas, Y., ‘Understanding Neurocognitive Developmental Disorders Can Improve Education for All’, Science, 340, 6130, 2013, p. 300-305. https://science.sciencemag.org/content/340/6130/300 Cooper, M., ‘The False Promise of Meritocracy’, The Atlantic, 2015. https:// www.theatlantic.com/business/ archive/2015/12/meritocracy/418074/
We now have the responsibility to ensure inclusion and diversity are taken into account in how science will be made in the future. To accomplish this we already have tools like the Nashville Recommendations and the future Mitaka Resolutions, and specific working groups on astronomy and inclusion in some astronomical societies and projects. So, please remember: Diversity and inclusion foster excellence in science. Do not miss the chance to implement them in your institutions and research teams!
Dobbin, F., Kalev, A., ‘Why Diversity Programs Fail’, Harvard Business Review, July-August, 2016. https://hbr.org/2016/07/why-diversity-programs-fail
You can learn more about the IAU Working Group for Equity and Inclusion at http://sion.frm.utn.edu.ar/iau-inclusion/
Harvard University Presidential Task Force on Inclusion and Belonging, ‘Pursuing Excellence on a Foundation of Inclusion’, Harvard University, 2018. https://inclusionandbelongingtaskforce.harvard.edu/final-report
Notes 1 Issues related to gender are covered by the IAU Working Group of Women in Astronomy.
Diversity Across Astronomy Can Further Our Research
Gewin, V., ‘What does it take to make an institution more diverse?’, Nature 558, 2018, p. 149-151. https://www.nature.com/articles/ d41586-018-05317-4 Hamrick, K. et. al.,‘Women, Minorities, and Persons with Disabilities in Science and Engineering’, National Science Foundation, National Center for Science and Engineering Statistics, 2019. https://ncses.nsf.gov/pubs/ nsf19304/
Miller, C., Stassun, K., ‘A Test that Fails’, Nature, 510, 7504, 2014, p. 303-304 Moss-Racusina, C. A., Dovidiob, J.F., Brescollc, V.L., Grahama, M.J., Handelsmana, J., ‘Science Faculty’s Subtle Gender Biases Favor Male Students’ PNAS, 109, 41, 2012, p.16479. https://www.pnas. org/content/pnas/109/41/16474.full.pdf
9
Accessibility and Diversity in Astonomy
Phillips, K.W.,‘How Diversity Makes Us Smarter’, Scientific American, 311, 4, 2014, p. 42-47. https://www.scientificamerican. com/article/how-diversity-makes-ussmarter/ Plaut, V., ‘3 Myths Plus a Few Best Practices for Achieving Diversity’, Scientific American, 311, 4, 2014, p.52-57. https://www.scientificamerican.com/article/3-myths-plus-a-fewbest-practices-for-achieving-diversity/ Powell, K., ‘These labs are remarkably diverse — here’s why they’re winning at science’, Nature, 558, 2018, p. 19-22. https://www. nature.com/articles/d41586-018-05316-5 Welle, B., Smith, M., ‘Time to Raise the Profile of Women and Minorities in Science’, Scientific American, 311, 4, 2014, p.54-55. https://www.scientificamerican.com/article/ time-to-raise-the-profile-of-women-and-minorities-in-science/
Biography Amelia Ortiz-Gil is an astronomer working in outreach and education at the University of Valencia in Spain. She is an award-winning astronomy communicator, creating the groundbreaking “A Touch of the Universe” kit for the blind and visually impaired and tactile globes of the Moon, Mercury, Mars, and Venus (so far). She is the chair of the International Astronomical Union (IAU) Working Group of Astronomy for Equity and Inclusion and is the IAU National Outreach Coordinator for Spain.
journal
Communicating Astronomy with the Public
r
Dear Readers, Please contribute to improving CAP journal, by filling in our short questionnaire at: https://www.capjournal.org/survey.php
We welcome your feedback! 10
CAPjournal, No. 26, October 2019
Lars Lindberg Christensen European Southern Observatory lars@eso.org
Mislav Baloković Center for Astrophysics | Harvard & Smithsonian mislav.balokovic@cfa.harvard.edu
Mei-Yin Chou Academia Sinica Institute of Astronomy and Astrophysics cmy@asiaa.sinica.edu.twl
Suanna Crowley HeadFort Consulting, LLC suanna@myheadfort.com Peter Edmonds Center for Astrophysics | Harvard & Smithsonian pedmonds@cfa.harvard.edu Valeria Foncea Joint ALMA Observatory Valeria.Foncea@alma.cl Masaaki Hiramatsu National Astronomical Observatory of Japan hiramatsu.masaaki@nao.ac.jp
Colin Hunter Perimeter Institute for Theoretical Physics chunter@perimeterinstitute.ca
Eduardo Ros Max-Planck Institute für Radioastronomie eros@mpifr-bonn.mpg.del
Katharina Königstein Radboud University k.konigstein@astro.ru.nl
Oana Sandu European Southern Observatory osandu@partner.eso.orgl
Sarah Leach European Southern Observatory reachingsarahleach@gmail.com
Calum Turner European Southern Observatory calum.talkscience@outlook.com
Nicolás Lira Joint ALMA Observatory Nicolas.Lira@alma.cl
Megan Watzke Center for Astrophysics | Harvard & Smithsonian mwatzke@cfa.harvard.edu
Mariya Lyubenova European Southern Observatory mlyubeno@eso.org
Best Practice
An Unprecedented Global Communications Campaign for the Event Horizon Telescope First Black Hole Image
Karin Zacher Institut de Radioastronomie de Millimétrique zacher@iram.fr
Satoki Matsushita Academia Sinica Institute of Astronomy and Astrophysics satoki@asiaa.sinica.edu.tw Harriet Parsons East Asian Observatory h.parsons@eaobservatory.org
Keywords Event Horizon Telescope, media relations, black holes
An unprecedented coordinated campaign for the promotion and dissemination of the first black hole image obtained by the Event Horizon Telescope (EHT) collaboration was prepared in a period spanning more than six months prior to the publication of this result on 10 April 2019. This article describes this unusual campaign and its outcomes.
Due to the viral nature of the dissemination of this result, we believe it is reasonable to conclude that over half of the world’s population now know that humankind has taken an image of a black hole. The potential global readership was on the order of billions, possibly as much as 4.5 billion. The result trended as number one on Twitter globally, reached the top spot on Google News, got its own Google Doodle, and was the most popular story ever published for many scientific organisations involved. The authors believe this has led to a significant boost for the EHT, for the involved obser vatories and organisations, for astronomy, for
CAPjournal, No. 26, October 2019
science and for peaceful international collaboration.
Introduction On 10 April 2019, the EHT Collaboration announced the first-ever image of a black hole, specifically M87* in the galaxy Messier 87. The data were obtained by sophisticated interferometry using eight radio telescopes: • Atacama Large Millimeter/submillimeter Array (ALMA) • Atacama Pathfinder EXperiment (APEX) • The IRAM 30-meter telescope
• The James Clerk Maxwell Telescope (JCMT) • The Large Millimeter Telescope Alfonso Serrano (LMT) • The Submillimeter Array (SMA) • The Submillimeter Telescope (SMT), and • The South Pole Telescope (SPT)
Astrophysicist and author Ethan Siegel1 from Forbes elegantly sums up the discovery itself: The story of the Event Horizon Telescope is a remarkable example of high-risk, high-reward science. During the 2009 decadal review, their ambitious proposal
11
An Unprecedented Global Communications Campaign for the Event Horizon Telescope First Black Hole Image
After months of preparation, six coordinated press conferences began at 13:00 UTC: • Brussels (English, with at least 12 satellite events2) • Santiago (Spanish) • Shanghai (Mandarin) • Taipei (Mandarin) • Tokyo (Japanese) • Washington, D.C. (English)
At exactly 13:07 UTC the image was unveiled at all press conferences either through a state-of-the-art zoom video 3 (produced by ESO) or through showing the black hole image. News of this result was covered in most major media around the world and went viral on social media. This led to unprecedented coverage.
The Preparation of the Campaign
Figure 1. Some of the many newspaper front pages on 11 April 2019. Credit: Eduardo Ros
declared that there would be an image of a black hole by the end of the 2010s. A decade later, we actually have it. That’s an incredible achievement. It relied on computational advances, the construction and integration of a slew of radio telescope facilities, and the cooperation of the international community. Atomic clocks, new computers, correlators that could link up different observatories, and many other new technologies needed to be inserted into every one of the stations. You needed to get permission. And funding. And testing time. And, beyond that, permission to observe on all the different telescopes simultaneously. But all of this happened, and wow, did it ever pay off. We are now living in the era of black hole astronomy, and the event horizon is there for us to image and understand. This is just the beginning. Never
12
has so much been gained by observing a region where nothing, not even light, can escape. An unprecedented coordinated campaign between the involved institutions for the promotion of this high-profile science story began in October 2018, with weekly alignment video conferences amongst all layers of the collaboration (sometimes several a week). A big focus of the work was confidentiality since the result had one singular visual — the image of the black hole — which would essentially give away the entire story if leaked, possibly nullifying all the preparation. The excitement of the work was significant and the tension high while preparing to communicate the results widely and at the same time keeping sensitive information with big visual impact from leaking early.
In the summer of 2017, it became clear that although the recent EHT observing campaign of the previous spring could possibly generate groundbreaking science results, the collaboration had not yet developed a communications strategy to announce them. In July of that year, following substantive early conversations, support and encouragement from the National Science Foundation (NSF), the EHT Collaboration began working on a communications plan. With ongoing support from NSF, the communications plan centred on the existing EHT Outreach Working Group (OWG) in order to establish an inclusive, collaborative and representative approach that involved dozens of independent institutions. After nearly 18 months of plan development, on 1 October 2018, the OWG brought together media officers from the collaborating institutions to launch the unprecedented campaign for promotion and dissemination. By October 2018 a group representing more than 100 communicators and communication-savvy scientists from the involved EHT institutions were meeting in weekly video conferences led by the EHT communications coordinator Mislav Baloković. A Teamwork4 site was set up by the Perimeter Institute to allow the group to collaborate. As the weeks went by the scientists in this ad-hoc collaboration assumed a more and more leading
CAPjournal, No. 26, October 2019
role in the communications work, possibly due to the high stakes at play. In general, the excitement among all the collaborators was very high due to the potential impact of the result. The primary focus was on limiting access to the image and result to as few people as possible, and secondarily on the production of content. The OWG meetings established a framework for developing content, strategies and deadlines, as well as opportunities to share those products. Starting in January 2019, parallel weekly meetings led by NSF focused specifically on coordinating the international press conferences, including precise logistical details. Managers of the press conferences, as well as some scientists and representatives from the relevant institutions, including EHT Director Sheperd Doeleman, participated. This burgeoning team did not have the benefit of an established formal, legal or administrative structure or any pre-existing leadership hierarchy (apart from the EHT science collaboration). Nevertheless, they proved capable of coming to agreement, and making and abiding by major decisions regarding the public announcements. The European Southern Observatory (ESO) Public Information Officer Calum Turner took the lead on writing up a joint core press release with allocated spaces for “localised” content and quotes that
could highlight and promote the individual participating organisations and telescopes. This text was then jointly edited by the participating communicators and scientists over the course of several weeks. Collating and integrating the many comments was a herculean effort and allowed everyone in the collaboration to share their suggestions, concerns and views. Most of the press releases published, notably NSF, ESO, the East Asian organisations and the EHT Collaboration, respected the agreed format, but not all — mainly those from organisations who were not part of the above-mentioned group video conferences and hence were not aware of the substantial alignment efforts. While this approach allowed a broad range of opinions to come together, it dramatically increased the coordination workload and would have benefitted from a more predefined approval structure. However, the level of coordination did allow for a very broad, constructive and collaborative approach, leading to many translations (including into Hawaiian, the first such case) and a common pool of impressive visuals (including a Japanese comic 5). A set of in-depth scientist-led factsheets about the EHT and the history of the science leading up to the result were unfortunately never finalised and published.
It was agreed to send out a media advisory announcing the press conferences on 1 April, despite some differing opinions among EHT partners about the form and timing of this communication. On the one hand, it was deemed necessary to give journalists time to reserve flights to participate in the press conferences. On the other hand, the long time period before making the major announcement increased the chances of information leads. This risk was countered by the guideline that collaboration members completely avoid talking to the press before the press conferences, even on background. Some science journalists were sharply critical of this guideline because it seemed unusually restrictive, and there was also concern that competing journalists would receive access to embargoed information, based on experience with past announcements in astronomy. Other journalists accepted the challenge of using publicly available information and wrote templates of articles with the assumption that the project had succeeded. In the end, the lack of leaked information was an impressive achievement by the collaboration. The 10 days of advance notice gave journalists enough time to travel and prepare, and it created a sense of suspense in the media with lots of (sometimes tangential) rumours and interest which in itself generated additional visibility to EHT and its partners (anecdotally, about one-third of all media coverage was registered prior to the event for the Brussels press conference). Such a coordinated public announcement of this scale had never been attempted before in astronomy. This coordination proved remarkably successful. The fact that there were no major leaks of information prior to the 10 April press conferences is demonstrated by the fact that even the media was surprised to learn that results were of M87*, not the widely anticipated Sgr A* observations.
Press Conferences Brussels
Figure 2. The press conference in Brussels. Credit: European Research Council Executive Agency
The Brussels press conference (Figure 2) was held at European Commission’s (EC) Berlaymont building. Over 60 journalists attended the press conference in Brussels, while some 120 registered to
An Unprecedented Global Communications Campaign for the Event Horizon Telescope First Black Hole Image
13
An Unprecedented Global Communications Campaign for the Event Horizon Telescope First Black Hole Image
follow it online. The YouTube live feed reached a peak of some 200 000 viewers. After the press conference, European Research Council (ERC) President JeanPierre Bourguignon and Nobel Laureate Brian Schmidt opened an EHT exhibition in the same venue. According to the internal analysis by the ERC press service using Meltwater and Akio Spotter, the ERC has never had this kind of success before. The press conference in Brussels was broadcasted live by the EC audio-visual service. The press conference YouTube stream 6 has now been seen by more than 3.1 million viewers and has had 13.6 million impressions, 72 000 shares, 62 900 interactions, 58 000 likes and 1600 comments. It quickly became the third most viewed video on the EUTube account. It was the top video for all black hole videos on YouTube on the day of the announcement. In terms of engagement, it was the most successful EUTube7 video ever. More than 500 entities embedded the live stream on their websites. Le Monde hosted more than 2 hours 30 minutes live streaming, which according to the Le Monde website 8 became third best live stream in the history of Le Monde and had a larger online audience than France’s victory at the FIFA World Cup 2018 for football when more than 45 000 people connected. The live stream also appeared on Euronews, Le Figaro, Bloomberg, Sky, El Confidencial, Evening Standard, Agenzia ANSA, Science Alert,
Le Soir, La Libre, CNET Magazine, Wired. it, T-online.de, Sputnik News, Observador. pt, Il Fatto Quotidiano, The Independent and BBC News. At least 92 TV channels, including BBC News, Sky News, Deutsche Welle, TVS Slovenia, ARD and ARTE produced 648 TV reports using live satellite broadcast from the press conference or the audiovisual material prepared in advance by the ERC and Commission’s AV service and distributed on the day of the announcement.
Shanghai
The result meant that science was solidly “put on the agenda” in Brussels, the European hotspot for politicians and news consumers in general, and also that science, possibly for the first time, proved itself to the sceptical Brussels press corps, which is an important cultural change at the EC. Santiago
The press conference in Santiago (Figure 3) was hosted by the Joint ALMA Observatory (JAO) and ESO, and was introduced by the Atacama Large Millimeter/submillimeter Array (ALMA) Director, Sean Dougherty, and ESO’s Director General, Xavier Barcons. It featured presentations from researchers behind the result (ALMA’s Violette Impellizzeri and MIT Haystack Observatory’s Geoff Crew). This event was intended for Spanishspeaking journalists from the local and
Figure 3. Attendees at the press conference in Santiago. Credit: F. Pizarro/ ALMA (ESO/NAOJ/NRAO)
14
international media. The conference was streamed online 9 and on Facebook, YouTube and Twitter-Periscope (54 000 on Facebook, 155 000 viewers on Youtube, and more than 7000 on Twitter (incl. 2400 Live)). The event was attended by at least 35 journalists. The JAO website had 75 000 hits on 10 April and more than 18 000 at the beginning of the press conference. The JAO ALMA Instagram channel doubled from 25 000 to 53 000 followers and the publication had at least 487 mentions in Chilean media. The Shanghai press conference (Figure 4) was hosted by Shanghai Astronomical Observatory (SHAO) at 21:00 CST. Jinliang Hou, Deputy Director of SHAO, hosted the press conference with presentations by Zhiqiang Shen, Director of SHAO, and Rusen Lu, researcher and Head of the Max Planck Partner Group at SHAO. Suijian Xue, Deputy DirectorGeneral of The National Astronomy Observatory of China (NAOC) was also in attendance. The event was covered by almost all of the major Chinese media broadcasters and popular media companies including CCTV, People’s Daily, XinhuaNet, China News, China News Week, Guangming Online, Sina Net, and Science and Technology Daily. Media tracking up to the end of April indicated that the video of the press conference has been watched over 50 million times, with over 5000 stories covering the press confer-
Figure 4 The Shanghai press conference. Credit: Shanghai Astronomical Observatory
CAPjournal, No. 26, October 2019
ence and 52 million interactions related to the press conference on various platforms (e.g. Weibo, People’s Daily Online, XinhuaNet, CCTV website and Tiktok). Alongside the press conference, SHAO produced a series of informative scientific interpretations and eight videos about the black hole. Media tracking up to 18 April indicated that on the social media platform WeChat these articles were read more than 1 million times and these videos were viewed 3.3 million times using TikTok and Xigua Video platform. Taipei
The press conference in Taipei (Figure 5) was hosted by the Academia Sinica (AS) and the Ministry of Science and Technology (MOST) in Taiwan. It was introduced by the President of Academia Sinica, James Liao, and featured presentations from researchers Asada Keiichi and Masanori Nakamura. The conference was streamed online through Facebook and Youtube (956 000 viewers on Youtube and 620 000 on Facebook, which corresponds to about 7% of the Taiwanese population). The press conference live stream has now been viewed more than 1.6 million times. There were more than 50 reports shown in Taiwanese media on 10 and 11 April. More impressively, the President of Taiwan, Ing-Wen Tsai, praised the success of the imaging of the black hole shadow on her Instagram account.
Tokyo
Washington, D.C.
The Tokyo Press Conference (Figure 6) was held at the Tokyo Garden Terrace Kioi Conference facility. Although it was inconveniently late in the evening in Japan (22:00 JST)), 61 journalists and 14 TV crews attended the event. The National Astronomical Observatory of Japan (NAOJ) live stream on YouTube10 and niconico11 had about 85 000 views. The press release on the NAOJ website12 had up until 30 April almost 300 000 pageviews. The major Japanese TV stations NHK and TV Asahi live-streamed the press conference on their app and Twitter account. The tweet by @ALMA_Japan of the image gained 960 000 impressions and 32 000 engagements, both the highest numbers achieved in eight-year history of the account.
The Washington, D.C. press conference (Figure 7) was held at the National Press Club and featured NSF Director France Córdova, EHT Director Sheperd Doeleman, and astronomers Dan Marrone, Avery Broderick and Sera Markoff. More than 56 reporters were in the room (roughly the same as in Brussels). Audiences included more than 735 000 viewers on YouTube and 520 000 on Facebook Live. The YouTube stream14 has by now accumulated 1.3 million views, 22 000 likes, 758 comments, 5.3 million impressions, and 32 667 shares. The Facebook Live feed now has 716 000 views and 60 000 likes and reactions. Other press conferences streamed the Washington, D.C. press conference as the start of their programmes.
NAOJ produced a comic to introduce a brief history of radio interferometry and the EHT project in both Japanese and English. The comic was distributed through Twitter and the NAOJ website. The tweets (two posts) gained 680 000 impressions and 53 000 engagements in total. The comic was also distributed as a PDF and several science centres in Japan posted it as a part of their exhibitions. A simple poster to show the result made by NAOJ (only in Japanese) was also widely used by science centres. The result was mentioned in the regular press conferences of the Japanese Minister of Education, Culture, Sports, Science and Technology (MEXT) and the Chief Cabinet Secretary13.
Following the press conference, NSF facilitated on-camera interviews with such outlets as NBC Nightly News, CBS Evening News and BBC News; calls with the New York Times, the Los Angeles Times and others; and in-depth conversations with National Geographic, the Associated Press, Reuters, USA Today, Xinhua, The Washington Post and dozens of other leading outlets from across the globe (Figure 10). Through coordination with media officers at partnered U.S. research institutions, some of which streamed the Washington, D.C. event, regional press engagement was also strong — more than 145 U.S. broadcast affiliates aired reports that mentioned both EHT and NSF. Analytics identified a
Figure 5. The journalists at the Taipei press conference. Credit: Academia Sinica
Figure 6. The press conference in Tokyo. Credit: NAOJ
An Unprecedented Global Communications Campaign for the Event Horizon Telescope First Black Hole Image
15
An Unprecedented Global Communications Campaign for the Event Horizon Telescope First Black Hole Image
only indicative and should be used with caution and significant caveats15. Several of the people involved with EHT communication made what we nicknamed the “taxi-driver test”: asking random laypeople about black holes (for instance, in taxis), which led to a perceived near-complete coverage in the awareness of the story among random people in the western world (N = ~100). The result reached the top spot on Google News (Figure 8) and Google Trends (Figure 9) show an interesting two-day peak with a relatively long tail of six to seven days of sustained interest.
Impact in Some Selected Cases Figure 7. The US press conference panellists. Credit: National Science Foundation
total of 400 broadcast news stories, with half mentioning NSF. In the afternoon, the presenters gave a briefing sponsored by the House of Representatives Committee on Science, Space and Technology. Staff from both the House and Senate attended as well as committee Chairwoman Rep. Eddie Bernice Johnson (D-TX), Ranking Member Rep. Frank Lucas (R-OK) and Congressman Rep. Don Beyer (D-VA). In a separate press release, Rep. Lucas congratulated the EHT on its success. Later that evening, the Harvard-Smithsonian Center for Astrophysics hosted a reception at the Smithsonian’s National Air and Space Museum for invited guests. On 16 May 2019, Córdova and Doeleman returned to Capitol Hill, this time accompanied by MIT Haystack Observatory Director Colin Lonsdale and EHT scientist Katie Bouman, to testify on the science results before a full committee hearing of the House Committee on Science, Space, and Technology, which was also broadcast on the TV network C-SPAN.
Press Coverage Naturally, the impact of a worldwide campaign of this magnitude is hard to
16
measure. The viewership numbers are reported in the summary above and the hundreds of front pages from around the world, some of which were collected by Eduardo Ros (Figure 1), clearly show the global penetration of the result and the viral nature of its coverage. On 10 April, Rick Fienberg, the press officer for the American Astronomical Society (AAS) sent out around 20 press releases which were just a fraction of the total estimated 40-50 press releases produced. Thousands of major news outlets reported on the story, which led to unprecedented coverage. According to news chief Ray Villard at Space Telescope Science Institute, the EHT image made 3500 online articles with a potential 4.5 billion readers (as an upper limit). The Bennet Group in Hawaii reported a similar number of theoretical maximum readership for a narrower subset of the storyline: “Aggregate Readership: 4 673 590 910 for reflecting media results directly attributable to Bennet Group’s collaboration with James Clerk Maxwell Telescope and Submillimeter Array”. Cision Analytics identified more than 1000 news articles mentioning both EHT and NSF, with a theoretical maximum audience of up to 2.2 billion unique viewers. Such theoretical readership numbers are naturally
The collaboration’s website16 received unprecedented traffic in the days leading up to the press conference, the day of the event itself, and the immediate period that followed. During March 2018 the website received roughly 600 visitors daily, but on 8 and 9 April this surged to about 50 000 visitors per day, before spiking to 450 000 visitors on the day of the press conference. The two days immediately following the press conference saw 130 000 and 42 000 visitors per day to the site before declining as expected. NSF In anticipation of unprecedented public interest, NSF launched a special report page17 several weeks in advance of the EHT press conferences. This site featured stories about NSF black hole research, and, with EHT approval, teased the announcement by hosting a trailer for the Smithsonian Channel’s documentary Black Hole Hunters. On 10 April, the NSF page transformed to host the Washington, D.C. live stream and link to a media site with a wealth of custom visuals including an animation based on EHT modelling data, as well as interviews, B-roll, stills, backgrounders, and eventually even a downloadable poster. One of the new videos, an NSF montage featuring the EHT telescopes and data centres, aired during the core press conferences around the globe and served as B-roll for a number of broadcasts. In addition to distinguished guests, including Director Kelvin Droegemeierof
CAPjournal, No. 26, October 2019
of the White House Office of Science and Technology Policy, NSF invited a broad pool of EHT team members and experts to ensure journalists featured the broader EHT Collaboration in addition to the image. ESO
ESO played a major role in developing the story and a rich set of visuals that were published together with the press release on the ESO website18: a total of 20 images and 13 videos, which were shared with others throughout the collaboration. Though ESO is not a member of the EHT Collaboration, its contributions through ALMA and APEX were significant. A special ESO EHT landing page19 was set up and has so far had hundreds of thousands of views. A check soon after the publication on the press clippings service Meltwater found 487 stories for “ESO + black hole” plus an additional unknown number for “European Southern Observatory + black hole”, which leads us to believe
that between 13% and 20% of the articles worldwide mention ESO. Despite undergoing significant hardware and software upgrades in the months before the release, the ESO web servers were somewhat saturated for around 60 minutes from 15:00 to 16:00 CEST (13:00 to 14:00 UTC) on 10 April (especially for low-bandwidth connections). Over the first six days after the release, ESO accumulated 36 million hits on its web pages and 1.1 million views of the press release itself. It is estimated that the press release got at least seven times more visitors and traffic than the 2017 high-impact optical counterpart detection of gravitational waves (LIGO-Virgo) release20. Institut de Radioastronomie Millimétrique (IRAM)
IRAM, one of the thirteen EHT stakeholder institutes, reported similar outcomes. IRAM, a research institute in France, was mentioned in more than 400 online articles (mainly German and English-speaking) with about 182 million
potential readers. Additionally, Frenchspeaking media published about 400 articles (web, radio, TV, written press) mentioning “EHT” and “IRAM”. More than 100 written articles mentioning “IRAM” were published in Germany alone. Radboud University
Radboud University in the Netherlands, another stakeholder in the EHT Collaboration, was mentioned in more than 4000 online articles peaking on 10 April with 1600 online articles, and the press release was picked up by the NRC Handelsblad, de Volkskrant, RTL 4 and NOS. The news reached the largest audience via the Algemeen Dagblad in the Netherlands — 6.8 million potential readers. In collaboration with Radboud astronomer Jordy Davelaar, among others, a video was produced in which the black hole was simulated. This video has been viewed almost 100 000 times on several YouTube channels21. Chile
In Chile, the black hole image hit the front pages of the main media and with broad coverage on all the news shows broadcasted on open TV (TVN, MEGA, CHV, Canal 13). It is estimated from Meltwater (Search of “EHT + ALMA”) that at least 700 million theoretical readers received the news mentioning ALMA and the press clipping service LitoraPress calculated the ALMA coverage in Chilean media worth around USD $1.8 million in Advertising Equivalent Value. Japan
Figure 8. The image was the number one story headline on Google News on 10 April ( higher than any political news). Credit: Google News
Figure 9. The Google Trend for “black hole” in April 2019. Credit: Google Trends
In Japan, all the daily national newspapers and many local papers covered the EHT result next morning. The embargo lifted at 22:07 JST in Japan — a somewhat disadvantageous hour and too late for some newspapers to include the EHT results in their morning issue (especially for the editions distributed to the countryside regions, where the readership is higher than in urban areas). Even in this situation, ~300 articles were published (until 30 April 2019). The articles include plain news reports, interviews with Japanese researchers focusing on personal aspects, and editorial articles. Major Japanese TV news programmes and tabloid shows covered the EHT result and some programmes interviewed Mareki Honma, the leader of EHT-Japan team. Three TV stations fol-
An Unprecedented Global Communications Campaign for the Event Horizon Telescope First Black Hole Image
17
An Unprecedented Global Communications Campaign for the Event Horizon Telescope First Black Hole Image
lowed Honma’s work in the time from the observation campaign in April 2017 to the press conference two years later. Canada
In Canada, every national newspaper and television news broadcast covered the EHT Collaboration announcement. The country’s most prominent newspaper, The Globe and Mail, ran a long article and a video produced with EHT researcher Avery Broderick of Canada’s Perimeter Institute. Canadian Prime Minister Justin Trudeau tweeted congratulations to Broderick and the EHT Collaboration. The Perimeter Institute released four new videos about the EHT on the day of the announcement, and hosted a live webcast panel discussion on the same day. This video content garnered nearly one million views22. Taiwan
In Taiwan, all the national daily newspapers and TV news covered the EHT result on 10 and 11 April. The press conference was held at 21:00 CST in Taiwan, resulting in many journalists coming to interview the researchers over the following few days. There were more than 60 articles reporting the EHT news and Taiwanese contribution in April 2019. Four Taiwanese TV news programmes invited researchers to explain the EHT result.
Social Media Impact Social media campaigns were coordinated with the aim of stimulating people’s curiosity leading up to the event and inform them of the chance to follow any of the press conferences live, as well as to disseminate the image, the science results and the facilities which contributed to the science. As for the media impact, it is hard to evaluate the social media impact, but it was significant, possibly unprecedented, and made it to number one and number three on Twitter Trends (Figure 11).
Impact of Selected Social Media Campaigns NSF NSF proposed the idea of a “black hole blackout” to the EHT community to start three days before the event. All NSF social medial pages went dark, posting only an all-black image and redacted text that gradually unveiled a message detailing the date and time of a “major announcement” and ultimately where to watch it (Figure 12). This drove excitement and anticipation including an incorrect theory that NSF had hidden the black hole image in the post.
Figure 10. Figure 10. A few of the magazine covers. Courtesy of DER SPIEGEL 16/20019 32 and New Scientist
18
Within the first week, the NSF Twitter campaign earned 8.1 million impressions, 58 600 retweets, 120 700 likes, 63 900 clicks on NSF links, and Twitter included NSF tweets in the official Twitter Moment news feed. Throughout the day on 10 April, NSF posted about the announcement, while the Facebook Live stream from the press conference reached 1.9 million people. NSF’s tweet with the image23 accumulated more than 29 700 retweets and 53 400 likes within 12 hours, numbers which have almost doubled since then. Following the announcement, NSF gained 25 000 new Facebook followers and 40 000 new Instagram followers. ESO ESO started a teasing campaign on 7 April on Facebook, Twitter and Instagram, based on the initial idea from NSF and was adapted to our channels (Figure 13). A message and key visual were gradually revealed during the period of 8–10 April. The teasing campaign was very successful, with comments showing that people were very eager to see the image.
Figure 11. The #EHTBlackHole hashtag of the event was trending as number one while the Japanese word burakkuhooru (black hole) trended at number three on Twitter globally. Credit: Twitter
CAPjournal, No. 26, October 2019
Figure 14. Average reach per day on ESO’s Facebook and Twitter for the period 8–16 April was 1.6 million, with a big peak on 10 April. The peak of the social media interest is 3-4 times slimmer than the Google Trend peak. Note the effect of the teasing campaign before 10 April, left. Credit: ESO
On Twitter, ESO decided not to host a live stream, but did live tweets instead. It posted 40 tweets during the day, focusing on explaining the scientific results, the EHT network of telescopes, the role of European facilities, ESO’s contribution to the results through the ALMA and APEX telescopes, the technology used, etc. ESO’s Facebook and Twitter posts reached 10 779 709 people on 10 April and had an average reach during the period 8–16 April (Figure 14) of 1.6 million people per day (1.4 million higher than compared with the previous period). Similar to what happened to the JAOALMA Instagram followers, the ESO Instagram followers doubled from 28 038 to 55 545. The main post of the discovery reached 391 230 people and had 50 854 likes and 1059 comments. The impact on community growth was less significant on other channels (5% increase in Twitter followers and a 1% increase in Facebook friends). On ESO’s YouTube, the videos from the period 10–16 April had 1.05 million views. While ESO’s social media had the most impact in Europe, the message reached every populated continent as well (Figure 14).
ESO and collaborators also hosted a Reddit Ask Me Anything Science session 25 with scientists from the entire collaboration, which accumulated an impressive 1600 comments on the thread. EHT Collaboration
The Facebook page for the EHT Collaboration26 went from less than 5000 friends at the end of March to nearly 60 000 on the day of and immediately following the press conference. The top post on this Facebook account reached
some four million users, leading to 21 000 likes, 23 000 shares and about 1200 comments. Mirroring the reach of the ESO social media activity, the top tweet of the collaboration’s Twitter account (@ehtelescope), using the #EHTBlackHole hashtag, has generated 1.4 million impressions, with over 65 000 retweets and 130 000 likes. The number of impressions in March averaged about 3000 per day, then increased to 43 000 from 1–9 April, 7.9 million on 10 April, 2.9 million on
Figure 12. The NSF “black hole blackout” social media campaign. Credit Twitter/NSF
Figure 13. ESO’s five teaser posts, including the result post, on ESO’s Instagram account 24. Credit Instagram/ESO
An Unprecedented Global Communications Campaign for the Event Horizon Telescope First Black Hole Image
19
An Unprecedented Global Communications Campaign for the Event Horizon Telescope First Black Hole Image
people seemed to be as excited about the results as the scientific community, and engaged in co-creation, sharing heavily on social media. This popularity was enhanced by the simplicity of the image and its easy identification with a black hole, combined with the public’s fascination with these objects. Leaning into the “meme-ification” of the black hole image, NSF asked the public to share their favourite meme with #BlackHoleLooksLike through a popular blog post titled The best jokes about the first image of a black hole, which was posted on 12 April. A few of the hundreds of examples of “exploitables” or “memes” are shown here (Figure 15).
Side Stories Apart from memes, the viral dissemination of the black hole results led to several individual strands of storylines or “side-stories” that took on a significant life of their own. Examples include the following. ‘Pôwehi
Figure 15. Social media memes from 10 and 11 April 2019. Courtesy of the individual users
11 April, about 250 000 from 12–18 April and 84 000 from 18–25 April. The number of followers was about 4500 at the time of the media advisory, about 6500 just before the announcement and about 61 000 on 11 April. The European Commission
The EC’s social media campaign used the full potential of the EC’s Twitter, Facebook and Instagram accounts. The Commission’s social media team shared related posts on all its accounts. The actions were among the most successful content an EU-institution has ever published: • Twitter: Five tweets with a total of 2.7 million impressions and 240 000 engagements. The tweet of the image 27 was the most successful ever published by the EC.
20
• Instagram: More than 21 000 engagements and with a reach to 139 757 people. The EC’s #RealBlackHole Instagram post was the most successful content of an EU social media Instagram account ever both in terms of engagement and in terms of reach.
The first astronomy press release translated into the Hawaiian language and M87* was bestowed the name ‘Pôwehi ( “embellished, fathomless dark creation”) by Dr. Larry Kimura, an associate professor of Hawaiian Language and Hawaiian Studies at the University of Hawai’i, Hilo 28 . In Hawaii, the success of this locally directed press releases was demonstrated when the state governor proclaimed 10 April as ‘Pôwehi Day in Hawaii. Stock Photo Firestorm in China
• Facebook: The post with the image reached 1.5 million users Memes In addition to the impact seen on social media by prepared campaigns, another remarkable aspect of this result was the amount of memes and popular culture references that were shared on social media, demonstrating that the image not only had reached people far wider than seen for other results before, but also that
In China, the stock image provider Visual China Group (VCG) set off a debate over copyright practices in China and beyond after claiming exclusive rights to the black hole photo. Shares for VCG (with around 500 MEUR in assets) plunged 27% on 12 April and had not recovered several months later. Internet regulators in Tianjin temporarily shut down the VCG website, calling for the company to end “illegal, rule-breaking practices”. VCG issued a public apology and the website remained closed for several weeks29.
CAPjournal, No. 26, October 2019
Katie Bouman
A viral story about EHT scientist Katie Bouman overtook social media following a tweet from MIT’s Computer Science and Artificial Intelligence Laboratory (@MIT_CSAIL) at 9:10 EDT on 10 April. This tweet was followed by further tweets from prominent STEM Twitter users that included a photo from Bouman’s Facebook page showing her reaction to a pre-announcement EHT image on her computer or a comparison to Apollo 11 software engineer Margaret Hamilton. Bouman and other EHT researchers defended her after the emergence of sexist tweets caught her in a social media firestorm, necessitating issue management support to Bouman from the Smithsonian Astrophysical Observatory and HeadFort Consulting. This viral story was perhaps fed by a lack of appreciation for the size and complexity of the EHT collaboration as well as the knowledge that women’s contributions to science have often been neglected. Brexit Respite
British journalists and artisans found respite in the positive, benign, and, most importantly, peaceful international collaboration in the midst of deteriorating Brexit talks in Britain and Brussels, leading to humorous articles, tweets, and political comics in the media and online. Japanese Products
Online in Japan, Kellogg’s and a Japanese candy company30 used the science results in promotional tweets on Twitter, a dominating social media platform in Japan 31. A company that creates virtual Youtube avatars, or VTubers, distributed a design file of an “eye” inspired by the EHT image. Japanese Photo-Op Stand
Also in Japan, a tweet of a “photo-op stand” of the EHT image installed at the NAOJ Mizusawa VLBI Observatory led to a viral story in Japan and coverage from several newspapers. As a result, the observatory received nearly four times more visitors during the holiday season in early May compared to the year before.
Other Results The EHT image was honoured with its own Google Doodle (Figure 22), was on
Wikipedia’s front page (Figure 23) and was even featured in two xkcd comic strips (Figure 24).
Conclusions and Lessons Learned Although it is hard to draw very solid conclusions from this complex campaign with its multitude of outcomes, some takeaways are nonetheless clear. • The success of this campaign was made by a combination of an amazing result, a captivating and dramatic story build-up, an appealing main visual (the image) and a significant investment in excellent, accurate graphic design. • Content is king. Naturally, the quality of the communication products, the teasing campaigns and the collective might of the dozens of “endorsing” world-leading organisations were important. But had the result and story behind it been weak, the impact would likely have been much lower. • For a big collaboration with many involved organisations, it is natural and unavoidable to allow all participating organisations to issue their own press releases. Having a common core allowed us, in this case, to have the best of both worlds: to fully align our science messages and still allow for “localised” organisational content. • Not unexpectedly, viral content generates unpredictable side stories that take on lives of their own and can help the visibility of the main storyline. A plan should be implemented for monitoring and responding to social media coverage of significant results, especially concerning scientists with large numbers of followers or enhanced name recognition. • A common strategy with regard to embargo policy and how to deal with media requests must be defined and strictly followed by all partners. A detailed justification for this strategy should be provided — both for collaboration members and the media
— including preventing accidental leaks and avoiding favouring of individual media outlets. • Sharing material under the Creative Commons Attribution 4.0 License allows for the maximum wider reach with minimum effort (no need to approve usage requests). At the same time, attention has to be paid to third parties who take the visuals and re-use them without due credit (or by changing license). • The different cultures of the communicators and scientists in the campaign meant that important official factsheets about the project’s history as well as technical and scientific background were prepared, but not approved and published, preventing a more complete communication effort. • Teasing on social media works well to generate attention, but it has to be balanced to not become too much. • For complex storylines, it helps to have a team of (younger) scientists ready to answer questions in real-time on social media, and are available to give interviews and extra provide information in the following days. An exciting result will generate a lot of questions and engagement. • When video streaming, a script for the camera people that clearly indicates where the focus should go is important. Within the camera field of view, the speakers should be combined with inset frames of the sides and the audience. • When doing Facebook Live, it is worthwhile to research how to do Facebook cross-posting and to look into Twitter’s Media Studio to make the content is easily available to partners. • Social media ideas, tools, hashtags and messaging is best discussed well in advance. It is important to have some hashtags highlighting some of the individuals involved in the project (also to highlight diversity) and could have been done better in this case.
An Unprecedented Global Communications Campaign for the Event Horizon Telescope First Black Hole Image
21
An Unprecedented Global Communications Campaign for the Event Horizon Telescope First Black Hole Image
• It is very important to provide timely and effective media training to the scientists presenting at a press conference. Often, scientists prepare slides that are more appropriate for the scientific community and not a general audience. • Due to the magnitude of the story, there were organisations involved in parts of the result who were not among the large group of communicators. Due to strict confidentiality, the conundrum of how to involve them and how much risk to assume was never resolved in a satisfactory way. Only a true team effort can lead to a success as big as this. The value of international collaborations in science communication cannot be stressed enough for their benefits, especially for generating reach in the millions or even billions of readers.
Acknowledgements The authors would like to acknowledge all the scientists, organisations, observatories and funding organisations who collectively made this historic result possible. We would like to thank Josh Chamot (NSF), Peter Kurczynski (NSF), and Denise Zannino (NSF) for their insights and assistance. A big thank-you also goes to the many scientists who were involved with the communication work and without whom this effort would not have been so successful: Luciano Rezzolla, Chi-kwan Chan, Hung-Yi Pu and several others.
Notes Ethan Siegel’s article “10 Deep Lessons from Our First Image Of A Black Hole’s Event Horizon: https://www.forbes.com/sites/ startswithabang/2019/04/11/10-deep-lessonsfrom-our-first-image-of-a-black-holes-eventhorizon/#be8191e55e64
1
2 This included one held at the Danish National Space Center in Denmark. Denmark, a new member of the EHT, which will be involved in future EHT observations through the Greenland Telescope. 3 Zoom video produced by ESO: https://www. eso.org/public/videos/eso1907c/ 4
Teamwork: https://www.teamwork.com/
5 Japanese comic produced by NAOJ: https://www.nao.ac.jp/en/news/sp/20190410eht/images/eht-comic-en-20190410.pdf 6 EC Youtube live stream of the press conference: https://youtu.be/Dr20f19czeE
EUtube: https://www.youtube.com/user/ eutube 7
Live stream on Le Monde: https://www.lemonde.fr/sciences/live/2019/04/10/en-directsuivez-la-diffusion-de-la-premiere-image-dun-trou-noir_5448356_1650684.html 8
JAO-ALMA observatory website: www.almaobservatory.org 9
20 ESO 2017 LIGO-Virgo press release: https:// www.eso.org/public/news/eso1733/ 21 Videos include the following: https://youtu. be/8S-DF6WZob8, https://www.youtube.com/ watch?v=3NeIVjfuKQY, https://www.youtube. com/watch?v=0LsiYlH-bmI and more. 22 Perimeter Institute’s video playlist: https:// www.youtube.com/playlist?list=PLaLvSxPpI1c2NsXZuwah9Ns7DqdAw2mBm 23 NSF’s final “black hole blackout” tweet: https://twitter.com/NSF/status/1115964620186030080
ESO’s Instagram: https://www.instagram. com/esoastronomy/?hl=en 24
25 Black hole Ask Me Anything on Reddit: https://www.reddit.com/r/askscience/comments/bbknik/askscience_ama_series_we_ are_scientists_here_to/ 26 EHT Facebook page: https://www.facebook. com/ehtelescope/
10
27 EC tweet of the black hole image: https:// twitter.com/EU_Commission/status/1115964395782197248
NAOJ niconico live stream of the press conference: https://live.nicovideo.jp/gate/ lv319442680
28 The release was directed by the East Asian Observatory which operates JCMT on Maunakea in collaboration with staff at ‘Imiloa and Dr. Kimura.
NAOJ Youtube live stream of the press conference: https://youtu.be/_QBQMT5vrJo 11
12 NAOJ press release: https://www.nao.ac.jp/ news/science/2019/20190410-eht.html
Video of the press conference of the Chief Cabinet Secretary of Japan: https://www.kantei.go.jp/jp/tyoukanpress/201904/11_a.html 13
14 NSF Youtube live stream of the press conference: https://www.youtube.com/watch?v=lnJi0Jy692w
With some conviction, the authors believe that the readership is on the order of billions. A sanity-check of this number: the number of people living in absolute poverty dropped from ~1.9 billion in 1990 to 734 million in 2015 (https://en.wikipedia.org/wiki/Extreme_poverty). The literacy rate changed from 73% in 1990 to 87% in the present (~6.7 billion people who can read and write out of 7.7 billion, https://ourworldindata.org/literacy), and 56% of the world population now has access to the internet (~4.4 billion, https://www.internetworldstats.com/stats.htm). In summary, an estimate of a few billion may be right, considering the huge impact of the news in large and populated regions such as China, Latin America, as well as Europe and North America, with a very high coverage rate. 15
29 Although it is technically not against the Creative Commons Attribution licensing to distribute an image at a cost, stock photo agencies are not allowed to change the credit (as sometimes is seen) and are required to ensure that the Creative Commons message is distributed with the image as well. 30 Japanese pineapple candy tweet: https:// twitter.com/pain_ame/status/1115977781341380608 31 eMarketer article “Japan Is One of the World’s Strongest Markets for Twitter”: https:// www.emarketer.com/content/japan-is-one-ofthe-strongest-markets-in-the-world-for-twitter 32 Der Spiegel cover: https://www.spiegel.de/ spiegel/print/index-2019-16.html
16 EHT website: http://eventhorizontelescope. org 17 NSF black holes webpage: www.nsf.gov/ blackholes 18 ESO press release: https://www.eso.org/ public/news/eso1907/ 19 ESO EHT webpage: https://www.eso.org/ public/science/event-horizon/
22
CAPjournal, No. 26, October 2019
Biographies Lars Lindberg Christensen is an award-winning astronomer, science communicator and manager. He is responsible for the communication for some of the world’s most famous telescopes such as ESA’s part of the Hubble Space Telescope and ESO’s Extremely Large Telescope. He has authored a dozen popular science books translated into more than ten languages. Mislav Baloković is a postdoctoral research fellow at the Center for Astrophysics | Harvard & Smithsonian, studying active galactic nuclei. He led and contributed to many small-scale public outreach projects, and currently co-coordinates outreach efforts of the Event Horizon Telescope Collaboration. Mei-Yin Chou is the Education and Public Outreach (EPO) Project Scientist in Academia Sinica Institute of Astronomy and Astrophysics (ASIAA), Taiwan. Suanna Selby Crowley, PhD, RPA, is a research scientist with an expertise in communications, digital media, fundraising, and applied anthropology. She has worked across the globe on projects that involve technology, the environment, and the role of women in science, and now leads HeadFort Consulting, LLC, based near Boston, MA. Peter Edmonds has worked as the Chandra Press Scientist since 2003. Valeria Foncea, a journalist and Master in Strategic Communication, is the EPO Officer of the ALMA Radio Telescope. She has an extensive television career doing reports on environmental, scientific and technological issues for the Chilean TV. In institutional communications, she has served at the UNDP and ESO-Chile. Masaaki Hiramatsu is the East Asian ALMA Education and Public Outreach Officer and an assistant professor at NAOJ. He obtained a PhD in radio astronomy, then worked as an ALMA postdoc in Taiwan before starting his current post in 2011, just before the start of ALMA science observations.
C olin H un te r i s t he D ire c tor of Communications and Media at Perimeter Institute for Theoretical Physics in Waterloo, Ontario, Canada. The not-for-profit institute is the world’s largest independent centre for theoretical physics research, training, and educational outreach. Katharina Königstein has worked at Radboud University as Communication Specialist and Management Support and coordinated European science outreach efforts in her role as a program manager together with the other leading institutes. She has now taken this experience back to the industry and pursues her career in the IT-Service Management sector.
Harriet Parsons is a Support Astronomer at the JCMT observatory operated by the East Asian Observatory. She obtained her PhD in Astrophysics at the University of Hertfordshire in 2011. Alongside her duties as a Support Astronomer and Head of Operations, she manages the expanding outreach efforts at the JCMT. Eduardo Ros is a scientist at the MPI für Radioastronomie in Bonn, Germany, and professor for Astrophysics (on leave) at the University of Valencia, Spain. Event Horizon Telescope Board Executive Secretary and coordinator of its Observing Proposals and the Outreach Working Groups; also member of collaborations such as MOJAVE, TANAMI or Fermi/LAT.
Sarah Leach is a science editor based in Leiden, the Netherlands. She has worked on astronomy communication, outreach, and education for many organisations and institutions, including the European Southern Observatory, Imperial College London, the California Academy of Sciences and the Chabot Space and Science Center.
Oana Sandu is a communication expert for science and technology with more than 11 years of experience. Among the brands she works for is the European Southern Observatory, where she handles community coordination (promotion, distribution and social media) and communication strategy.
Nicolás Lira is a Chilean journalist with previous studies in Physics in the Denis Diderot University in Paris, France. Currently, Nicolas is studying a Master Degree of Innovation at the Catholic University in Santiago, Chile. He has been working in outreach at ALMA since 2013.
Calum Turner is an astrophysics graduate and science communicator with a growing experience of sharing astronomy with the public and, until recently, he worked as the Public Information Officer at ESO. He is currently spending his time studying spacecraft engineering.
Mariya Lyubenova is a faculty astronomer at ESO and head of the Media Relations Team at the Department of Communication. Before that Mariya worked as a researcher at the Max Planck Institute for Astronomy in Heidelberg, Germany and the Kapteyn Astronomical Institute of the University of Groningen, the Netherlands.
Megan Watzke is the public affairs officer for the Chandra X-ray Observatory, a position she has held since 2000. Her responsibilities include the dissemination of Chandra’s science results to the public through press releases, press conferences, informal education and other activities.
Satoki Matsushita received his PhD from the Graduate University of Advanced Studies in Japan, then spent postdoc periods at the Center for Astrophysics | Harvard & Smithsonian and the Academia Sinica, Institute of Astronomy and Astrophysics (ASIAA) working on starbursts and active galactic nuclei using submillimeter interferometers, and is now a Research Fellow at ASIAA.
Karin Zacher is a science and astronomy communicator. At IRAM, one of the world’s leading institutes for radio astronomy, she is responsible for the communication of the most powerful radio telescopes in the Northern Hemisphere: the NOEMA Observatory and the IRAM 30-meter Telescope.
An Unprecedented Global Communications Campaign for the Event Horizon Telescope First Black Hole Image
23
Research and Applications
Touch the Universe: Developing and Disseminating Tactile Telescope Models Created with a 3D Printer Kumiko Usuda-Sato
Hideaki Fujiwara
Keywords
National Astronomical Observatory of Japan kumiko.usuda@nao.ac.jp
National Astronomical Observatory of Japan hideaki@naoj.org
3D modelling, communicating telescope technologies, dissemination of resources to BVI communities
Hirotaka Nakayama
Tomonori Usuda
National Astronomical Observatory of Japan hirotaka.nakayama@nao.ac.jp
National Astronomical Observatory of Japan usuda@naoj.org
We initiated a project to develop tactile models of telescopes from the National Astronomical Observatory of Japan (NAOJ) to explain cutting-edge technologies of the telescopes and how they work. The goal was to develop models that could be understandable for blind and visually impaired (BVI) and sighted people and to make the data for these models freely available in a format compatible with commercially available 3D printers. As a first step, we created a 1/110th scale model of the Subaru Telescope, NAOJ’s large optical-infrared telescope on Maunakea, Hawai‘i. Based on comments from people who are BVI and a science teacher of special needs, we created two types of model: A detailed model for sighted people and people who are BVI who have excellent haptic observing (touch interaction) skills and a simplified model for students at special needs schools for the visually impaired who are learning how to touch samples and need tactile models in science classes. With these models and other tactile models of celestial bodies, the special exhibit Touch the Universe was held at the tactile museum of the Japan Braille Library. Introduction: Why Tactile Telescope Models Astronomy is a gateway science which arouses the curiosity of people regardless of age, nationality, ethnicity, or disability. Nobody should be left behind to enjoy and experience the wonders of the Universe. However, many people with disabilities do not have enough opportunities to “touch” the Universe probably due to a lack of resources (e.g., Mineshige et al., 2009). In order to improve such situations, astronomers and astronomy communicators have developed various resources to reach more diverse people such as people who are blind or visually impaired (BVI) over the last decade. For example, an astronomy book in braille and a planetarium show with a tactile hemisphere were developed in Spain (Ortiz-Gil et al., 2011), a braille astronomy textbook has been published in the United States1, and a tactile and braille exhibit of astronomy images were also presented in the United States (Arcand et al., 2010). In Japan, Dr Shin Mineshige and Mr Jun Takahashi have published multimodal astronomy textbooks (Mineshige et al., 2009) for three different levels: undergraduate students in science courses, secondary school students, and chil-
24
dren who are elementary school-aged or younger. These books were published in multiple media: a print version, a printed version in braille, an audio version, and a PC version for people to read with larger letters and with bright white letters on a black background. The braille versions included many tactile images of celestial bodies developed by the authors with people who are BVI. At NAOJ headquarters in Mitaka, Tokyo, the visitors’ area is open daily except for the New Year’s holidays. At the headquarters, visitors can enjoy exploring historical telescopes, the Solar System Walk (a to-scale model of the Solar System), and an exhibition room introducing current NAOJ projects. A printed guidebook of the Mitaka campus is written in Japanese braille and large gothic font, in addition to Japanese, English, Chinese, Korean, and Spanish, so visitors can select their preferred version (UsudaSato et al., 2018). With a smartphone or a tablet, an audio guide in English and Japanese and a Japanese sign language movie can also be accessed at each facility through scanning a two-dimensional barcode (QR code) linked to an audio guide website2. In the 2010s, the three-dimensional (3D) modelling and printing technology has
become cheaper and more accessible in science communication and education (e.g., Arcand et al., 2017). In astronomy, the A Touch of the Universe project 3 (e.g., Pérez-Montero 2019) in Spain and other countries developed a tactile sphere of the Moon and the rocky planets. The Tactile Universe project4 (Bonne et al., 2018) in the United Kingdom created 3D-printed tactile images of galaxies. NASA’s Chandra X-ray Center (CXC)5 developed the 3D models of supernova remnants such as Cassiopeia A and other objects (Arcand et al., 2017, Arcand et al., 2019). On the official website of these projects, printable 3D files (STL and sometimes OBJ files) can be downloaded. The printable 3D and other tactile resources are being developed in many countries, and NASA opened a repository website 6 of a collection of printable 3D models. The International Astronomical Union (IAU)’s Working Group on Astronomy for Equity and Inclusion7 also has various resources and activities on its website. In the new IAU Strategic Plan 2020-2030 8, IAU sets one of the five goals (Goal 2) to promote the inclusive advancement of the field of astronomy in every country, and astronomy activities are expected to become more inclusive in the next decade.
CAPjournal, No. 26, October 2019
Although many tactile 3D models of celestial bodies and astronomical data have been developed and disseminated in the world, few telescope models have been introduced. A telescope is an essential tool for studying the Universe and for understanding how a cutting-edge telescope works. It is a fundamental component of astronomical observations. In the visitors’ area of NAOJ headquarters, many old, retired telescopes and some telescope models of the current projects can be seen. However, the old existing telescopes are too large for people who are BVI to understand the whole telescope with their arms and fingers, and the new telescope models are inside glass cases and, thus, not accessible. For these reasons, it is challenging to answer simple questions from people who are BVI such as “How does the telescope enclosure open?” and “How does the telescope move?”, so we initiated a project to create 3D tactile models of telescope, starting with a model of the Subaru Telescope. Just like the 3D models of celestial bodies, the telescope models are helpful not only for people who are BVI but also for people who are sighted to better understand the telescope. Subaru Telescope Models: What Is a Good Model? The Subaru Telescope is a Japanese optical-infrared telescope constructed near the summit of Maunakea on the Big Island of Hawai‘i. It is operated by
Figure 1. The detailed version (left) and the simplified version (right) of the 3D models of the Subaru Telescope. Credit: NAOJ
NAOJ and started observations in 1999. The diametre of its primary mirror is 8.2 metres, making it one of the largest monolithic mirrors in the world. To develop a tactile 3D model of the Subaru Telescope we listed its distinguishing features to be communicated with the public: (1) it is one of the largest monolithic mirrors in the world, (2) with a wide field-of-view, prime focus camera mounted at the top of the telescope, and (3) has various observing instruments mounted at four foci. We also wanted to show (4) a telescope without a telescope tube structure and (5) the motion of the telescope as a giant optical-infrared telescope. The 3D model was designed by Hirotaka Nakayama using Autodesk Maya, a commercial 3D computer graphics application. Nakayama based the model off information on the entire form and size of the Subaru Telescope collected from the
official website9. He then finalized its specific individual parts with photos of the telescope he took inside of the enclosure on Maunakea. For the initial 3D model with detailed features, we consulted the following three people: Mr Naoto Shibata, Dr Kojiro Hirose and Mr Sadao Hasegawa. Shibata, a science teacher at the Special Needs Education School for the Visually Impaired, University of Tsukuba, Japan checked the prototype model and requested we make it simpler. In science classes, students who are BVI learn how to observe samples and models using their haptic sense. They may not understand the essential features from a highly detailed model. On the other hand, Hirose, a blind researcher at the National Museum of Ethnology in Japan with excellent haptic observ-
Figure 2. The parts of the movable section (left) and the base section (right) of the detailed model. In the movable section the secondary mirror (subaru_teleMove_E.stl) can be exchanged with the Hyper Suprime-Cam or HSC (subaru_teleMove_E_HSC.stl), which is an extremely wide field-of-view camera mounted on the prime focus. In the base section the “C”, “D”, and “E” parts have a left (“l”) and right (“r”) version, both of which are needed to construct the telescope. Credit: Hirotaka Nakayama/NAOJ
Touch the Universe: Developing and Disseminating Tacticle Telescope Models Created with a 3D Printer
25
Touch the Universe: Developing and Disseminating Tacticle Telescope Models Created with a 3D Printer
ing skills enjoyed touching it and told us not to simplify the model. Therefore, we decided to develop both simplified and detailed models (Figure 1)10. Hasegawa, another blind person, asked us many questions about the Subaru Telescope when he was touching the model. He said that he had a great time getting to learn about the telescope, and this conversation showed us the importance of having detailed explanations of the model. Each model consists of the movable and base sections, and each section is divided into as many as ten parts. All
parts are designed for sizes that can be easily printed using a 3D printer without any support materials, and all STL files can be downloaded from the official NAOJ 3D-models website11. After assembling the two sections individually, they are bolted together. The rough dimensions of the approximately 1/110th scale models are 27-cm width × 17-cm depth × 25-cm height, and the diametre of the primary mirror is 7.4 cm, which is large enough for everyone to touch with one’s fingers and to recognize the concave shape (the curvature of the mirror is notto-scale and exaggerated on the model).
Figure 3. Mr Naoto Shibata (farthest left) explains the structure of an amateur refractor telescope as three students try to understand it by touching the telescope. Credit: Lina Canas/IAU Office for Astronomy Outreach
Figure 4. Two tactile diagrams displayed with EDEL software show how parallel light from outer space is collected with three flat mirrors (left) and with a concave mirror (right). The flat and concave mirrors at the bottom of the diagrams were designed with larger dots, and the light rays were designed with smaller dots. Credit: Naoto Shibata
26
The model can be printed smaller, but thiswill lessen a user’s ability to touch certain details of the telescope, like the mirror. The models used ABS (acrylonitrile butadiene styrene) thermoplastic as the printing material. PLA (polylactic acid) is another popular thermoplastic material for 3D printing. Compared with ABS, PLA is easier to handle, especially when printing a flat surface as PLA is less sensitive to temperature and does not warp like ABS. On the other hand, ABS is stronger when printed at a sufficient temperature (210-250˚C) and can bounce back when dropped whereas PLA can chip or break. For the Subaru Telescope models, the parts need to be assembled, and the two sections need to be bolted. To avoid breaking any parts, ABS is a better material. In general, people who are BVI are curious about textures, and they ask questions about smoothness and roughness. The smoothness of the primary mirror, the heart of the Subaru Telescope, is one of the essential features that needs to be explained. However, it is challenging to make a smooth curve with a 3D printer and ABS materials because concentric rings are printed to make the primary mirror. Therefore, we decided to use a different material for the primary mirror. A 7.4-cm diametre “mirror” was cut out with a compass cutter from a 20-cm diametre transparent vinyl-chloride halfsphere and pasted on the subaru_teleMove_C part in Figure 2 using an ABS adhesive bond before assembling the movable section. The curvature of the subaru_teleMove_C part is designed to fit the curvature of a 20-cm half-sphere. The smooth mirror is easy to find for people who are BVI with their fingers. For sighted people, the mirror part looks shiny like a real mirror. For both models, STL files and a manual can be downloaded from the official NAOJ 3D-models website. The detailed instructions are explained on the website. The website also has a page explaining key points of the structure of the Subaru Telescope to be used by teachers and educators in conjunction with the 3D models.
CAPjournal, No. 26, October 2019
of the Subaru Telescope, which means that a tactile model can be a catalyst for communicating astronomy and technology, and that related stories and facts can enrich students’ understanding of the model.
Figure 5. Students observe Subaru Telescope models. Two students with total blindness (on the left) observed the model individually while two students with low vision (on the right) shared one model. Credit: Lina Canas/ IAU Office for Astronomy Outreach
Communicating With People With BVI: Additional Tactile Images The first presentation of the models was made in Shibata’s science class. The Grade 11 class consisted of three students with total blindness and four students with low vision. In the first half of the 90-minute class, each student learned about the structure of a refractor telescope (convex lens, telescope tube, and mount) by touching a real amateur refractor telescope (Figure 3). Using a light probe, a simple device which converts light into sound, Shibata explained that the light collected with the objective lens goes through the telescope tube to the eyepiece. Some low-vision students looked through the eyepiece and saw the light. In the second half of the class, Dr Kumiko Usuda-Sato explained the difference between a refractor and a reflector telescope, and then introduced the Subaru Telescope. Linking to light reflection, which is included in the school curriculum guidelines (Science Standard of Japan), she explained using two tactile diagrams how telescopes utilize reflection (Figure 4). The first diagram explained the concept of collecting parallel light rays from outer space with three flat mirrors, and this concept was extended to a concave mirror in the second diagram.
These diagrams were designed with EDEL12 software for drawing tactile diagrams and then printed on white paper with a braille printer. EDEL was developed at Tsukuba University of Technology in Japan and can be downloaded for free onto a Windows computer. Diagrams made with EDEL can be converted into image data such as a jpeg file. When the seven students observed the 3D Subaru Telescope model, five simple models were provided (Figure 5) as Shibata requested: one model for each fully-blind student and one for two low-vision students. Using their haptic sense, students needed enough time to observe the model and understand its structure and motion. After the presentation, the students sent thank you letters, writing, “I had never studied the detailed structure of a telescope before. After this class, I could understand how a telescope works”, “I have touched a real telescope (refractor) for the first time, and could feel its size and the weight of the lens”, “By touching the models, I could understand the telescope better than by just listening to the lecture. Thanks to the model, I can imagine the telescope in my mind.” Many students also mentioned the cutting-edge technologies and accuracy
Usuda-Sato also gave presentations to other BVI groups in Tokyo. Compared to the classroom, a bigger group was more challenging. Enough time was needed to touch the model by each BVI person, but, on the other hand, six models were the maximum number that could fit in a large suitcase to bring them to the location. Therefore, each model was used by a group of up to five people of both BVI and sighted ability, and limited the maximum number of participants to 30 in total. During the presentation, sighted people were asked to repeat information to BVI people what Usuda-Sato and other presenters explained. It was different from a classroom as there was no teacher, so asking sighted attendees to be interpreters helped enhance the understanding of BVI participants. Additionally, at these meetings, two tactile diagrams of the cross-section of simple refractor and reflector set-ups, along with the Subaru Telescope (Figure 6) were shown. Attendees learned about the structure of the telescope with the images and then enriched their understanding by touching the 3D models. The tactile diagrams were made with the PIAF Tactile Image Maker13 manufactured by Hapro. Hapro is a Polish company with a global reach, and PIAF products can be purchased in many countries, including Japan. Each diagram was copied onto heat-sensitive capsule paper and heated with the PIAF Tactile Image Maker, which made the black lines and areas swell up. Some of the attendees had BVI networks. An editor of a BVI journal asked us to write an article about developing the tactile models, and another attendee introduced us to the director of the Japan Braille Library (JBL). The presentations were resulted in the special exhibition at JBL reported in the next section. Special exhibit at Japan Braille Library The Japanese Braille Library (JBL) opened Tactus Museo14, a tactile museum on the second floor of its annex build-
Touch the Universe: Developing and Disseminating Tacticle Telescope Models Created with a 3D Printer
27
Touch the Universe: Developing and Disseminating Tacticle Telescope Models Created with a 3D Printer
Figure 6. On the left, the tactile diagram of the Subaru Telescpe comes out of the PIAF Tactile IMage Maker. On the right are two diagrams printed on heat sensitive capsule papers. A free Japanese braille font created and distributed by Japan Lighthouse, a social welfare corporation15, was used to note parts of the telescope. On these images English translation is shown. Credit: NAOJ
ing, in 2018. The museum is open three days a week to everyone for free, and each visitor signs up at the entrance and then receives antibacterial wipes to be ready to touch the exhibits. The special exhibit Touch the Universe was held from 17 August 2018 to 22 December 2018, and it was co-hosted by the Educational Materials Library Seen with Hands and Eyes in collaboration with NAOJ. The Educational Materials Library provided tactile models of rockets and spacecraft, and NAOJ provided models of telescopes and celestial bodies with supervision from Usuda-Sato on the content. The layout of the museum is shown in Figure 7. The exhibit consisted of four sections: (1) going into outer space, (2) studying outer space, (3) a scale model of the Solar System by distance, and (4) a scale model of the Solar System by size. At the elevator exit area, an existing tactile Moon created for the A Touch of the Universe project 3 was displayed. In Section 1 with the rockets and spacecraft models, a tactile model of asteroid Itokawa was displayed, printed from STL files downloaded from the NASA 3D Resources website 6. A blind visitor shouted, “It is not spherical!” when he touched the Itokawa model. This episode shows that most information on celestial bodies is only sent to the public through images, and even a simple tactile model helps people with BVI understand celestial objects more precisely. Later on during the exhibit run, a tactile model of the asteroid Ryugu was added, which was created with the latest data taken with the Japanese spacecraft Hayabusa2 (Watanabe et al. 2019). At that time,
28
the data had not been published or released to the public16, and Dr Hiroshi Arai, an NAOJ researcher working with Hayabusa2, created the 3D model. The addition of the Ryugu model was immediately announced on the official site of Tactus Museo, and some visitors to the museum said, “I read the website and came to touch the Ryugu model.” On the first display panel of Section 2, people learned that it is challenging to send spacecraft outside of the Solar
System and that telescopes are an essential tool for studying the Universe. With this panel, people recognized the gap in the distance between Section 1 (where a probe can be sent) and Section 2 (beyond the reach of a probe). A simple model of Galileo’s rudimentary refractor telescope and an amateur reflector telescope were displayed with the Subaru Telescope tactile models. A human figure was added as a scale indicator so that people realised the actual size of the telescope by touching it (Figure 8).
Figure 7. The layout of Tactus Museo. In front of the elevator exit (image 1), the tactile globe and the Moon model were displayed. At the entrance with the title of the exhibition (2), a braille block was on the floor. After people signed up at the reception, they started touching the exhibit in the following order: Section 1. “Going to the outer space” (Image 3), Section 2. “Studying outer space” (Image 4), Section 3. “A Scale Model of the Solar System I. Distance” (Image 5), and Section 4. “A Scale Model of the Solar System II. Size” (Image 6). Credit: Kumiko Usuda-Sato/NAOJ
CAPjournal, No. 26, October 2019
Figure 8. The Subaru Telescope model (detailed version) with a human figure centered at the bottom of the model. A tactile map of Hawai‘i islands created by Tactus Museo was displayed. On the map a transparent braille label was overlaid onto each printed label. Credit: Kumiko Usuda-Sato/NAOJ
Additional tactile materials were added to enhance visitors’ understanding. In addition to the tactile diagrams shown in Figure 6, a 3D diagram of a reflector was displayed, which was created by the Educational Materials Library (Figure 9). An old amateur reflector was also displayed for people who are BVI to touch it. In Section 3, a one-trillionth scale model of the Solar System was displayed on the wall. This scale was chosen to fit the length between the Sun and Neptune in the nine-metre-long exhibition room. In Section 4, we used the 1.4-billionth scale planet balls in the “Universe in a Box” educational kit distributed by Leiden University in the Netherlands for the EU Universe Awareness project17. The Mercury, Venus, Earth, Mars, Uranus, and Neptune balls were individually put in a transparent plastic bag, and a braille label was placed on the bag. The existing educational materials evolved into tactile ones with the braille labels. During the 54 open days of the Touch the Universe special exhibition, a total of 545 people visited, which is on average about 10 people per day. About half of the visitors were sighted people not accompanying BVI persons. Irrespective of visual impairment, a tactile museum with haptic experiences captures attention. An editor of another BVI journal was one of these visitors. He directly contacted Usuda-Sato and she wrote a series of articles based on the contents of the exhibition. Planetarians outside of Tokyo also visited the Tactus Museo, and they are now planning to hold a similar exhibition with the same tactile materi-
Figure 8. The tactile 3D model of a reflector. The primary and secondary mirrors and the eyepiece were shown, and a light path in the telescope tube is shown with a string. Credit: Kumiko Usuda-Sato/NAOJ
als. The exhibition was also exported to National Astronomical Research Institute of Thailand (NARIT) in collaboration with IAU Office for Astronomy Outreach (OAO) located at NAOJ, to hold Inspiring Stars18, an inclusive exhibition which commemorates the 100th anniversary of IAU, in Thailand. Discussion: Tips Collaboration with people who are BVI and an expert of special needs education is essential to developing a tactile model that is understandable through the haptic sense. A good relationship with BVI
communities would also be helpful when developing and disseminating the model. A good, understandable model depends on their haptic observing skills, so two types of the Subaru Telescope models of different levels of detail were developed. Related stories or technological facts are also necessary to engage people in the 3D model. In the case of the Subaru Telescope, people were impressed by stories such as why the telescope was built outside of Japan, the surface accuracy of the primary mirror, the cutting-edge technologies used to achieve excellent tracking accuracy, and a giant epoch-making digital camera.
Box 1: Tips for Developing a Tactile Model
1. Modelling • Feedback from visually-impaired and related people is essential. • A good model can be made to different levels of detail for students versus people with excellent haptic skills. • An appropriate (not too large, not too small) size should be considered so the primary mirror can be touched with a finger. • Considering texture is important, such as a smooth primary mirror for explaining some specific features. 2. Presentation • Haptic observing takes time. One model per one visually impaired person is ideal. • In a classroom, try to connect the model to some items in the school curriculum guidelines. • Additional tactile images can be helpful. • Show the scale using a figure of an adult/human. • Related stories and technological facts can help the audience understand the model. • Develop a webpage about how to understand the model for future communicators.
Videos for Touch Astronomy the Universe: Education Developing and Outreach and Disseminating Tacticle Telescope Models Created with a 3D Printer
29
Touch the Universe: Developing and Disseminating Tacticle Telescope Models Created with a 3D Printer
The special exhibition at Tactus Museo was an extension of the presentations of the telescope models to BVI groups and a collaboration between astronomy professionals and braille and tactile materials experts. For JBL staff members, answering astronomy questions from visitors was challenging, so a retired astronomy educator of NAOJ helped with the exhibition. Training museum staff members or assigning an astronomy expert should be considered for tactile exhibitions. Tips for developing and presenting a tactile model are summarised in Box 1. Despite our growing network with BVI communities, dissemination of the telescope models is challenging. Even though STL files can be downloaded from the official site with detailed explanations, most people do not have a 3D printer nor the skills to use it. As a next step, building a circulation system for the models among domestic planetariums and science museums is being planned. Additionally, establishing a website in which tips of planning a tactile exhibition is being considered and more 3D models of other telescopes are planned for the future based off of this project.
Conclusion As reported in previous works (e.g. Bonne et al., 2018; Pérez-Montero 2019), a tactile model is a useful communication tool for both people who are BVI and sighted. When developing a model, feedback from people who are BVI and experts of special needs education are necessary, and a good, understandable model sometimes depends on their haptic observing skills. In addition to developing a tactile model, how to present the model to BVI people is a key component to disseminating it.
Acknowledgements The Subaru Telescope 3D models and the tactile diagrams were improved with comments from Mr Naoto Shibata, Dr Kojiro Hirose, Mr Sadao Hasegawa, Mr Hiroshi Nagao, and Ms Harumi Fujiwara. The Touch the Universe special exhibition was planned and developed in collaboration with Mr Tetsuji Tanaka, Mr Hideji Nagaoka, Mr Nobuzane Ito, Ms Sanae Kawashima, other staff members of Japan Braille Library, and Dr Susumu
30
Ouchi at Educational Materials Library Seen with Hands and Eyes. This work was supported by JSPS KAKENHI Grant (# 16K01050).
Arcand, K.K., et al., CAPjournal, 22, 2017, p.1420, https://www.capjournal.org/ issues/22/22_14.pdf
Notes
Bonne, N.J. et al., Astronomy and Geophysics, 59 (1), 2018, p. 1.30-1.33, https://doi. org/10.1093/astrogeo/aty028
1 You Can Do Astronomy LLC: http://www. youcandoastronomy.com
NAOJ Mitaka Audio Guide: https://www.nao. ac.jp/study/mitaka-guide/ 2
A Touch of the Universe: https://astrokit.uv. es/ 3
4
Tactile Universe: https://tactileuniverse.org
NASA Tactile Universe: http://chandra.cfa. harvard.edu/tactile/ 5
6 NASA 3D Resources: https://nasa3d.arc. nasa.gov
IAU working group Astronomy for Equity and Inclusion: http://sion.frm.utn.edu.ar/iau-inclusion/ 7
IAU Strategic Plan: https://www.iau.org/ administration/about/strategic_plan/ 8
Arcand, K.K., et al., JCOM, 18 (04), 2019, A01, https://jcom.sissa.it/archive/18/04/ JCOM_1804_2019_A01
Mineshige, S., et al., The Astronomical Herald, 102, 2009, p. 543-551 http://www.asj.or.jp/ geppou/archive_ open/2009_102_09/102_543.pdf Ortiz-Gil, A. et al., CAPjournal, 11, 2011, p.1215, https://www.capjournal.org/ issues/11/11_12.pdf Pérez-Montero, E., Nature Astronomy, 3, 2019, p.114-115, https://www.nature.com/articles/ s41550-019-0693-3 Usuda-Sato, K. et al., Nature Astronomy, 2, 2018, p.692-694, https://www.nature.com/ articles/s41550-018-0567-0 Watanabe, S. et al., Science, 364, 2019, p.268272, https://science.sciencemag.org/content/364/6437/268
Subaru Telescope: https://subarutelescope. org 9
10 Simplifications included removing details from the top ring of the telescope and the protective case of the mirror. These details were not necessary for the overall explanation of the telescope. 11 Making Tactile Models with a 3D Printer: http://prc.nao.ac.jp/3d/index_e.html 12 EDEL software (in Japanese): http://www. ntut-braille-net.org/EDEL-Web/index.html
PIAF (Picture in a Flash): http://piaf-tactile. com/piaf/
Biographies
13
Tactus Museo at Japan Braille Library (Japanese): https://www.nittento.or.jp/about/ fureru/index.html 14
15 Braille font created and distributed by Japan Lighthouse (in Japanese): http://www.lighthouse.or.jp/tecti/tecti/br-font.html 16 Japan Planetarium Society, 3D data of Ryugu (Japanese): https://planetarium.jp/ ryugu/ 17 Universe Awareness, Universe in a Box: https://www.unawe.org/resources/universebox/
Inspiring Stars: https://www.iau-100.org/ inspiring-stars 18
References Arcand, K.K., et al., CAPjournal, 8, 2010, p.1517, https://www.capjournal.org/ issues/08/08_15.pdf
Kumiko Usuda-Sato is an astronomer at the NAOJ Public Relations Center. During her 15-year stay in Hawai‘i, she conducted extensive outreach activities for the local community and introduced them to the Subaru Telescope. Hirotaka Nakayama is a visualisation expert of scientific data at the NAOJ FourDimensional Digital Universe (4D2U) Project. His virtual reality (VR) movie A Journey Through the Milky Way won the Best VR Science Experience at the Lumiere Awards, promoted by the US Headquarters of the Advanced Imaging Society. Hideaki Fujiwara is an astronomer in charge of public information at the Subaru Telescope. His research speciality is astro-mineralogy and infrared astronomy, particularly to investigate planets and their formation processes. Tomonori Usuda is the project manager of the TMT (Thirty Meter Telescope)-J Project. Previously, he worked at the Subaru Telescope as the associate director and the chief of the telescope engineering division.
CAPjournal, No. 26, October 2019
Avivah Yamani
Wicak Soegijoko
Keywords
langitselatan avivah@langitselatan.com
langitselatan wicak@langitselatan.com
Total solar eclipse, langitselatan, astronomy communication, online media, social media
The total solar eclipse (TSE) in Indonesia during the first quarter of 2016 was a very popular event in the Southeast Asia region and became a popular topic for both traditional and new media. Many digital media outlets had live coverage on this event. For the astronomy website langitselatan, a new media website, preparation for this event began in 2015. In this instance we used our available channels, which included interactive social media platforms, to share information regarding the 2016 TSE. We used a special domain, gerhana.info, to cover everything about this particular eclipse. This article explores our strategy in utilising new media for astronomy communications using gerhana.info as a case study and its impact up to the day of the eclipse. We also explore the impact on people’s awareness of astronomy topics and events after the TSE via our main website langitselatan. Introduction In 2016, astronomy had become a very popular discussion point in Indonesia due to the then upcoming TSE. It was a special moment for astronomy in Indonesia as the whole country prepared for and then experienced a total or partial solar eclipse on 9 March 2016. TSE-related news began picking up with some traditional media such as TV channels and newspapers in 2015. langitselatan1 (LS) began its coverage of the TSE in March 2015, almost a full year prior to the eclipse. LS spun off a new website that focused on eclipses called gerhana.info2 (GI) (Figure 1), gerhana being the Bahasa Indonesia term for eclipse. This website pointed to a subdomain gerhana.langitselatan.com. As of 26 October 2019, the website currently provides information on the upcoming Annular Solar Eclipse in Indonesia on 26 December 2019. Before the 2016 TSE, we made articles and infographics regarding the basic sciences of an eclipse, why and how they happen, how often they happen, etc. LS also put out maps of the TSE and lists of cities where people could enjoy total or partial eclipse. We focused on infographics as the media of choice for our science communication as we noticed that many web media groups at the time were using infographics to explain many non-science issues. As a service to foreign eclipse chasers
who contacted LS, we began to post information about these TSE viewing sites in English, including information on how to get to the viewing location. This new website was our initial experiment into infographics. Basic Statistics of New Media in Indonesia Indonesian internet users had grown rapidly in 16 years, from two million users in 2000 to 132.7 million users in 2016. With a population of over 250 million people, this meant 51% of the Indonesian population were active internet users in 2016 according to a report from the Indonesian Internet Service Provider Association (APJII)3 (APJII, 2016). The highest internet activity comes from social media, as 89% of Indonesians internet users were active users on social media and mobile internet was the most popular means of connecting, with 326.3 million SIM subscriptions, or 126% versus populations in 2016 (Kemp, 2016). This means multiple users have two SIM cards or mobile numbers on average. Around 85% of internet users use a mobile phone (all types) as their main device to access online information, while 43% carry smartphones. Only 15% of users access the internet from a laptop or desktop. This difference impacts the average duration of people accessing news from their device (Kemp,
Strategising the New Media Role for Engaging the Public Case Study: Total Solar Eclipse
2016). The total daily screen minutes of Indonesian people is 291 minutes per day for tablets and mobile phones, much greater than the 117 minutes per day spent on laptops or computers, based on a 2017 report (ASEAN Up, 2017). The increasing amount of social media usage can also be seen from the statistics of each social media platform, where Indonesia is frequently near the top of the list of countries with the largest number of users. In 2016, Indonesia had the 4th highest number of Facebook4 users, following India, the United States and Brazil (Nguyen, 2017), increasing from 79 million users in January 2016 to 106 million users by January 2017 (Kemp, 2016; Kemp, 2017). In 2019, Indonesia was the third leading country for the number of Facebook users (Clement, 2019). According to a 2016 report from Statistia, Facebook was the most accessed social media in Indonesia, followed by Instagram 5 , Twitter6 , Path7 and Google+8 . BBM 9 and WhatsApp 10 were the most accessed instant messaging platforms in Indonesia followed by Facebook Messenger11 and LINE12. Indonesian internet users are the most prominent target for LS and GI to share news and information, as they could create a snowball effect to reach those with no internet access or those who choose not to have any online profile based on our work at LS. Indonesian social media users in particular have become the main target for passing on
31
Research and Applications
Strategising the New Media Role for Engaging the Public Case Study: Total Solar Eclipse
any information, including educational information such as that for the 2016 TSE.
History of TSEs in Indonesia The TSE on 9 March 2016 in Southeast Asia started in the Indian Ocean and ended in the Pacific Ocean. The path of totality extended from the most southwesterly point of Indonesia’s territory to its most eastern point. The narrow path of totality in Indonesia passed through 12 provinces. Even outside of the path of totality, many viewers in Indonesia were able to see at minimum a 50% partial solar eclipse. It was a special opportunity for the Indonesian public to experience totality and build astronomy awareness. However, Indonesia has a long history with the previous TSEs that has prevented people from observing solar eclipses (Wahyudi, 2016). Since Indonesia’s independence in 1945, Indonesia has had 18 partial solar eclipses, nine TSEs, and six annular solar eclipse. During the early years of independence, the government had to manage folkloric beliefs as many people were still illiterate and relied on superstitions to explain natural occurrences. For the 1983 TSE, the government advised the public to not view the solar eclipse, directly touting the dangers of eye damage if you did (Wiguna, 2016). However, it was during this TSE when professors from the Institut Teknologi Bandung’s Astronomy Department began to inform the public that eclipses are a naturally occurring event, not a bad omen, and, most importantly, that it was safe to view them (Okw, 2016). Unfortunately, during this time the public governmental announcements were in conflict with this message, and the public followed the government’s instructions to not observe the solar eclipse (Tempo.co, 2016). After the 1983 TSE, despite the government’s recommendations to not observe the solar eclipse, amateurs astronomers had grown in numbers and started to hold public observation at schools in Jakarta because of curiosity of astronomical events, such as the 1986 flyby of Halley’s Comet and the then-forthcoming 1988 TSE (Yamani, 2011). Then, for the 1988 TSE, the government did not release
32
instructions recommending that the public not observe the eclipse (Kurniawan, 2016). The increasing number of internet users in Indonesia, along with more blogging and science websites such as LS, helped spread scientific information and that TSEs were a natural phenomenon. In 2016, the government even saw the TSE as a good opportunity for tourism (Kementrian Pariwisata Republik Indonesia, 2016; Khabibi, 2016).
langitselatan In Indonesia, astronomy has been known since ancient times to be for maritime and agricultural life (Yamani, 2015). For centuries, different cultures in Indonesia have had different stories and each celestial event always brought public attention and curiosity (Kusumaningrum, 2009). Astronomy can provide exciting gateways into science, culture and technology, but to do so we needed a media to communicate this wonder to the public. “langitselatan” translates to “southern sky” in Bahasa Indonesia, the official lingua franca of Indonesia and the main language of all our websites. LS was chosen due to Indonesia’s location
being predominantly in the Southern Hemisphere (1°N to 8°S). Established in 2007, LS was established by a group of alumni from Astronomy Department at Institut Teknologi Bandung (langitselatan, 2019) and had become the leading website for astronomy communication in Indonesia by 2016. Until 2005, even though most daily newspapers had covered astronomy news, a specialised media (online media or printed media) in astronomy in the Indonesian language was nearly non-existent (Nataresmi, 2006). At the same time, the public need for astronomy information had increased, especially after several events such as the Mars Opposition in 2003, the transit of Venus in 2004, and solar and lunar eclipses. In 2005, we published an astronomy magazine Centaurus and star ted Centaurus Online as the first astronomy-focused media in Indonesia, but both were discontinued in 2007. We changed to an easily searchable name in addition using the more interactive blog format (O’Reilly, 2015) in establishing the LS website to better reach the Indonesian public and share astronomy information. We chose online media as our main ser vice medium because of the increasing numbers of internet users in Indonesia.
Figure 1. The Bahasa Indonesia landing page for the GI website. Credit: langitselatan
CAPjournal, No. 26, October 2019
Other technical challenges were browser and device compatibility. To overcome this problem, we built a user friendly website which could be accessed by any browser or device. Local and national traditional media had the widest reach in Indonesia as they could reach people in areas with a low penetration of internet users. According to APJII report (2016), 65% of internet users were in Java, followed by Sumatra with 15.7% users. Internet penetration in other islands was less than 6.5%. Traditional media covered a much wider area, such as the state-run television station (TVRI) which had a 93% coverage area (Badan Pusat Statistik, 2018).
Figure 2. Sitemap for GI. Credit: langitselatan
LS also shares astronomy tools and education material with public. Simple hands-on tools are provided on the website and can be downloaded.
The Challenge Before the 2016 TSE Professional astronomers, amateur astronomers and communicators worked together through the National Eclipse Committee to spread the information and to educate people in the country but the biggest challenge was the Indonesian territory itself. Indonesia is comprised of 13 000 islands, with over 300 ethnicities and 742 local languages and dialects. In an emerging market such as Indonesia, where internet penetration is still relatively low, information distribution can become another challenge. While there are several channels of information distribution in Indonesia, both traditional and new media, this dispersion required us to find the most effective way to disseminate and share TSE information. Based on a Google search of TSE news, print and electronic media massively covered the story two months to a few days before the event. General information about TSEs and tourism opportunities had been covered by news outlet since early 2015 (Wahyuningsih, 2015), while information on how to
observe the eclipse, particularly without proper filters, was not covered until January 2016 (Muslimah, 2016). The latter was especially necessary to people who lived in the path of totality since most of these areas are remote with little or no access to the internet, let alone astronomy. Scientific information was also needed since the Indonesian public has had a low-level understanding of astronomy since the decline of natural science content in many middle school texts in 2013. Thus, the challenge was how to reach people effectively. This is an age-old question in media and still holds true for new media, particularly in Indonesia, the 7th largest country in the world. There were some considerations to be had such as readers’ technical and scientific knowledge as well as writers’ knowledge and capabilities. According to the 2016 Program for International Student Assessment (PISA), Indonesia ranked 62 out of 70 countries overall in science, maths, and reading in 2015 (OECD, 2016), lagging behind other middle income economies and East Asian neighbors. To overcome this issue, we attempted to use language as colloquial as possible to explain all the basic concepts.
Strategising the New Media Role for Engaging the Public Case Study: Total Solar Eclipse
On the other hand, the number of new media users was rapidly growing, along with the increase of mobile users. Based on an APJII (2017) report on internet users behaviour in 2016, 47.6% of users accessed the internet through mobile phones, with 50.7% using mobile phone and computer. The type of content that was accessed the most was social media (97.4%) with 54% of users visiting Facebook and 97.5% of those users used social media for sharing information (APJII, 2016). Facebook (70.94%), LINE Today (50.64%), and WhatsApp (27.39%) become the main platforms to get daily news or current issues, while 46.8% looked for the news directly from a media outlet website (DailySocial Id, 2017). Raising astronomy awareness also had another advantage with the growth of the internet and social media users in Indonesia. We needed to provide information that was easily accessible and shareable through social media and instant messaging platforms. These reasons lead us to combine a blog with social media and social messaging platforms to share the TSE information and reach a wider audience in the country.
A New Eclipse Website: gerhana. info Ideally we could have used LS as our main platform to raise awareness of the TSE. LS was already well known and had a steady and solid reader base. However, one issue with this is that it would be very inconvenient for new readers and
33
Strategising the New Media Role for Engaging the Public Case Study: Total Solar Eclipse
readers searching for only TSE information as LS has astronomy information unrelated to the TSE. Secondly, it would be uncharacteristic of LS to provide non-astronomy information for tourists to Indonesia. As noted above, many readers had asked LS for website specific information, i.e. how to get to a certain viewing site, hotels and modes of transport near these viewing sites, etc. Additionally, by having a separate website we were able to specifically measure the interest for the TSE and our contribution to it. The Name
A common challenge in starting a new website, aside from growing the traffic and increasing the numbers of readers, is choosing a name. We required a short, simple and specific name for readers who were looking for information regarding just the TSE, hoping this would make the name easy to remember and share by word-of-mouth. We choose Gerhana, which means eclipse in Bahasa Indonesia, as the name of the website. Originally we designed the website to be a subdomain of LS, but this was prone to misspellings and misdirections. We chose the .info generic top-level domain (GTLD) for the final combination of GI.
The Content
GI is a niche website that aims to communicate and educate the public about solar eclipses and the content plays an important role in fulfilling this purpose. To meet our readers’ needs, we defined and classified the content that we needed to provide. General information on solar eclipses became our first topic as people needed to know the fundamental science of an eclipse. Once we had that, we provided specific information about the 2016 TSE including when it would happen, where to observe it and how to safely observe it with simple tools. As for touristic information, we provided information on destinations in the path of totality including the closest airports, accommodations, tourist attractions, local transport and a link to the local government or tourist center. This information was distributed without collaboration with travel agencies or local governments. In addition to that, we also provided information about TSEs, solar observations, and the 2016 TSE coverage area map in a series of infographics as people are easily attracted to visual information. All of this information was bilingual to attract non-Indonesia language speakers and written with
simple English, which is easier to translate with Google Translate. Sitemap
There are five sections on the GI website (Figure 2). We started with a section titled “About Total Solar Eclipses” and provided the basic scientific information about eclipses in general. In the next section we provided information specifically about the 2016 TSE including where and when it was happening, general information about the weather in Indonesia, and the eclipse obscuration in various cities in Indonesia. The third section covered basic travel information for the various destinations in the path of totality. The last two sections were infographics and frequently asked questions.
Popularising Strategy We were able to quickly popularise GI by using our main social media channels: two Twitter accounts (@gerhanainfo13 (previously @gerhana2016), @langitselatan 14 , LS Facebook 15 , LS Google+ and langitselatan itself. All eclipse related news and articles would direct users to the GI website. Both websites benefited from this
The new website was dedicated to eclipse information in general but made use of the TSE momentum so we could grow its traffic from the keyword “eclipse”. The basic idea of this new website was to share any scientific information about solar eclipses, including how and where to observe. However, we took advantage of multiple aspects of the TSE such as tourism and photography, and provided supportive information on these topics. As we started the new website in March 2015, we realised that not all destinations in the path of totality had proper information for tourists, especially for foreign visitors. As many eclipse chasers and tourists were planning to observe totality from Indonesia, we decided to provide bilingual translations to cover a global audience. Hence, we have GI in Bahasa Indonesia as the main language and English as a secondary language for the website.
34
Figure 3. Site comparison of the number of pageviews between langitselatan (blue) vs gerhana.info (orange) from February-March 2016. Each set of blue and orange bars is one day beginning on 1 February 2016. The greatest peaks on the GI website occurred on 9 March 2016 and 10 March 2016. Credit: langitselatan
CAPjournal, No. 26, October 2019
for TSE started increasing on 1 March and reached its peak on 8 March. The top keyword searches showed us that visitors visited GI by searching for the keyword combination of “total solar eclipse 2016” and “solar eclipse” in Indonesian terms (Figure 5). This showed us that the public prefers to visit a website with a direct, short name that is easy to find and easy to remember, as we suspected.
Figure 4. Keyword combinations people used to find the GI website through any search engine, with Google as the leading search engine. Credit: langitselatan
cross-referencing, as once a person was on the eclipse article on the LS website, they would be exposed to links to other articles that may or may not be related to the eclipse. We would post during primetime in the morning at 08:00 WIB and again in the evening at 19:00 WIB. The authors would re-share the information through their personal accounts and the posts were iteratively shared later as well. We mainly used Facebook page statistics to define the best times to post every day. However, posting during primetime created some challenges. First, we would be in competition with whatever was happening at that time. Secondly, other astronomy websites could post before us and “steal the thunder.” As for infographics, we posted them on GI and shared them through social media and messaging platforms. At several points during the campaign, the LS team would be interviewed by traditional media. Each interview resulted in a spike in pageviews on both websites even though this only had a shortterm influence on both websites’ growth. To distribute information, including infographics, to areas without internet access, we actively sent information in print or electronic format to local collaborators to share with their peers and journalists for local and national audiences.
During the 2016 TSE, we were part of the National Eclipse Committee and articles on GI were reposted on the official eclipse website. We also collaborated with local government and Tourism Ministry to share information to the areas in the path of totality.
Results In general, the response was much better than anticipated. GI pageviews pre- and post-eclipse surpassed LS statistics. In Figure 3 we can see pageviews versus time. The pageviews spiked several times corresponding to the aforementioned interviews or citings. In February, there were several spikes in GI after an interview on 18 February (2628 pageviews), 26 February (4761 pageviews), 29 February (6229 pageviews), and 4 March (15 651 pageviews). Most news did not have a backlink to GI or LS, but on 4 March, the LS eclipse team was featured on Kompas, a national newspaper, for the DIY pinhole projectors (Utomo, 2016). On 6-8 March, the LS team was again covered in printed media such as Kompas and Jawa Pos as well as a special talk show on CNN Indonesia. Unfortunately, we could not define if the pageview increase was affected by the aforementioned interview only, because according to Google Trends, searches
Strategising the New Media Role for Engaging the Public Case Study: Total Solar Eclipse
From the referral websites to GI we learned that several traditional media and institutions had cited our material as their source, including the National Eclipse Committee website. The website also became an information source for international travel websites such as Cloudy Nights, Stargazers Lounge (2016) and Trip Advisor (2016). All backlinking from foreign websites made up 1.83% of contributions to the website’s pageview. The most visited articles in GI also proved that visual information and shorter articles were preferable. The FAQ (67 348 pageviews) became the most visited articles followed by our infographic series. This infographic series have been proven effective at providing key information such as “Time and Location of TSE 2016” (28 499 pageviews) and “How to Observe Solar Eclipse” (11 539 pageviews). Both infographics reached more than 16 000 people on Facebook. The English version of the infographics received 650 pageviews, especially “Time and Location of TSE 2016”. Infographics became popular because people could share the image through social media without visiting the website, but this in turn means we have no information on their reach. These were, however, effective because the new visitors on average only spent 1 minute 47 second while returning visitors would stay for 3 minutes 22 second. From Figure 5 we can see that LS was popular among young readers at the post-high school age. This is supported by the internet dispersion data in the 2016 APJII report that 75.8% internet users were young adults (Figure 6). Among the visitors, most of them were new visitors. From our statistics, 170 000
35
Strategising the New Media Role for Engaging the Public Case Study: Total Solar Eclipse Eclips
Figure 5. Age ranges of visitors to GI from February to March 2016. The x-axis is the visitors age and y-axis is the number of visitors to the website. Young visitors (18-24) to GI dominated viewership age ranges. Credit: langitselatan
visitors found us through search engines and 7000 from social media, with 6500 new visitors from Facebook. The short and direct domain became the main advantage as people found the website easily through search engines. Facebook accounted for 5% of visitors to the website, as people in Indonesia were actively accessing this platform. Based on Twitter analytics of @gerhanainfo, “TSE from various city”, “FAQ”, and “Infographic: How to observe the sun” received high engagement and potential reach for being retweeted by LS and followers of LS or GI accounts (Twitonomy, 2017; Twitter Analytics, 2017). From Figure 7, we can see that most visitors to the website were those who could also experience a partial solar eclipse in Southeast Asia. These visitors were looking for information about the eclipse or destination information for traveling to Indonesia, despite the language barrier. In the end, we could drive more foreign traffic to the website. According to our statistics, 67% of our readers accessed GI through a mobile device (Figure 8). This is consistent with the increasing numbers of mobile internet activities in Indonesia (APJII, 2016; Kemp, 2017).
36
Figure 6. Internet penetration in Indonesia as a whole based on age. Credit: APJII
From geolocation data, GI visitors came from 87 cities in Indonesia (Figure 9) and 110 countries in the world. By the end of the 2016 TSE, we still could not reach the whole of Indonesia by website alone because of the limitation of internet access in many areas.
Evaluation & Future Plan By using a niche website for an event such as the TSE, visitors with specific queries in mind could find answers more efficiently and not be distracted by other astronomy-related information. Through feedback via email, the comment section of our website and social media, we learned that our visitors came from a broad range of groups with various backgrounds and interests. Some were lay people interested in watching the solar eclipse as a tourist (domestic and foreign). By having all eclipse information in a single website for the TSE, it helped the visitors find answers. For visitors with an interest in astronomy, they tended to look for information on the LS main website. A direct affiliation between the websites resulted in the GI website gaining trust from visitors, and visitors were more likely to return and stay longer. Referral statistics for GI showed that LS was the third highest referral connection
to the GI website in 2016. From LS statistics, direct links from GI resulted in GI being the fourth highest referral website to LS articles in 2016. Statistics showed us that information delivery via GI was effectively done in comparison with the main website and it was an efficient combination of domain and subdomain. Direct to domain was the most often used method for effective Search Engine Optimisation (SEO), a process of increasing visibility for a website, for the 2016 TSE. Having a subdomain containing all the articles and infographics to the eclipse saved readers time, while using general search terms that were used by the public to look for this information resulted in an effective SEO keyword combination to increase traffic. The infographics with basic information about eclipses were very useful for the public as they could grab people’s attention in a short time and provide quick information about the TSE. Infographics were also easy to share, hence visitors could share the graphics across social media networks and instant messaging platforms. Infographics were a powerful tool to build solar eclipse and astronomy awareness, as well as our brand awareness. We received short, informal reports from people using our arti-
CAPjournal, No. 26, October 2019
Figure 7. Visitors to the GI website from February-March 2016 came from many different countries. Visitors from Indonesia constituted the highest percentage of these visitors, followed by visitors from the United States. Credit: langitselatan
cles, infographics, and do-it-yourself eclipse material in their eclipse activities (Amarduan, 2016; Purwanti, 2016). Some people sent us the observations they made using the material we provided. We also received an article about our activities being used at 15 schools. All the aforementioned stories have been featured on LS-related websites. Our strategy to utilize social media was the most effective way to reach the Indonesian public aged 18-24. Facebook was the top social media platform which led visitors to GI. Twitter was not optimal without the utilization of an influencer. We accomplished what we set out to do, and even after the 2016 TSE, GI continues to serve the public. Since 2016, GI has provided lunar eclipse infographics and an e-book (Yamani, 2018). The website has also provided information on future eclipses in general and specifically the 26 December 2019 annular solar eclipse in Indonesia and other Southeast Asian countries. GI continues to provide weather and tangential logistical information for travel for these eclipses. Since 2016, GI has reached readers in 342 cities in Indonesia and 178 countries (Figure 10), and will continue to be used by LS for lunar eclipses and solar eclipses that occur in Indonesia. Niche websites like this can quickly and easily implemented for other events or in different languages for other countries,
Figure 8. Percentages of devices used to access GI from FebruaryMarch 2016. Mobile phones dominated the devices used. Credit: langitselatan
and it will raise astronomy awareness in many different places.
Notes 1
langitselatan: https://langitselatan.com
2
gerhana.info: http://gerhana.info
3
APJII: https://apjii.or.id/welcome
4
Facebook: https://www.facebook.com/
5
Instagram: https://www.instagram.com/
6
Twitter: https://www.twitter.com/
7
Path: https://path.com/
8
Google+: https://plus.google.com/
9
BBM: https://www.bbm.com/
10
WhatsApp: https://www.whatsapp.com/
Facebook Messenger: https://www.messenger.com/ 11
12
LINE: https://line.me/en/
13
GI Twitter: https://twitter.com/gerhanainfo
14
LS Twitter: https://twitter.com/langitselatan
Figure 9 The coverage area of GI in Indonesia in 2016. Much of the coverage was centered in cities. Credit: langitselatan
Strategising the New Media Role for Engaging the Public Case Study: Total Solar Eclipse
LS Facebook: https://www.facebook.com/ langitselatan/ 15
References Amarduan, T. ‘Mengejar Matahari di Bumi Raja-Raja Ambon Manise‘, langitselatan, 2016. https://langitselatan.com/2016/03/22/ mengejar-matahari-di-bumi-raja-raja-ambon-manise/ APJII, ‘Penetrasi & Perilaku Pengguna Internet Indonesia 2016 Survey’, APJII, 2016. https:// apjii.or.id/survei2016/download/ FL01DmR7csSBk3TJvXV4b5aHZl2qen ASEAN Up, ‘Internet and digital landscape in Indonesia’, ASEAN Up, 2017. http://aseanup. com/internet-digital-landscape-indonesia/ Badan Pusat Statistik, ‘Statistik Potensi Desa Indonesia (Village Potential Statistics of Indonesia) 2018’, 2018. https://bulelengkab. go.id/assets/instansikab/126/bankdata/ statistik-potensi-desa-2018-90.pdf
Figure 10. The coverage area of GI in Indonesia in 2019. Most readers are based on the Java and Sumatra islands. Credit: langitselatan
37
Strategising the New Media Role for Engaging the Public Case Study: Total Solar Eclipse Eclips
Clement, J., ‘Leading countries based on number of Facebook users as of July 2019 (in millions)’, Statista. 2019. https://www.statista.com/statistics/268136/top-15-countriesbased-on-number-of-facebook-users/ DailySocial.id,’Laporan DailySocial: Kebiasaan Membaca Berita Secara Online di Indonesia’, DailySocial.id, 2017. https://dailysocial.id/post/laporan-dailysocial-kebiasaan-membaca-berita-secara-online-di-indonesia Kementerian Pariwisata Republik Indonesia (Ministry of Tourism of the Republic of Indonesia), ‘Siaran Pers Gerhana Matahari Total 2016 Momentum dongkrak pariwisata Indonesia’, Kementerian Pariwisata Republik Indonesia, 2016. http://www.kemenpar.go. id/post/siaran-pers-gerhana-matahari-total-2016-momentum-dongkrak-pariwisata-indonesia Kemp, S., ‘Digital in 2016’, We are Social, 2016, p. 214-229. https://www.slideshare. net/wearesocialsg/digital-in-2016 Kemp, S., ‘Digital in 2017 Global Overview’, We are Social, 2017. https://www.slideshare.net/ wearesocialsg/digital-in-2017-global-overview Kemp, S., ‘Digital in 2017: Southeast Asia: A Study of the Internet, Social Media, and Mobile Use Throughout the Region’, 2017, p. 32-54. https://www.slideshare.net/wearesocialsg/digital-in-2017-southeast-asia Khabibi, I., ‘Menpar Targetkan 100 Ribu Wisman Saksikan Gerhana Matahari Total di Indonesia’, detiknews, 2016. https://news. detik.com/berita/3133265/menpar-targetkan-100-ribu-wisman-saksikan-gerhana-matahari-total-di-indonesia Kurniawan, B., ‘Cerita dan Kisah Tak Terlupakan Memandang Pesona Gerhana Matahari Total 1988,’ Tribunnews.com, 2016. https://www.tribunnews.com/ travel/2016/02/03/cerita-dan-kisah-tak-terlupakan-memandang-pesona-gerhana-matahari-total-1988 Kusumaningrum, D.P. et.al., ‘Folklore as an Astronomical Study of Indonesian Traditional Society Case Study: Bima Sakti and Batara Kala’. Proceeding of the 10th Asian- Pasific Regional IAU Meeting 2008. Published by China Science & Technology Press, 2009, pp. 399 – 400. ‘Tentang LS (About LS)’, langitselatan, 2019. https://langitselatan.com/tentang-ls/ Muslimah, S., ‘Begini Cara Aman Melihat Gerhana Matahari Total’, detiknews, 2016. https://news.detik.com/berita/d-3116542/ begini-cara-aman-melihat-gerhana-matahari-total
38
Nataresmi, A.H. et.al.,’Building An Amateur Astronomical Community by Popular Astronomy Magazine Publishing.’ The 9th Asian-Pacific Regional IAU Meeting. Publisher: Institut Teknologi Bandung Press, 2006, p.358-359.
Wiguna, O., ‘Pemerintah Larang Menonton Gerhana 1983 Karena Bisa Membutakan Mata’, detiknews, 2016. https://news.detik. com/berita/3126661/pemerintah-larang-menonton-gerhana-1983-karena-bisa-membutakan-mata
Nguyen, H., ‘Indonesia is the fastest growing country for internet use - report’, Rappler. com, 2017. https://www.rappler.com/world/ regions/asia-pacific/indonesia/bahasa/englishedition/159593-internet-social-media-statistics
Wahyudi, M. Z., ‘Memori Kelam GMT 1983 Jangan Sampai Terulang’, Kompas, 10 February 2016.
OECD. ‘Pisa 2015, Results in Focus’, 2016. https://www.oecd.org/pisa/pisa-2015-results-in-focus.pdf Okw - detikNews, ‘Astronom Melawan Instruksi Presiden Soeharto Soal Gerhana 1983’, detiknews, 2016. https://news.detik.com/ berita/3133797/astronom-melawan-instruksi-presiden-soeharto-soal-gerhana-1983 O’Reilly, T., ‘What is Web 2.0?’, O’Reilly, 2005. https://www.oreilly.com/pub/a/web2/ archive/what-is-web-20.html
Yamani, A., Jejak Langkah Astronomi di Indonesia, langitselatan, 2011. https://langitselatan.com/2011/01/02/jejak-langkah-astronomi-di-indonesia/ Yamani, A. et.al., ‘The Need of Distance Learning For Astronomy Development in Indonesia’, Proceedings of APRIM 2014. Published by The Korean Astronomical Society, 2015, pp. 715 – 718. Yamani, ‘Buku Gerhana Bulan di Indonesia’, Gerhana Info, 2018. https://gerhana.langitselatan.com/buku-gerhana-bulan-di-indonesia/
Purwanti, S.A., ‘Sosialisasi Gerhana Matahari di SD Plus BBS Bogor’, langitselatan, 2016. https://langitselatan.com/2016/02/25/sosialisasi-gerhana-matahari-di-sd-plus-bbs-bogor/ Stargazers Lounge, 2016. https://stargazerslounge.com/topic/257793-solar-eclipse-2016/ Statista Research Department, ‘Most popular social media of mobile internet users in Indonesia as of January 2016, by age group’, Statista, 2016. https://www.statista. com/statistics/279776/preferred-netizen-social-media-in-indonesia-by-age/ Tempo.co., ‘Heboh Gerhana Matahari Total 1983 Karena…’, Tempo.co, 2016. https:// tekno.tempo.co/read/738554/heboh-gerhana-matahari-total-1983-karena Trip Advisors, 2016. https://www.tripadvisor. com/ShowTopic-g800479-i31681-k8896818Solar_Eclipse_March_9_2016-Halmahera_ North_Maluku_Maluku_Islands.html
Biographies
Twitonomy, 2017. http://www.twitonomy.com/ Twitter. 2017. https://analytics.twitter.com Utomo, Y.W., ‘Ada ‘Pinhole’ Raksasa untuk Lihat Gerhana Matahari Total di Maba’, Kompas.com, 2016. https://regional.kompas.com/read/2016/03/08/20212191/Ada. Pinhole.Raksasa.untuk.Lihat.Gerhana. Matahari.Total.di.Maba Wahyuningsih, M., ‘Berwisata Sambil Melihat Gerhana Matahari di Indonesia’, CNN Indonesia, 2015. https://www.cnnindonesia. com/gayahidup/20150106162342-269-22728/berwisata-sambil-melihat-gerhana-matahari-di-indonesia
Avivah Yamani is an astronomy communicator with a speciality in new media. She received her bachelor’s degree in Astronomy and master’s degree in Astronomy and Astrophysics from Institut Teknologi Bandung (ITB). She is a co-founder of langitselatan, an astronomy online media in Indonesia, and the Project Director of 365 Days of Astronomy. Wicak Soegijoko recieved his bachelor’s degree in Astronomy from the Institut Teknologi Bandung (ITB) and his master’s degree in Systems Architecture in Aerospace from the University of Southern California. He has written several papers in the fields of astronomy, science communication, and linguistics.
CAPjournal, No. 26, October 2019
39
Colophon Editor-in-Chief Lina Canas Managing Editor Izumi Hansen Executive Editor Hidehiko Agata Proofreaders Izumi Hansen Layout and Production Lina Canas Izumi Hansen Contributors Mislav Baloković Mei-Yin Chou Lars Lindberg Christensen Suanna Crowley Bethany Downer Peter Edmonds Valeria Foncea
Hideaki Fujiwara Jorge Rivero González Kazuhiro Hada Masaaki Hiramatsu Colin Hunter Katharina Königstein Sarah Leach Nicolás Lira Mariya Lyubenova Satoki Matsushita Hirotaka Nakayama Amelia Ortiz-Gil Harriet Parsons Eduardo Penteado Eduardo Ros Oana Sandu Wicak Soegijoko Calum Turner Tomonori Usuda Kumiko Usuda-Sato Megan Watzke Avivah Yamani Karin Zacher
Web Design and Development Raquel Shida Gurvan Bazin Editorial Board Kimberly Kowal Arcand Richard Tresch Fienberg Amelia Gil-Ortiz Kaoru Kimura Francisco Rodriguez Ramasamy Venugopal Address CAPjournal, IAU Office for Astronomy Outreach, C/O National Astronomical Observatory of Japan 2-21-1 Osawa, Mitaka, Tokyo, 181-8588 Japan ISSNs 1996-5621 (Print) | 1996-563X (Web)
This work is licensed under a Creative Commons License
CAPjournal submission guidelines We are keen to encourage readers to submit their own articles, reviews, and other content. Some key points are addressed below. Technical and esoteric language should be either avoided or used with a footnoted explanation if absolutely required. All contributions will be made to conform to British spelling and punctuation practice. Figures and tables should be referred to as “Figure n” and “Table n” respectively. Acronyms should be spelt in full once and then parenthesised; thereafter they can then be used as lettered acronyms. Numerals should be used for numbers greater than two words and always for numbers greater than ten. Manuscripts should be delivered in MS Word or text (.txt) format, with no formatting apart
Publishers
from bold, italics, super and subscripts. Hard carriage returns after each line should be avoided, as should double spacing between sentences. If the contribution contains figures, these may — just for the sake of overview — be pasted inline in the Word manuscript along with the caption (Word files below 4 MB are encouraged). However, images must also be delivered individually as Tiff, PDFs, vectorfiles (e.g.,.ai,.eps) in as high a resolution as possible (minimum 1000 pixels along the longest edge).
Submit articles for one of the following journal sections: News Announcement Interview Opinion Resources Best practice
Copyright Authors are solely responsible for ensuring copyright clearance to reproduce illustrations, text, etc., for which they themselves do not own the copyright. CAPjournal accepts only original submissions and will only reproduce previously published work by special arrangement. Contact Submissions should be sent to the Editor: editor@capjournal.org
Sponsors
Review Research & Applications Correspondence Column
www.capjournal.org Online issues Free subscriptions Article submission Collaboration