2 minute read
State of the Stainless Steel Nation
In his latest ‘view from the top’ Sassda Executive Director Michel Basson delves into the persistent issue of volatility within the various aspects of the South African economy. From fluctuating material prices and global supply disruptions to unpredictable local electricity supply, our State of the Stainless Steel Nation analysis examines how these uncertainties are creating a uniquely challenging set of circumstances for local stainless steel players…
1. How would you categorise the performance of the South African stainless steel sector in the last year? What is the state of the market at present?
As reported earlier this year, there was an unexpected increase in the use of stainless steel in 2021, locally as well as globally. We ascribe this to two influences. Keeping in mind that stainless steel is used in applications where cleanability, hygiene, and corrosion protection are required, many projects that were put on hold during the pandemic had to go ahead in 2021 as a matter of urgency.
As such, the increased use of stainless steel can be seen as the completion of many projects on temporary hold. On the other hand, many distributors started to replenish stock items as the expectations of market activity increased in 2021. It, therefore, did not come as a huge surprise when there was a lower demand for stainless steel in 2022 across the globe. The geographic markets of Europe and Africa saw a decrease in growth from a spectacular 18% in 2021 to a growth of less than 2% in 2022.
In a sense, it was a period of consolidation, and the use of stainless steel was further dampened due to the spike in nickel prices in Quarter 2 of 2022. The uncertainty around electricity supply reached unknown levels in the latter part of the year with a serious impact on the manufacturing capacity of our members. This meant that any stainless steel that moved in the local value chain, moved at a snail’s pace.
2. Please give some other meaningful stats relating to how the industry has performed?
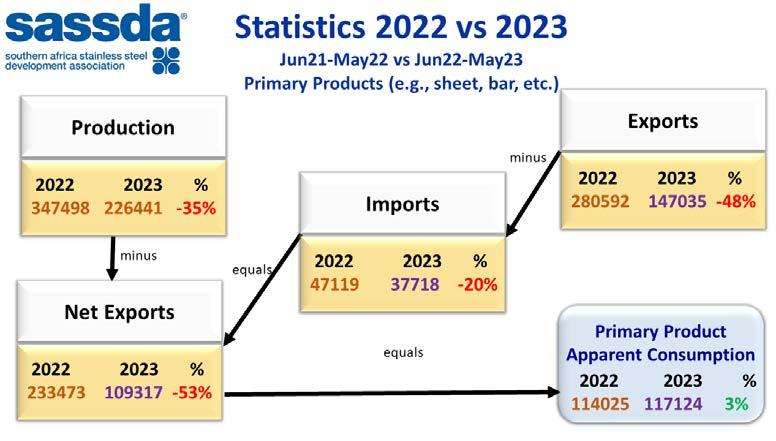
The infographic on the next page shows some of the statistics that Sassda gathers and processes. In this case, we compare the apparent local consumption in the period June 2021 to May 2022 to the reported consumption for the 12 months from June 2022 to May 2023.
The upper right block indicates the change in local production which has reduced by 35%. It should be understood that the local use of stainless steel flat products is small in comparison with the total capacity of the mill, meaning that most of the production is intended for the export market. The limitations on the volumes that can be exported to Europe are showing their impact when the upper left block is studied where exports declined by 48%.
Imports also slowed for various reasons, including the requirement for 100% local content on infrastructure programmes, as well as the exchange rate. This means that nett exports (exports minus imports) also reduced by 53%. Should nett exports be subtracted from the total production the answer yields the apparent local consumption for the period being investigated.

From this graphic, it can be deduced that the apparent local consumption of stainless steel has increased when compared to the previous 12 months. This is very encouraging although it may be a bit early to start any celebrations.

The Reserve Bank showed that after contracting by a revised 1,1% in the fourth quarter of 2022, real gross domestic product (GDP) edged higher in the first quarter of 2023
(January - March), expanding by an estimated 0,4%.
The Sassda infographic indicates an apparent growth rate that far exceeds the country’s GDP growth and this is regarded as a strong positive indicator for our industry.
Sassda members are also more positive albeit that our 3-month forecast based on member confidence still remains below or at 50%. This is illustrated by our monthly measurement of member confidence below.
Members were fairly confident during the winter of 2022, but this confidence started to taper off in the last quarter which can be mainly attributed to the levels of loadshedding during that period combined with the uncertainty regarding the future state of electricity supply.


