MARKET
K A N S A S C I T Y R E S I D E N T I A L R E A L E S T A T E 2 0 2 3 M I D - Y E A R S T A T S COVERPHOTOCREDIT:BICKIMERHOMES
REPORT
Follow Your Dream, Home.
Introduction
Engel & Völkers Kansas City welcomes you to its Biannual Real Estate Market Report. On-the-ground intel from community experts along with local market data informs our analyses and serves as the basis for forecasting trends and providing data-based insights into the constantly shifting housing market
Throughout the year, and on an ongoing basis, we evaluate sales listed in the Multiple Listing Service, local Home Builders Association permit reports, city data, national stats and local economists, resulting in a residential market report for the Greater Kansas City Area
*nformaton and fgures based on data from Heartland Multple Listing Servce uness otherwise noted Data is for informational purposes only and may not be completey accurate due to the MLS reporting processes Thisdatareflectsaspecficpointintime andcannotbeused nperpetuityduetothefluctuating natureofmarkets DREAMS&DESIGNBUILDING
DREAMS&DESIGNBUILDING
Table of Contents National Overview Greater Kansas City Overview Leawood, KS Lenexa, KS Olathe, KS Overland Park, KS Shawnee, KS Blue Springs, MO Lee's Summit, MO Liberty, MO Parkville, MO Raymore, MO A Recap of our KC Spring Parade of Homes Gold Winners Engel & Völkers Kansas City 6 8 10 12 14 16 18 20 22 24 26 28 30 31
National Overview
In 2022 home sales started the year above a 6 5 million sales pace before retreating as mortgage rates rose, ending the year at a 4.0 million sales pace Averaging the early-year highs with the end of year lows, existing home sales for the year totaled 5.0 million.
With affordability headwinds continuing and buying power not improved, economists are expecting home sales to retrench further on an annual basis With an expectation total of 4 2 million home sales in 2023, a dip of 15.8% from one year ago This implies we remain to see steady home sales from the current 2023 midyear average which has been at a sales pace of 4 3 million
An under-supply of available homes for sale continues to hamper home sales While we saw the number of available homes climb as we entered 2023, momentum has drained in recent months
Why do sellers continue to sit on the sidelines when home prices are still high and consumers generally agree that it’s a good time to sell?
More than 4 in 5 home shoppers (82%) report feeling locked-in by their existing low-rate mortgage and 1 in 7 homeowners choosing not to sell report that their current low rate is stopping them from moving
2001 2002 2003 2004 2005 2006 2007 2008 2009 2010 2011 2012 2013 2014 2015 2016 2017 2018 2019 2020 2021 2022 20 15 10 5 0 6 7 . 5 6 8 . 0 6 8 . 3 6 8 . 6 6 9 . 2 6 9 . 0 6 8 . 9 6 7 . 8 6 7 . 5 6 7 . 2 6 6 . 5 6 6 . 0 6 5 . 4 6 5 . 2 6 4 . 0 6 3 . 8 6 3 . 7 6 4 . 2 6 4 . 8 6 5 . 1 6 5 . 8 6 5 . 4 6 5 . 9 Homeownership Rates in the U.S. Over a Twenty-Year Period by Percentage *Figuresbasedon nformatonfromUSCensusBureau 2022fgureisestmatedattmeofgraph 6
U.S. Mortgage Rates Over The Past Three Years
Sales prices have declined slightly from a national level, but this is largely driven by the West In other regions, home prices have either held steady or continued to grow. Nevertheless, National asking prices are on a path to likely soften more while the National median home sales price has already declined modestly for the past 3 months.
Low inventory has us a far cry from a “balanced” market, which would reflect a minimum of 4-6 months inventory on hand And with little to no "low inventory" relief in sight, a sellers market will continue throughout 2023.
$416,100 Q2 2023 NATIONAL MEDIAN HOME PRICE
*AccordingtoFREDEconomicData
Q32020 Q42020 Q12021 Q22021 Q32021 Q42021 Q12022 Q22022 Q32022 Q42022 Q12023 Q22023 8 6 4 2 0
*FiguresbasedoninformationfromFREDEconomicData 3.25 2.79 3.05 2.66 2.87 2.27 3.00 2.30 2.87 3.80 5.26 5.62 6.66 6.37 6.51 2.17 3.04 4.45 4.88 5.96 5.56 5 87 3.08 2.34 30 Year 15 Year 7
Average
Greater Kansas City Overview
No Coast, No Problem! Kansas City remains an envy of many other US cities, even with a softer market we are not experiencing the extreme difficulties that some other areas are experiencing.
Yes home price growth has slowed, or even haulted, with our average selling price year to date almost identical to what it was mid-year 2022 Local supply of housing remains low, and with local builders pulling back on starts it will continue to remain low throughout 2023
Homes are still selling, and fast if priced correctly, just not at a pace that is completely abnormal House
values have and always will be hyper-local, tied to the local economy, area employer base, product availability, inventory and more. With that said, the positives far out way the negatives here in Kansas City.
With the local Kansas City sales volume totaling just under $6 billion for the first half of 2023, there were 17,050 homes sold with the average selling price of $331,202.
In regards to local new construction, although construction costs have leveled in most cases, builders are still struggling with some material delays, but most importantly labor shortages and climbing interest rates
Average Selling Price $331,202
Units Sold 17,050 Average Days on Market 38
Overall List to Sale Price % Volume Sold $5.9 Billion 365 90.6%
Sold Over $1 Million
Construction Volume New Construction Sold 1,746 $1 Billion
8 Greater Kansas City Single Family Home Sales January 2023 - June 2023 (Includes the following counties: Cass, MO Clay, MO Jackson, MO Johnson, KS Platte, MO Wyandotte, KS)
New
Highest KC Recorded Home Sales in the First Half of 2023
No. 1
$4,060,000
Coming in first at $4,060,000 is 5252 Sunset Drive, Kansas City, MO 64112. It's a stunning Neo Georgian Landmark designed by the iconic Shepard, Farrar and Wiser in 1916 This private fully gated treasure offers 1 66 acres perched on one of the highest points in Sunset Hill; it is a secluded oasis in the heart of the city
No. 2
$3,900,000
Coming in second at $3,900,000 is 6321 Norwood Street, Mission Hills, KS 66208. This home was custom built in 2017, with windows on the entire back of the home bringing the outdoors in. Sip your favorite beverage on the lanai overlooking the expansive pool and patio.
Also No. 2 $3,900,000
Tying for second place is another Mission Hills home also sold at $3,900,000, located at 6632 Wenonga Road, Mission Hills, KS 66208. Located in one of Kansas City's most prominent communities, this beauty with almost 10,000 sq. ft. has 5 bedrooms and 8 bathrooms and was built in 1937.
In conclusion, Kansas City real estate is experiencing a period of sustained growth and offers a range of opportunities for homebuyers and real estate investors alike. With a strong job market, affordable housing, and a favorable tax environment, the city is an attractive
destination for those looking to relocate or invest in real estate As the city continues to grow and develop, it’s likely that the demand for real estate in Kansas City will only continue to rise, making it an excellent investment opportunity for years to come.
From the first meeting and initial walk thru, I knew I had made the right choice for customer care and dedication. EV’s experience and professionalism in handling our listing was smooth throughout the entire process with consistent feedback and help thru the closing which was so appreciated. I would highly recommend them for any potential seller looking for a low stress and positive experience.
-Google Review
For us, it was critical to have professionals that’s Engel & Völkers. Everything worked exactly as they planned -- the offers came when and how they predicted. We sold for well above asking. We’ll stick with the Engel & Völkers brand -- they are premiere above all the rest from our experience!!
-Zillow Review
9
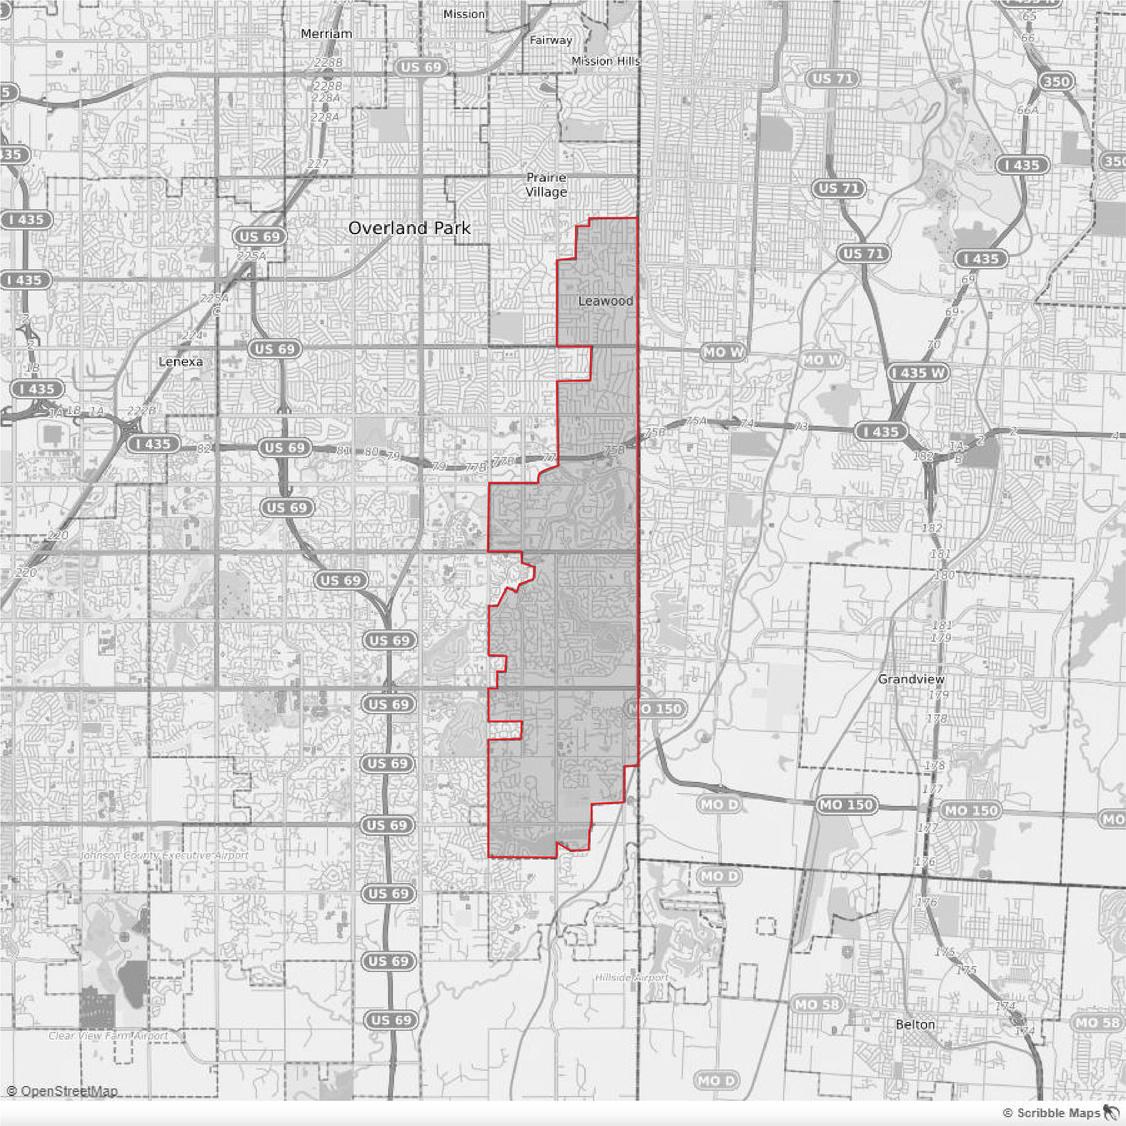
Leawood, Kansas
Leawood market trends for the first half of 2023 indicate an increase of 0 3% in average selling price, with the average topping out at $766,476 Leawood saw a 24% decrease in the number of contracted homes in the first half of 2023 compared to the first half of 2022 In addition, overall sales volume came in at $188 million, which is about 33% lower than the first half of 2022
The three Leawood neighborhoods with the highest number of transactions were Leawood, Leawood Estates and Leawood South
The five highest priced home sales in Leawood for the first half of 2023 ranged from $3,541,525 to $1,950,000, with an average of $289 per square foot
New construction sales volume increased by about 7% to $17 5 million, with an average sales price of $1,253,394, up from $1,170,158 in the first half of 2022 The three residential home builders with the highest number of pulled permits for the first half of 2023 were James Engle Custom Homes, J S Robinson Fine Homes and Willis Custom Homes
Leawood New Construction Sales Volume 2010 - 2022
'21Q2 '21Q3 '21Q4 '22Q1 '22Q2 '22Q3 '22Q4 '23Q1 '23Q2 300 200 100 0 '10 '11 '12 '13 '14 '15 '16 '17 '18 '19 '20 '21 '22 60,000,000 40,000,000 20,000,000 0
New Listings Contracted Sold Average Sale Price
2 6 0 2 6 9 2 1 6 2 2 5 2 1 1 2 3 0 1 9 8 1 8 6 1 5 7 $661,277
$13,237,998 $8,040,920 $15,287,982 $51,295,184 $34,041,812 $42,357,976 $35,427,195 $17,565,405 $31,411,359
$38,119,256 $715,136 $790,021 $721,347 $796,441 $823,45 9 $717,675 $798,156 $703,501 1 9 9 2 2 6 1 5 5 1 9 5 1 9 2 2 1 3 1 1 8 1 1 2 2 3 7 1 4 1 1 0 2 1 0 4 2 0 7 1 5 9 1 3 5 8 2 1 6 3 1 8 8 10
$23,609,360$24,960,716 $55,979,928
Leawood Neighborhoods with Highest Number of Sales First Half 2023
#1 #2
LEAWOOD 35 SOLD
PRICE: $917,071
LEAWOOD ESTATES 31 SOLD
#3
LEAWOOD SOUTH 20 SOLD
Top 5 Sales for Leawood First Half 2023
4 2 Rank 1 2 3 4 5 Address 8416 Ensley Lane 5009 W 146th Street 13805 Canterbury Street 8328 Ensley Lane 3708 W 140th Street Neighborhood Leawood Highlands Creek Tuscany Reserve Leawood Siena of Leawood Style 1 5 Stories 1 5 Stories 1 5 Stories 1 5 Stories Reverse SalesPrice $3,541,525 $2,500,000 $2,150,000 $2,000,000 $1,950,000 LotSize 0 44 Acre 0 69 Acre 0 74 Acre 0 45 Acre 0.49 Acre SqFootage 9,068 8,082 10,031 7,546 7,328 PPSF $391 $309 $214 $265 $266 1 3 5
AVG PRICE:
AVG SQ FT: 2,753 AVG PPSF: $220
$606,412
AVG
AVG SQ FT:
AVG PPSF:
3,254
$282
AVG SQ FT:
AVG PPSF:
AVG PRICE: $492,325
2,914
$169
11
Lenexa, Kansas
Lenexa market trends for the first half of 2023 indicate an increase of 14% in average selling price, with the average topping out at $536,250 Lenexa saw a 13% decrease in the number of contracted homes in the first half of 2023 compared to the first half of 2022 In addition, overall sales volume came in at $176 million, which is about 7% lower than the first half of 2022
The three Lenexa neighborhoods with the highest number of transactions were Arbor Lake, Four Colonies and The Reserve
The five highest priced home sales in Lenexa for the first half of 2023 ranged from $2,672,000 to $1,527,574, with an average of $318 per square foot
New construction sales volume increased by about 33% to $65 6 million, with an average sales price of $820,008, up from $702,775 in the first half of 2022 The two residential home builders with the highest number of pulled permits for the first half of 2023 were Pauli Homes and Scott Homes
Lenexa New Construction Sales Volume 2010 - 2022
'21Q2 '21Q3 '21Q4 '22Q1 '22Q2 '22Q3 '22Q4 '23Q1 '23Q2 400 300 200 100 0 '10 '11 '12 '13 '14 '15 '16 '17 '18 '19 '20 '21 '22 125,000,000 100,000,000 75,000,000 50,000,000 25,000,000 0
2 3 8 2 7 2 1 8 6 2 5 4 2 3 9 2 8 9 2 0 4 1 7 5 1 5 1 3 0 1 3 0 1 2 6 3 2 8 2 2 4 9 2 5 5 $461,789 $421,986 $500,151 $531,098 $539,184 $465,397 $507,814 $451,371 $437,365
$25,645,589 $22,339,055 $34,900,966 $46,888,265 $65,310,915 $76,199,328 $96,414,100 $87,926,152 $98,691,636 $106,375,097 $99,204,592 $99,677,949 1 4 1 1 9 2 2 7 0 1 7 0 1 3 3 1 5 5 2 2 5 1 7 6 1 6 2 1 1 9 2 0 9 2 1 8 $118,514,542 12 New Listings Contracted Sold Average Sale Price
Lenexa Neighborhoods with Highest Number of Sales First Half 2023
ARBOR LAKE 18 SOLD
AVG PRICE: $722,090
AVG SQ FT: 3,100
AVG PPSF: $233
FOUR COLONIES 18 SOLD
AVG PRICE: $262,997
AVG SQ FT: 1,670
AVG PPSF: $157
1 3 5 4 2
Top 5 Sales for Lenexa First Half 2023
13
#3 #1 #2
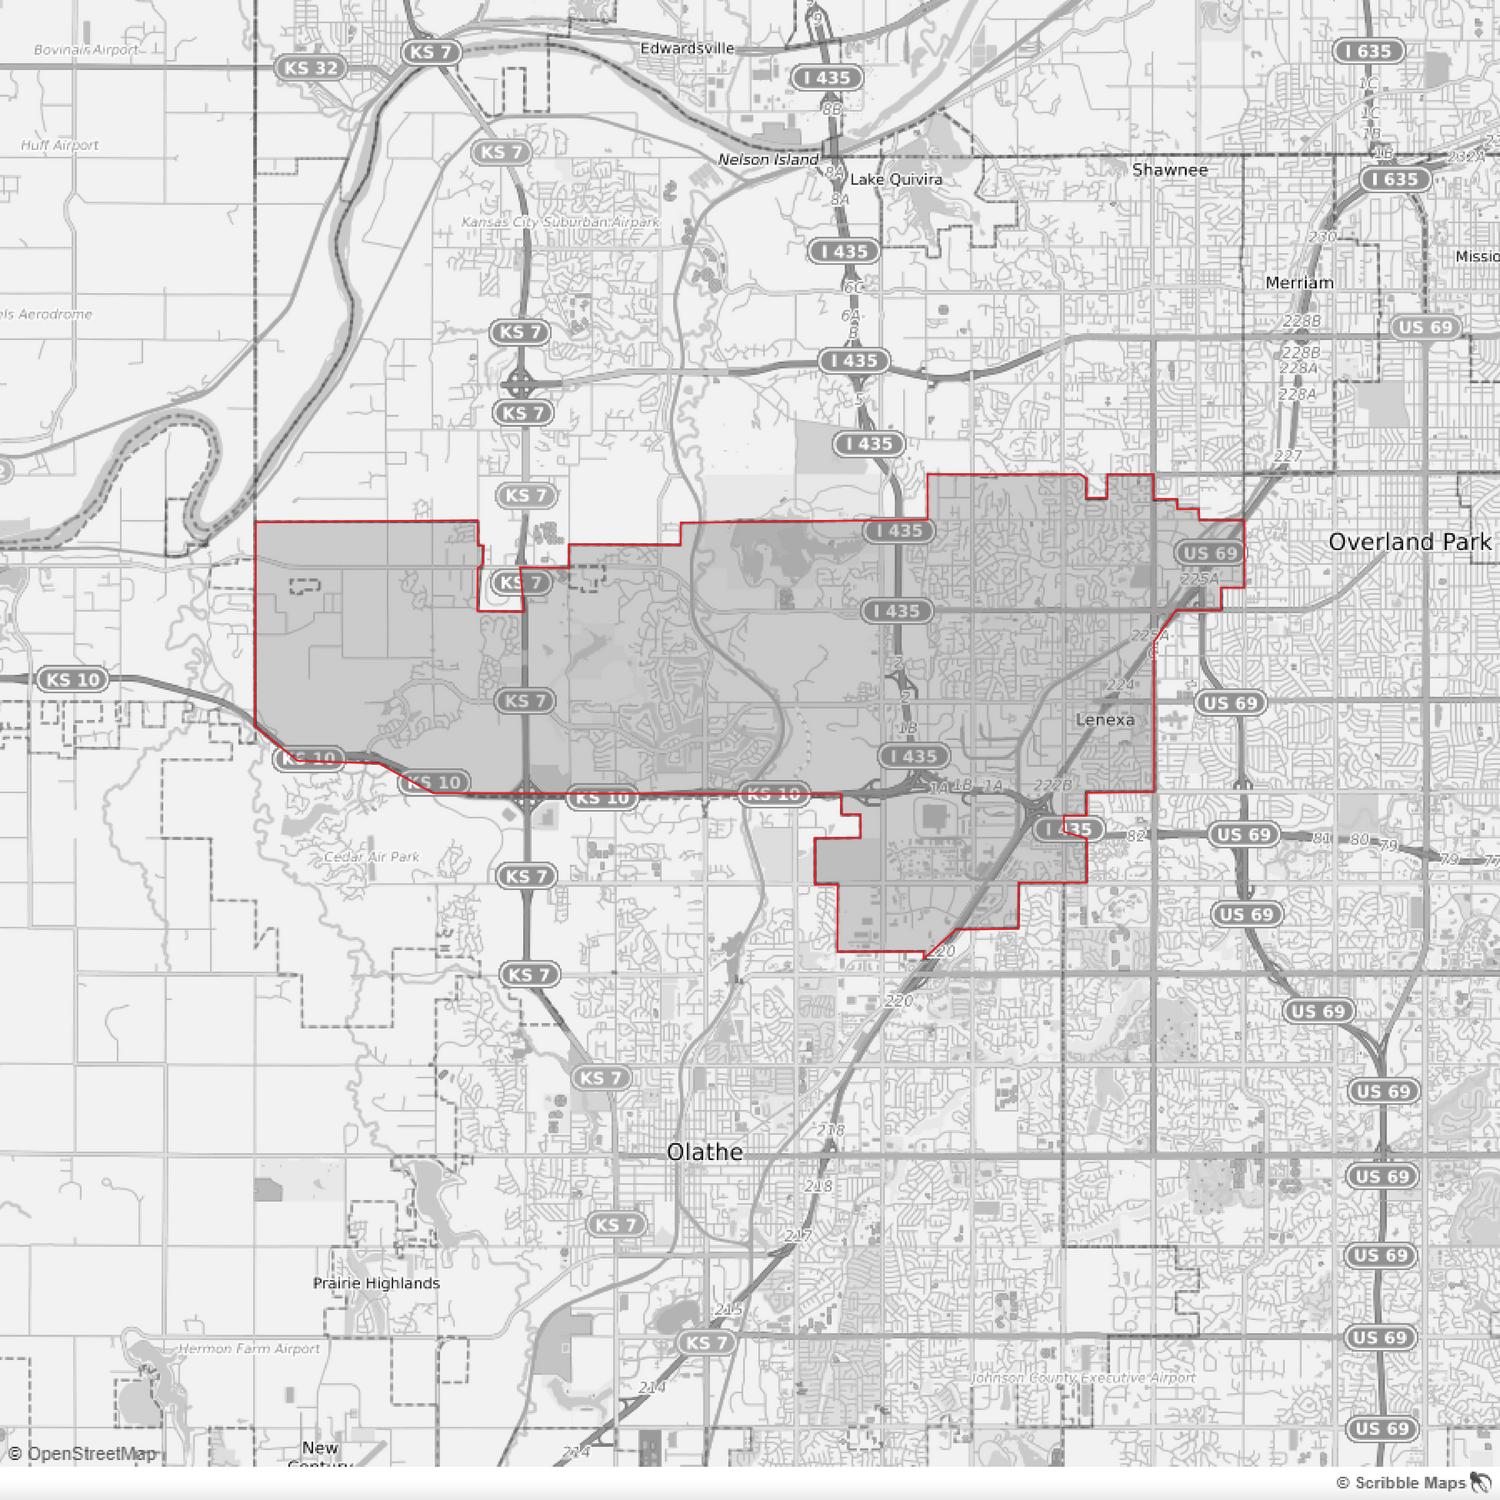
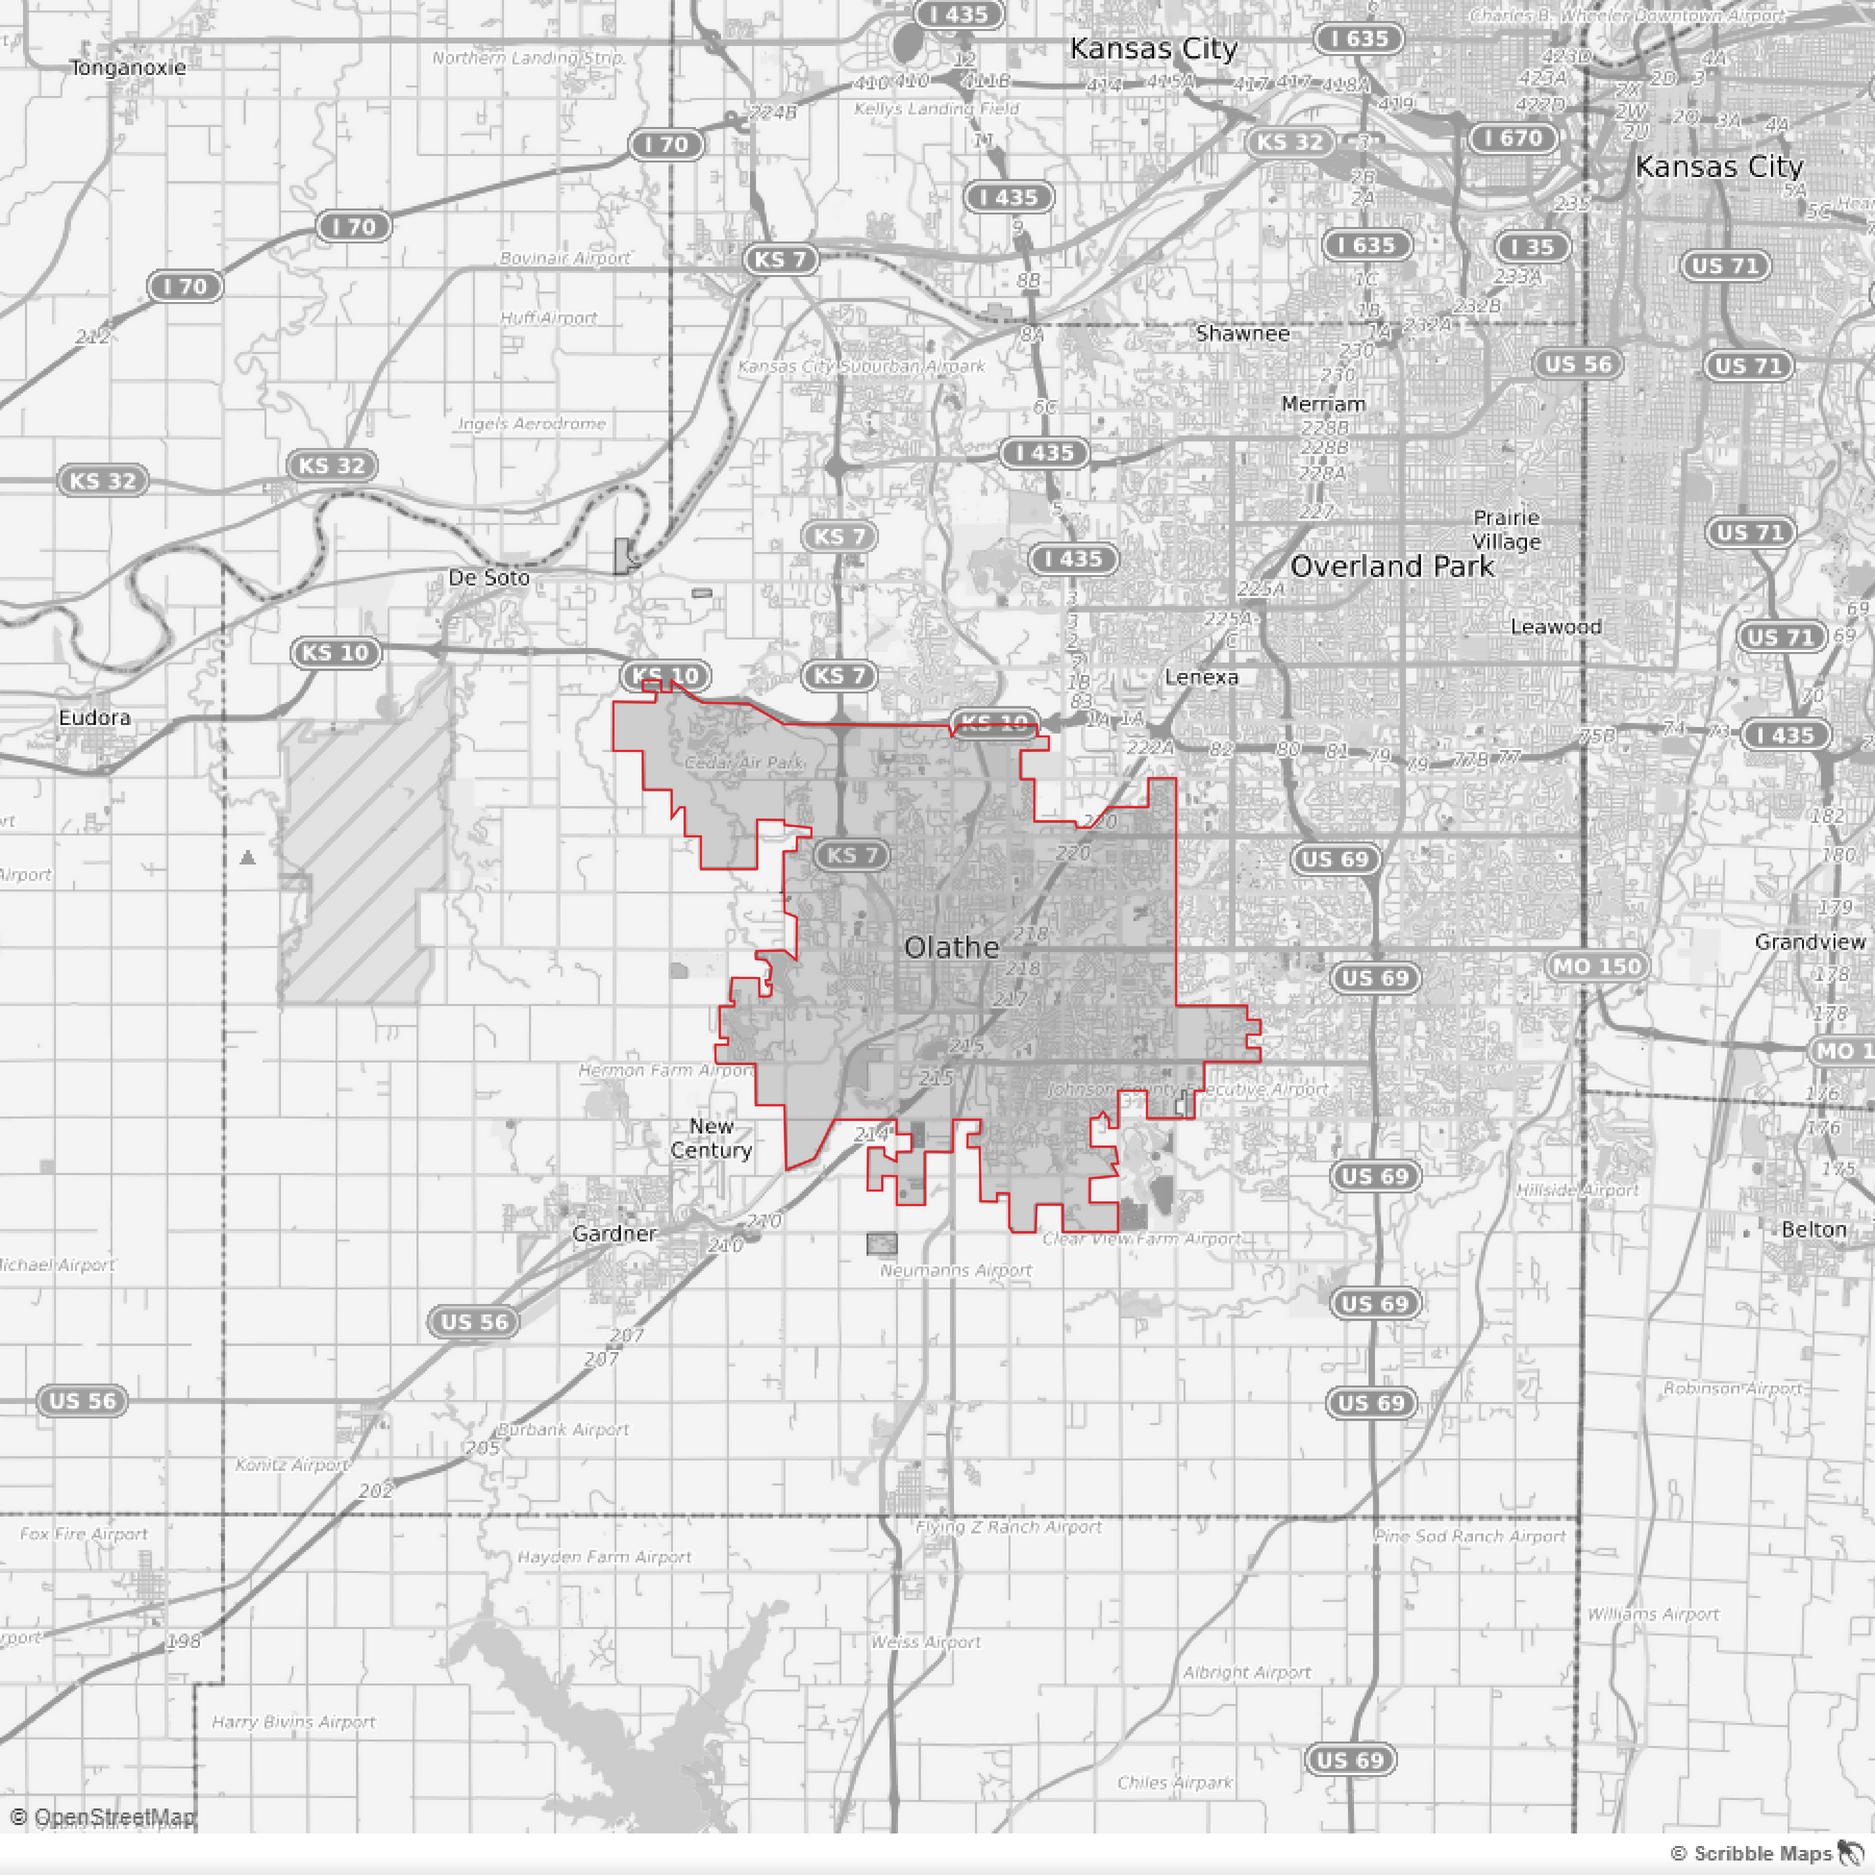
Olathe, Kansas
Olathe market trends for the first half of 2023 indicate an increase of 5% in average selling price, with the average topping out at $467,276. Olathe saw a 15% decrease in the number of contracted homes in the first half of 2023 compared to the first half of 2022. In addition, overall sales volume came in at $487 million, which is about 4% lower than the first half of 2022.
The three Olathe neighborhoods with the highest number of transactions were Cedar Creek, Stonebridge and Havencroft
The five highest priced home sales in Olathe for the first half of 2023 ranged from $3,000,000 to $1,571,075, with an average of $308 per square foot.
New construction sales volume decreased by about 2% to $147 million, with an average sales price of $656,135, up from $622,255 in the first half of 2022. The two residential home builders with the highest number of pulled permits for the first half of 2023 were SAB Homes and Prieb Homes
Olathe New Construction Sales Volume 2010 - 2022
'21Q2 '21Q3 '21Q4 '22Q1 '22Q2 '22Q3 '22Q4 '23Q1 '23Q2 1,000 750 500 250 0 '10 '11 '12 '13 '14 '15 '16 '17 '18 '19 '20 '21 '22 400,000,000 300,000,000 200,000,000 100,000,000 0 New Listings Contracted Sold Average Sale Price
6 8 1 7 8 1 5 9 8 7 4 2 7 7 3 8 8 9 4 1 3 5 1 7 6 7 5 4 9 1 3 5 3 4 7 4 6 4 2 5 3 2 4 9 9 3 8 2 6 6 0 5 9 0 6 2 1 5 7 5 4 2 7 9 2 5 9 5 8 7 4 1 8 6 1 7 0 5 8 0 9 $449,491 $383,801 $458,604 $446,574 $479,258 $394,470 $428,414 $454,396 $396,609
$103,894,566 $104,596,568 $132,004,574 $145,082,897 $143,184,048 $180,423,859 $185,629,393 $208,415,161 $210,204,666 $188,820,640 $275,895,132 $269,455,273 $311,037,637 14
Olathe Neighborhoods with Highest Number of Sales First Half 2023
#3 #1 #2
CEDAR CREEK 50 SOLD
AVG PRICE: $887,062
AVG SQ FT: 3,890
AVG PPSF: $228
STONEBRIDGE 47 SOLD
AVG PRICE: $608,161
AVG SQ FT: 2,786
AVG PPSF: $218
HAVENCROFT 27 SOLD
AVG PRICE: $331,519
AVG SQ FT: 2,080
AVG PPSF: $151
Top 5 Sales for Olathe First Half 2023
Rank 1 2 3 4 5 Address 27151 W 108th Street 27409 W 108th Street 11774 S Mesquite Street 14855 Parkhill Street 11786 S Mesquite Street Neighborhood Cedar Creek- The Reserve Cedar Creek- The Reserve Timberstone Ridge The Willows Timberstone Ridge Style 1 5 Stories 1 5 Stories 1.5 Stories 1 5 Stories Reverse SalesPrice $3,000,000 $2,850,000 $2,174,957 $1,739,932 $1,571,075 LotSize 1 03 Acres 1 55 Acres 1.15 Acres 0 6 Acre 0 89 Acre SqFootage 10,699 7,594 7,287 7,571 4,391 PPSF $280 $375 $298 $230 $358 3 2 1 5 4
15
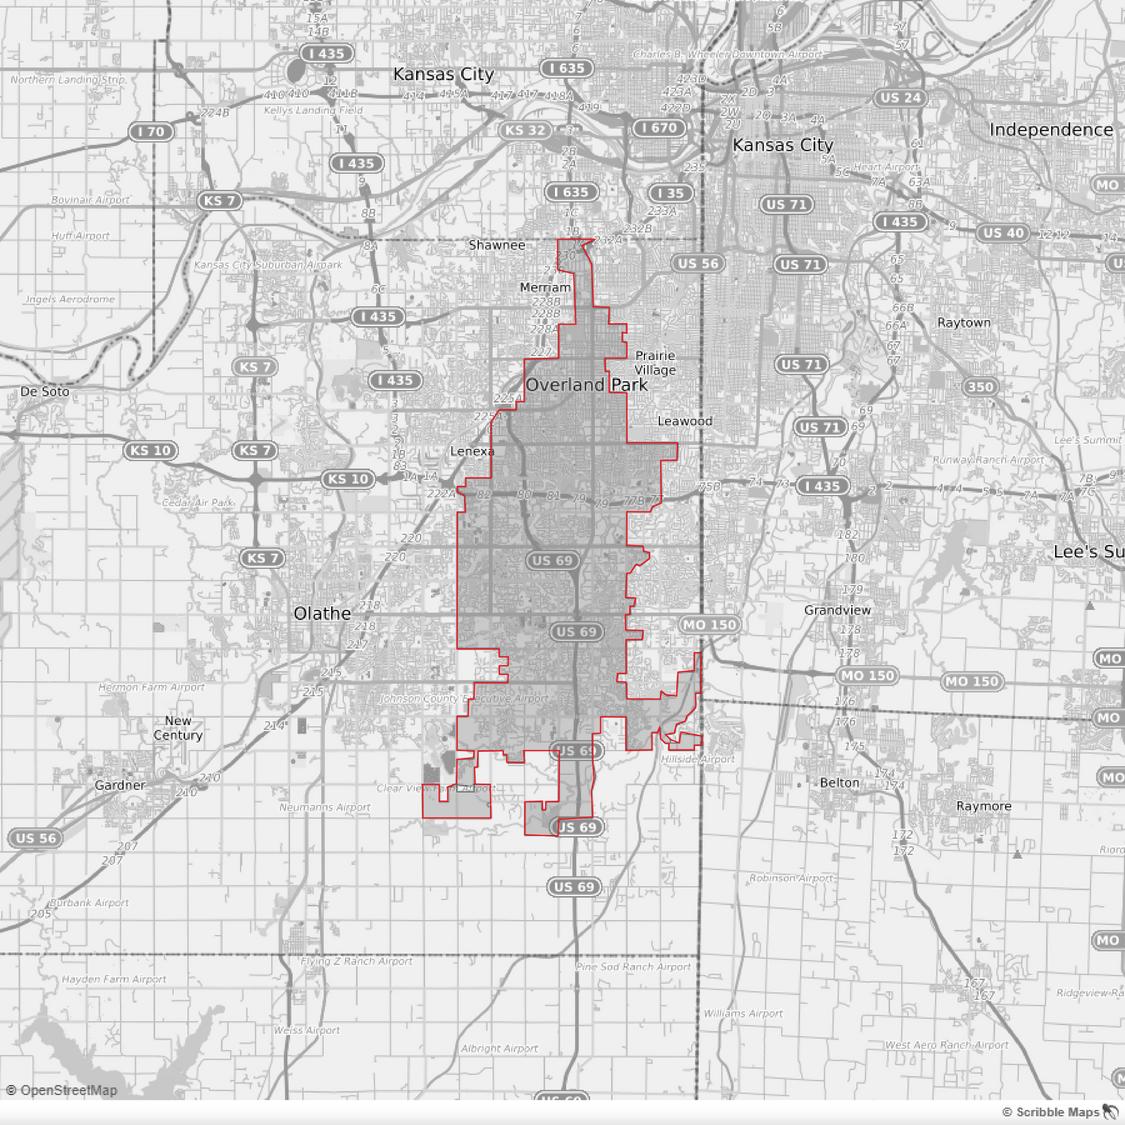
Overland Park, Kansas
Overland Park market trends for the first half of 2023 indicate an increase of 9% in average selling price, with the average topping out at $526,299. Overland Park saw a 21% decrease in the number of contracted homes in the first half of 2023 compared to the first half of 2022 In addition, overall sales volume came in at $643 million, which is about 17% lower than the first half of 2022
The three Overland Park neighborhoods with the highest number of transactions were Terrybrook Farms, Cherokee Hills and Nall Hills
The five highest priced home sales in Overland Park for the first half of 2023 ranged from $2,980,000 to $2,100,000, with an average of $309 per square foot.
New construction sales volume decreased by about 1% to $144 million, with an average sales price of $865,139, up from $717,009 in the first half of 2022 The two residential home builders with the highest number of pulled permits for the first half of 2023 were Summit Homes and Rodrock Homes
Overland Park New Construction Sales Volume 2010 - 2022
'21Q2 '21Q3 '21Q4 '22Q1 '22Q2 '22Q3 '22Q4 '23Q1 '23Q2 1,500 1,000 500 0 '10 '11 '12 '13 '14 '15 '16 '17 '18 '19 '20 '21 '22 400,000,000 300,000,000 200,000,000 100,000,000 0 New Listings Contracted Sold Average Sale Price
8 8 4 1 0 8 4 7 4 1 9 9 5 8 7 7 1 0 8 5 4 8 4 6 0 8 8 8 0 6 8 2 4 7 4 5 3 4 8 1 8 7 8 3 6 7 9 4 6 1 7 6 1 8 9 6 8 0 4 6 8 5 6 1 7 1 1 6 5 1 2 8 7 1 0 2 9 1 1 3 3 9 9 8 1 0 4 2 $504,353 $429,394 $530,232 $424,641 $515,232 $460,321 $533,003 $493,780 $456,475
$104,435,387 $98,180,027 $146,164,654 $163,613,711 $159,100,797 $183,870,258 $199,565,306 $243,166,002 $220,878,413 $215,957,429 $258,505,155 $230,445,770 $322,973,103 16
Overland Park Neighborhoods with Highest Number of Sales First Half 2023
TERRYBROOK FARMS 33 SOLD AVG PRICE: $990,348
3,762
CHEROKEE HILLS 25 SOLD AVG PRICE: $320,048
1,782
NALL HILLS 23 SOLD AVG PRICE: $384,546
1,920
Top 5 Sales for Overland Park First Half 2023
1 4 Rank 1 2 3 4 5 Address 8835 W 175th Street 16508 Bluejacket Street 10785 W 192nd Place 15521 Fontana Street 13720 Horton Drive Neighborhood Other The Farm at Garnet Hill Rockwood Falls Estates Mission Ranch The Links at Lionsgate Style 1 5 Stories 1 5 Stories 1 5 Stories 1 5 Stories 1.5 Stories SalesPrice $2,980,000 $2,860,000 $2,200,000 $2,120,872 $2,100,000 LotSize 12 06 Acres 1 01 Acres 2 08 Acres 0 58 Acre 0.46 Acre SqFootage 8,246 7,439 9,217 6,815 8,390 PPSF $361 $384 $239 $311 $250 5 2 3
SQ FT:
AVG PPSF:
AVG
$263
SQ FT:
AVG PPSF:
AVG
$180
AVG SQ FT:
AVG PPSF:
17 #3 #1 #2
$200
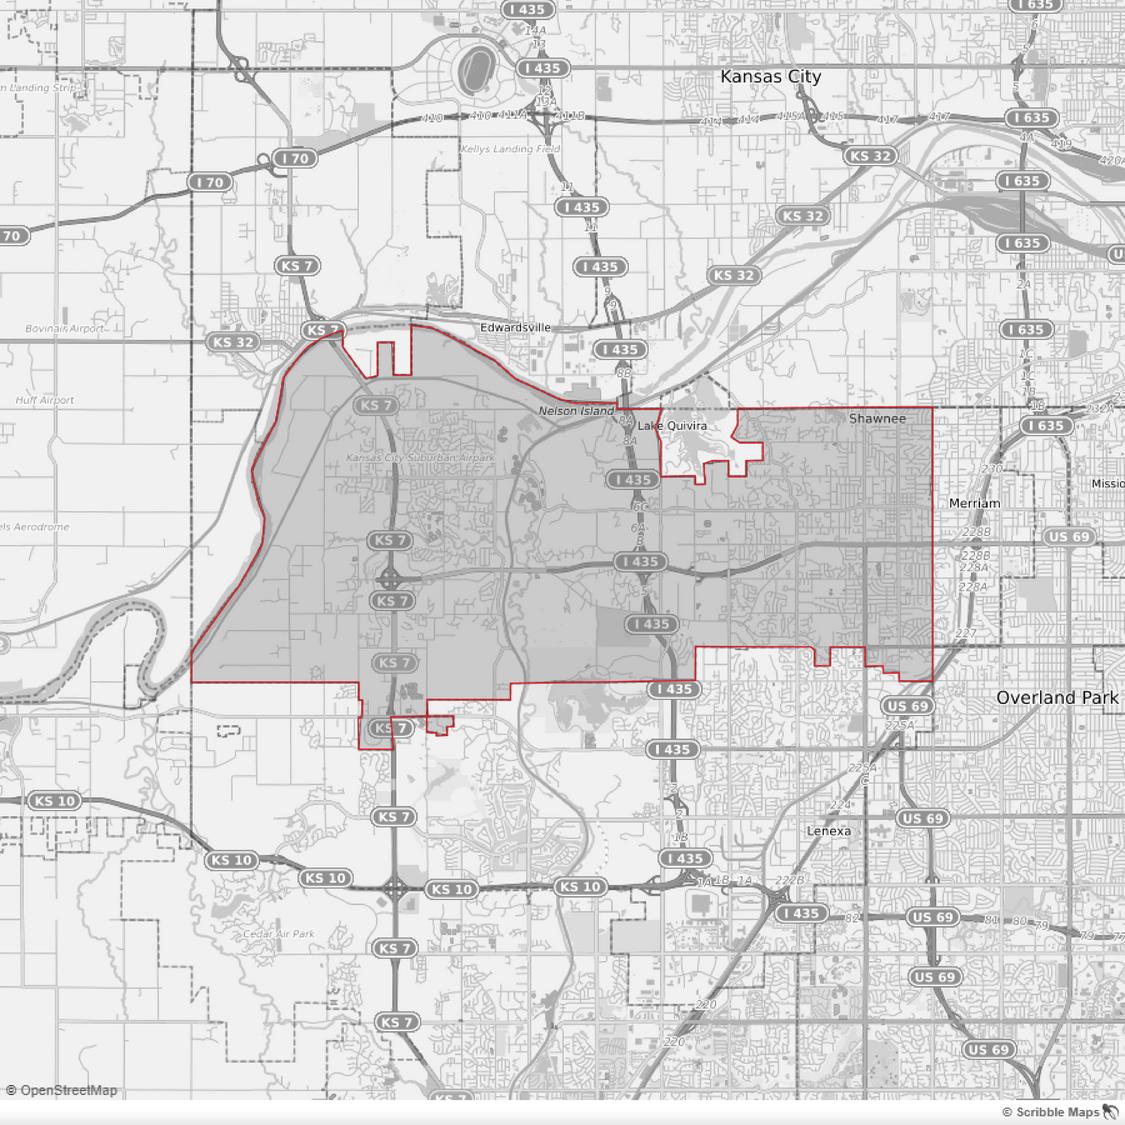
Shawnee, Kansas
Shawnee market trends for the first half of 2023 indicate an increase of 4% in average selling price, with the average topping out at $419,573 Shawnee saw a 27% decrease in the number of contracted homes in the first half of 2023 compared to the first half of 2022 In addition, overall sales volume came in at $172 million, which is about 19% lower than the first half of 2022
The three Shawnee neighborhoods with the highest number of transactions were Canyon Lakes, Greens of Chapel Creek and Deerfield Trace
The five highest priced home sales in Shawnee for the first half of 2023 ranged from $1,060,361 to $911,860, with an average of $237 per square foot
New construction sales volume increased by about 22% to $31 million, with an average sales price of $676,795, up from $609,050 in the first half of 2022 The two residential home builders with the highest number of pulled permits for the first half of 2023 were Arise Homes and Prieb Homes
Shawnee New Construction Sales Volume 2010 - 2022
'21Q2 '21Q3 '21Q4 '22Q1 '22Q2 '22Q3 '22Q4 '23Q1 '23Q2 500 400 300 200 100 0 '10 '11 '12 '13 '14 '15 '16 '17 '18 '19 '20 '21 '22 80,000,000 60,000,000 40,000,000 20,000,000 0 New Listings Contracted Sold Average Sale Price
2 9 5 3 6 1 2 4 2 3 2 7 3 1 6 3 9 8 1 7 2 2 0 5 2 8 4 2 2 9 1 7 3 1 7 7 2 6 4 2 3 6 1 9 9 1 5 3 2 5 6 3 0 6 2 6 5 2 4 1 1 7 5 3 9 5 4 2 3 3 6 6 4 0 1 3 4 5 3 5 0 $405,135 $352,347 $381,689 $376,141 $402,550 $369,820 $429,747 $422,481 $363,479
$19,639,601 $14,445,714 $30,425,779 $45,633,812 $44,167,989 $45,221,430 $55,617,716 $50,286,727 $53,626,794 $52,765,077 $59,495,546 $52,865,395 $76,643,326 18
Shawnee Neighborhoods with Highest Number of Sales First Half 2023
CANYON LAKES 15 SOLD
AVG PRICE: $653,899
AVG SQ FT: 3,030
AVG PPSF: $216
GREENS OF CHAPEL CREEK 13 SOLD
AVG PRICE: $599,799
AVG SQ FT: 2,880
AVG PPSF: $208
DEERFIELD TRACE 12 SOLD
AVG PRICE: $399,500
AVG SQ FT: 2,496
AVG PPSF: $160
Top 5 Sales for Shawnee First Half 2023
2 Rank 1 2 3 4 5 Address 23815 W 59th Terrace 7211 Gillette Street 7221 Richards Drive 7665 Chouteau Street 7254 Richards Drive Neighborhood Canyon Lakes Kenneth Estates Kenneth Estates Other Kenneth Estates Style 1 5 Stories Reverse Reverse 1 5 Stories 2 Stories SalesPrice $1,060,361 $1,039,000 $963,250 $915,000 $911,860 LotSize 0 29 Acre 0 29 Acre 0 24 Acree 6 25 Acres 0.42 Acre SqFootage 4,298 3,766 3,650 5,418 3,993 PPSF $247 $276 $264 $169 $228 1 3 4 5
19
#3 #1 #2
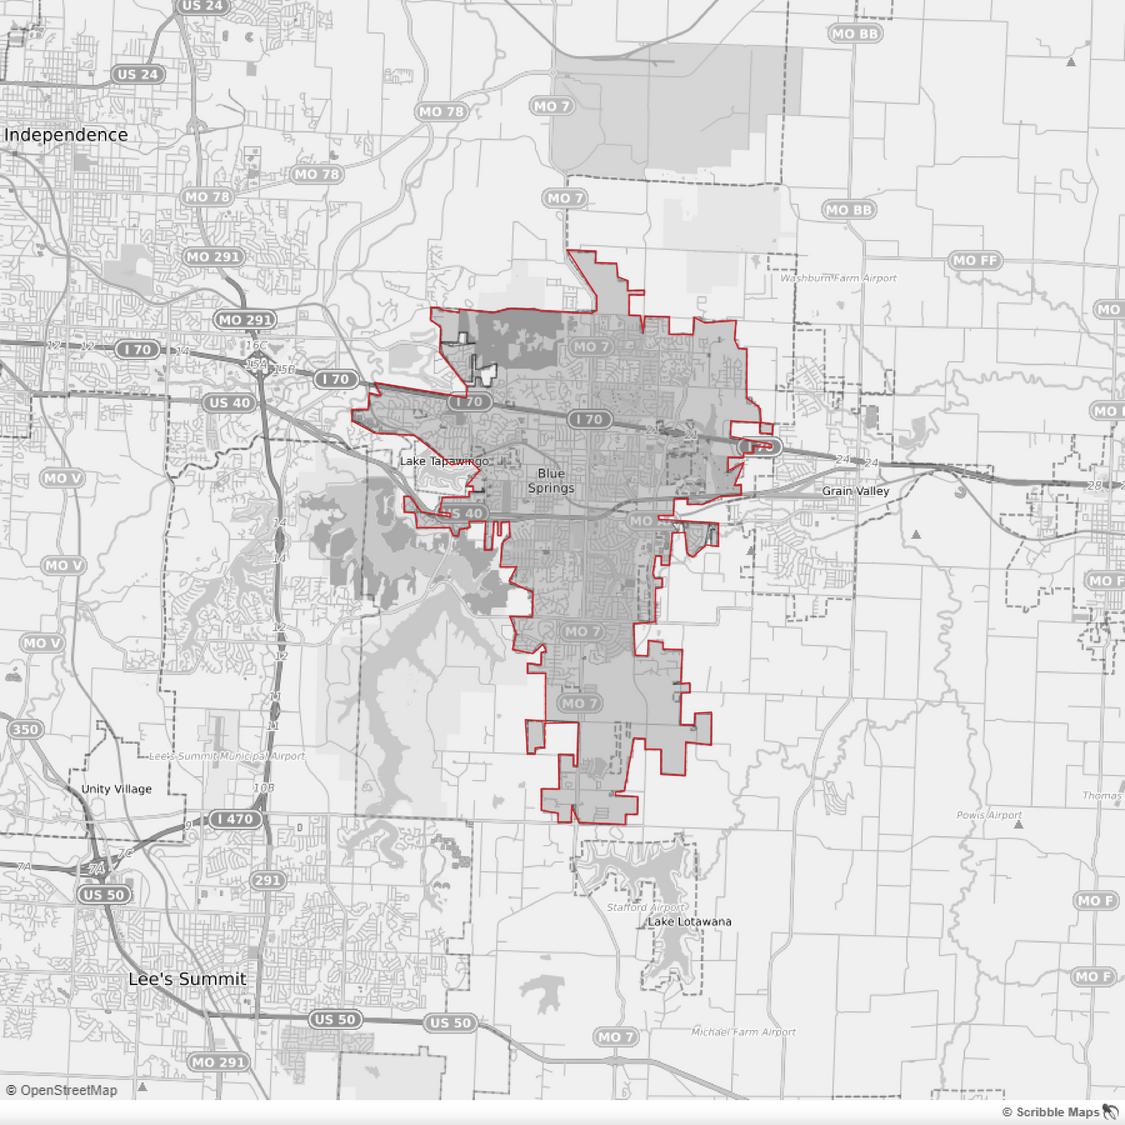
Blue Springs, Missouri
Blue Springs market trends for the first half of 2023 indicate an increase of 3% in average selling price, with the average topping out at $323,452 Blue Springs saw a 6% decrease in the number of contracted homes in the first half of 2023 compared to the first half of 2022. In addition, overall sales volume came in at $135 million, which is about 13% lower than the first half of 2022.
The three Blue Springs neighborhoods with the highest number of transactions were Parkway Estates, Kingsridge and Cambridge Park.
The five highest priced home sales in Blue Springs for the first half of 2023 ranged from $1,072,500 to $636,000, with an average of $191 per square foot
New construction sales volume decreased by about 7% to $28.7 million, with an average sales price of $428,349, up from $408,082 in the first half of 2022. The two residential home builders with the highest number of pulled permits for the first half of 2023 were Rausch Coleman Homes and Ashlar Homes.
Blue Springs New Construction Sales Volume 2010 - 2022
'21Q2 '21Q3 '21Q4 '22Q1 '22Q2 '22Q3 '22Q4 '23Q1 '23Q2 500 400 300 200 100 0 '10 '11 '12 '13 '14 '15 '16 '17 '18 '19 '20 '21 '22 75,000,000 50,000,000 25,000,000 0
2 1 6 2 1 3 2 0 2 3 5 6 4 1 3 2 9 9 3 8 6 2 9 1 3 4 9 3 1 8 3 9 7 2 5 2 3 6 8 2 9 1 3 8 9 1 9 1 2 1 4 2 8 4 2 3 5 1 7 1 2 0 0 2 7 7 2 4 3 1 9 2 1 7 4 2 4 3 2 9 9 $303,134 $322,184 $293,763 $316,664 $290,387 $319,039 $311,517 $331,999 $296,010
$5,197,260 $7,946,807 $12,663,106 $14,073,416 $18,404,866 $29,317,117 $41,702,806 $36,603,229 $45,839,314 $39,236,376 $64,855,408 $72,674,199 $50,453,745 20 New Listings Contracted Sold Average Sale Price
Blue Springs Neighborhoods with Highest Number of Sales First Half 2023
#2
PARKWAY ESTATES 21 SOLD
AVG PRICE: $400,164
AVG SQ FT: 2,344
PPSF: $171
KINGSRIDGE 20 SOLD
AVG PRICE: $242,220
1,577
$154
CAMBRIDGE PARK 17 SOLD AVG PRICE: $328,121
Top 5 Sales for Blue Springs First Half 2023
#3 #1 Rank 1 2 3 4 5 Address 29404 SE Moreland School Road 4709 Claude Court 905 SE Larue Street 4208 SE Willow Ridge Drive 2908 SW Shrout Creek Drive Neighborhood Moreland Hills Hoot Owl Ridge Hoot Owl Ridge Willow Tree Stonecreek Style Reverse Reverse Reverse 1 5 Stories 1.5 Stories SalesPrice $1,072,500 $692,000 $664,000 $655,000 $636,000 LotSize 3 75 Acres 0 37 Acre 0 25 Acre 1 62 Acres 0.41 Acre SqFootage 4,270 3,168 3,087 4,399 5,226 PPSF $251 $218 $215 $149 $122 5 3 4 2 1
AVG
AVG PPSF:
AVG SQ FT:
AVG SQ FT:
AVG PPSF:
1,728
$190
21
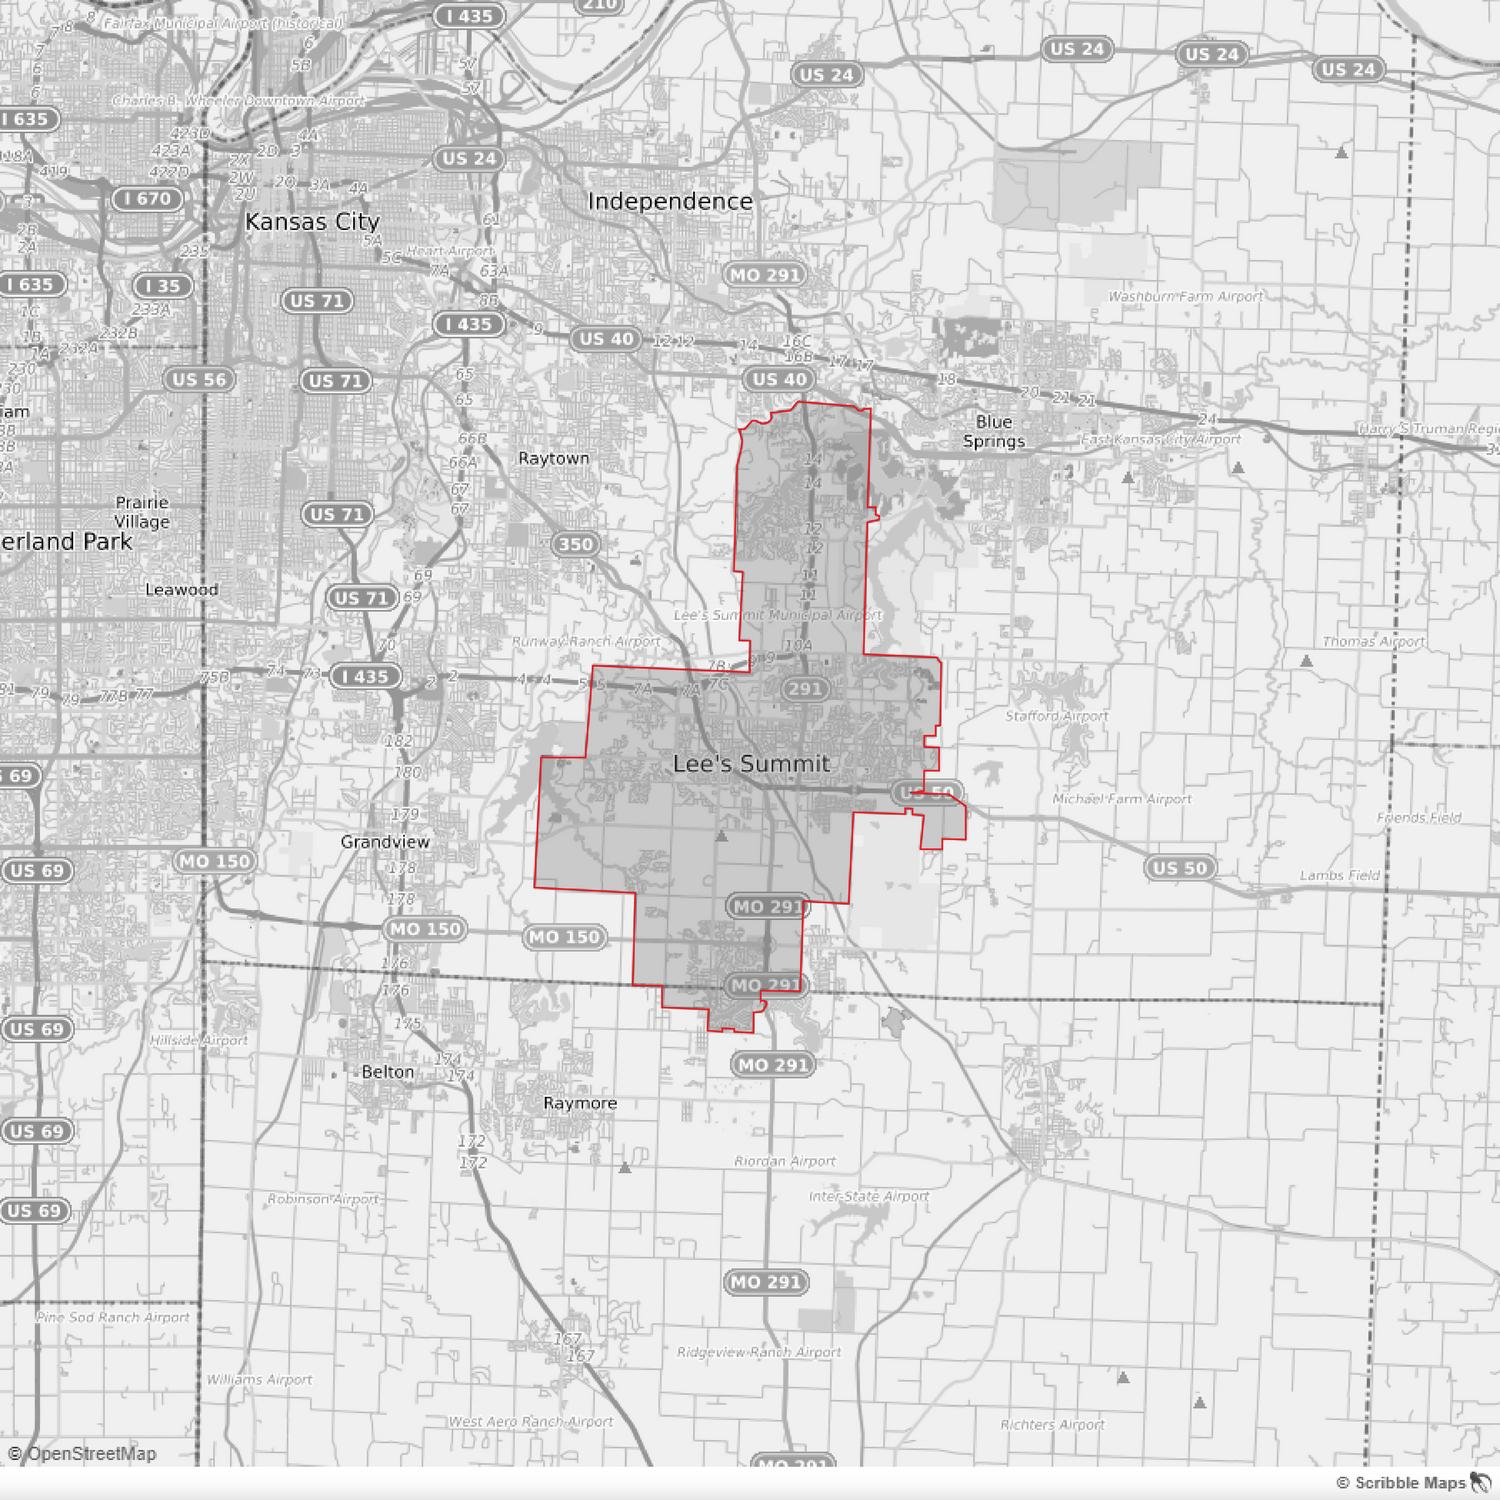
Lee's Summit, Missouri
Lee's Summit market trends for the first half of 2023 indicate an increase of 3% in average selling price, with the average topping out at $427,490. Lee's Summit saw a 12% decrease in the number of contracted homes in the first half of 2023 compared to the first half of 2022. In addition, overall sales volume came in at $350 million, which is about 18% lower than the first half of 2022
The three Lee's Summit neighborhoods with the highest number of transactions were Raintree, Lakewood and Eagle Creek
The five highest priced home sales in Lee's Summit for the first half of 2023 ranged from $1,334,582 to $1,100,000, with an average of $244 per square foot.
New construction sales volume decreased by about 4% to $102 million, with an average sales price of $582,195, up from $531,269 in the first half of 2022 The two residential home builders with the highest number of pulled permits for the first half of 2023 were Summit Homes and Walker Custom Homes
Lee's Summit New Construction Sales Volume 2010 - 2022
'21 Q2 '21 Q3 '21 Q4 '22 Q1 '22 Q2 '22 Q3 '22 Q4 '23 Q1 '23 Q2 800 600 400 200 0 '10 '11 '12 '13 '14 '15 '16 '17 '18 '19 '20 '21 '22 250,000,000 200,000,000 150,000,000 100,000,000 50,000,000 0
5 1 6 4 5 1 4 0 3 7 9 3 7 4 9 6 3 3 6 7 4 6 1 5 6 1 8 7 0 5 7 0 9 5 4 6 6 0 4 6 5 0 6 8 3 3 3 9 4 3 6 5 8 6 4 7 7 3 0 4 4 0 7 5 3 4 4 7 5 4 2 2 3 1 2 5 0 6 5 3 8 $407,775 $421,814 $360,905 $407,293 $372,130 $402,788 $409,611 $438,514 $378,037
$39,763,181 $37,073,181 $60,713,830 $83,225,713 $86,324,569 $101,134,936 $103,744,917 $115,379,946 $130,371,756 $130,307,795 $184,464,737 $176,080,609 $216,331,444 22 New Listings Contracted Sold Average Sale Price
Lee's Summit Neighborhoods with Highest Number of Sales First Half 2023
#3
RAINTREE 37 SOLD
AVG PRICE: $450,326
AVG SQ FT: 3,023
AVG PPSF: $149
LAKEWOOD 35 SOLD
AVG PRICE: $509,866
AVG SQ FT: 3,605
AVG PPSF: $141
EAGLE CREEK 21 SOLD
AVG PRICE: $455,912
AVG SQ FT: 2,674
AVG PPSF: $170
Top 5 Sales for Lee's Summit First Half 2023
Rank 1 2 3 4 5 Address 106 NW Ambersham Drive 2151 NW Killarney Lane 320 NE Dartmore Court 2125 NW O'Brien Road 904 SW Trailridge Drive Neighborhood Woodside Ridge Woodside Ridge East Lake Village Woodside Ridge Summit Falls Style 1 5 Stories 1 5 Stories 1 5 Stories Reverse 1.5 Stories SalesPrice $1,334,582 $1,216,621 $1,200,000 $1,157,068 $1,100,000 LotSize 0 32 Acre 0 37 Acre 0 39 Acre 0 53 Acre 1.01 Acres SqFootage 4,753 3,415 7,520 4,000 8,277 PPSF $281 $356 $160 $289 $133 3 1 4 2 5
23
#1 #2
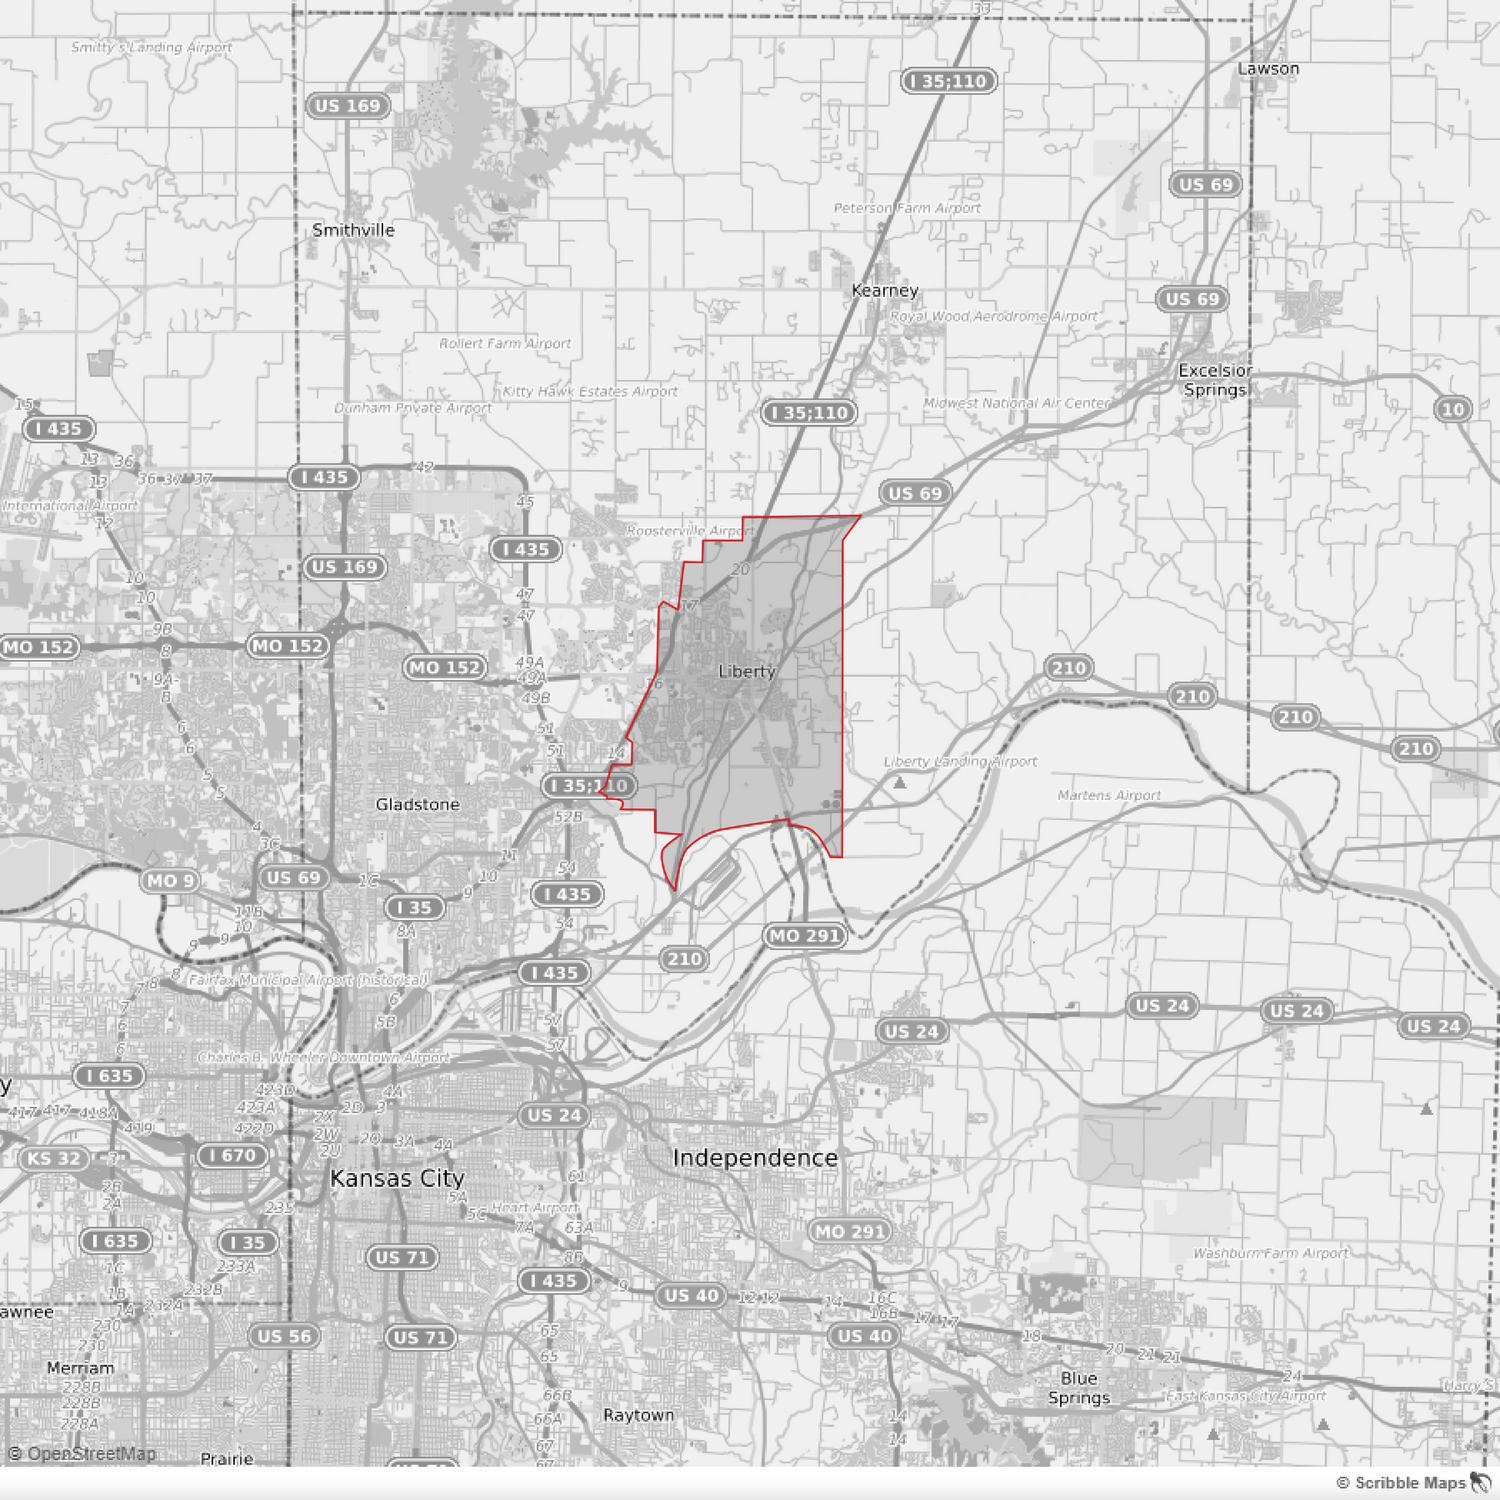
Liberty, Missouri
Liberty market trends for the first half of 2023 indicate an increase of 6% in average selling price, with the average topping out at $354,503 Liberty saw a 12% decrease in the number of contracted homes in the first half of 2023 compared to the first half of 2022. In addition, overall sales volume came in at $73 million, which is about 17% lower than the first half of 2022.
The three Liberty neighborhoods with the highest number of transactions were Clay Meadows, Canterbury and Claywoods.
The five highest priced home sales in Liberty for the first half of 2023 ranged from $1,540,000 to $775,514, with an average of $181 per square foot
New construction sales volume decreased by about 36% to $6.9 million, with an average sales price of $490,589, up from $470,230 in the first half of 2022. The two residential home builders with the highest number of pulled permits for the first half of 2023 were South Withers Development and Robertson Construction.
Liberty New Construction Sales Volume 2010 - 2022
'21Q2 '21Q3 '21Q4 '22Q1 '22Q2 '22Q3 '22Q4 '23Q1 '23Q2 250 200 150 100 50 0 '10 '11 '12 '13 '14 '15 '16 '17 '18 '19 '20 '21 '22 25,000,000 20,000,000 15,000,000 10,000,000 5,000,000 0
1 6 0 2 0 4 1 5 1 1 9 7 1 5 6 2 1 1 7 2 1 2 8 1 5 5 1 1 8 8 3 1 1 3 1 3 0 1 1 9 1 0 5 9 0 1 1 6 1 4 9 1 4 0 1 2 6 1 0 0 1 9 4 2 2 2 1 5 2 1 9 1 1 6 3 1 6 3 $345,426 $323,759 $365,344 $360,412 $349,919 $329,163 $315,382 $346,747 $300,636 $2,447,340 $2,964,868 $5,793,317 $10,069,285 $7,186,582 $8,665,294 $5,884,458 $10,149,449 $13,617,330 $15,610,393 $17,184,474
$21,369,346 $18,349,496 24 New Listings Contracted Sold Average Sale Price
Liberty Neighborhoods with Highest Number of Sales First Half 2023
CLAY MEADOWS 18 SOLD AVG PRICE: $390,361
CANTERBURY 15 SOLD
CLAYWOODS 12 SOLD
Top 5 Sales for Liberty First Half 2023
4 Rank 1 2 3 4 5 Address 1700 Richfield Road 715 Westwoods Drive 1200 Linden Road 1583 Woodbine Court 1489 Hemlock Court Neighborhood Other Newton Ridge Timber Ridge Hills of Oakwood Holly Lake Estates Style 1 5 Stories 1 5 Stories Reverse 2 Stories 1 5 Stories SalesPrice $1,540,000 $965,000 $882,740 $795,000 $775,514 LotSize 22 01 Acres 0 63 Acre 1 31 Acres 0 74 Acres 1.2 Acres SqFootage 5,545 8,726 3,439 5,577 6,517 PPSF $278 $111 $257 $143 $119 3 2 1 5
AVG SQ FT:
AVG PPSF:
2,478
$158
AVG SQ FT:
AVG PPSF:
AVG PRICE: $319,183
2,112
$151
AVG PRICE:
AVG SQ FT:
AVG PPSF: $116 25 #3 #1 #2
$371,250
3,190
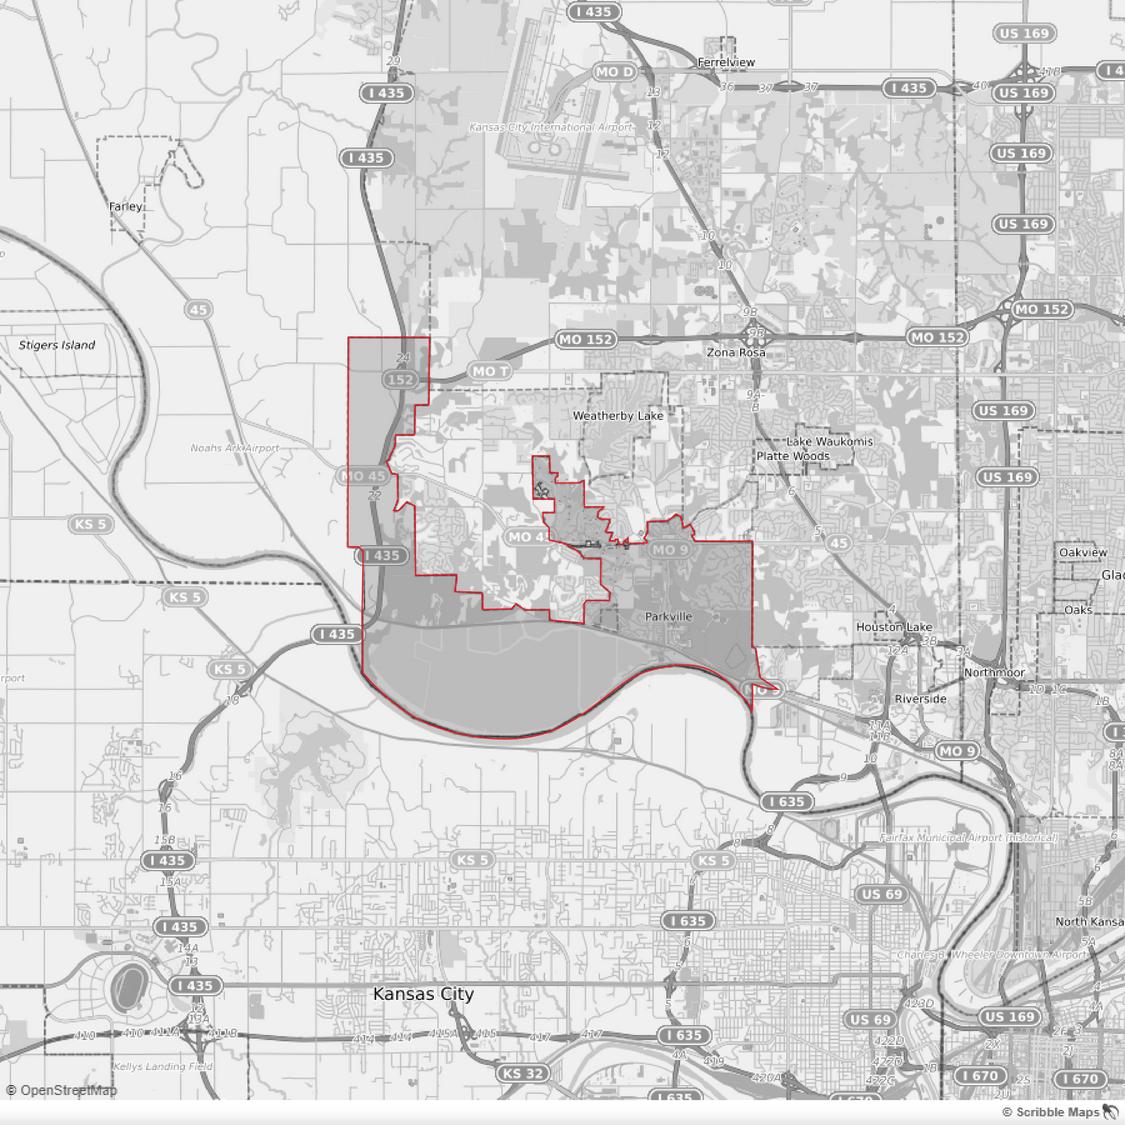
Parkville, Missouri
Parkville market trends for the first half of 2023 indicate an increase of 3% in average selling price, with the average topping out at $535,096. Parkville saw a 29% decrease in the number of contracted homes in the first half of 2023 compared to the first half of 2022. In addition, overall sales volume came in at $95 million, which is about 22% lower than the first half of 2022.
The three Parkville neighborhoods with the highest number of transactions were Thousand Oaks, Creekside Village and Riss Lake
The five highest priced home sales in Parkville for the first half of 2023 ranged from $2,800,000 to $1,230,000, with an average of $274 per square foot.
New construction sales volume decreased by about 15% to $34.3 million, with an average sales price of $512,107, up from $492,124 in the first half of 2022.
Parkville New Construction Sales Volume 2010 - 2022
'21Q2 '21Q3 '21Q4 '22Q1 '22Q2 '22Q3 '22Q4 '23Q1 '23Q2 200 150 100 50 0 '10 '11 '12 '13 '14 '15 '16 '17 '18 '19 '20 '21 '22 75,000,000 50,000,000 25,000,000 0
1 1 0 1 2 5 1 0 7 1 3 3 1 2 2 1 4 1 7 2 7 2 1 2 2 7 5 5 4 7 3 1 0 5 8 5 8 6 7 5 1 0 2 1 1 5 1 2 5 1 3 0 9 0 1 5 3 1 3 3 1 6 1 1 1 5 1 4 3 1 0 9 $460,868 $457,705 $486,515 $489,912 $568,320 $404,452 $530,774 $512,839 $456,903
$12,059,452 $14,110,672 $12,726,945 $23,319,760 $38,392,022 $26,868,929 $38,041,193 $45,065,002 $44,705,8396 $51,951,766 $69,662,717 $69,991,042 $59,994,239 26 New Listings Contracted Sold Average Sale Price
Parkville Neighborhoods with Highest Number of Sales First Half 2023
THOUSAND OAKS 41 SOLD
AVG PRICE: $650,297
AVG SQ FT: 3,570 AVG PPSF: $182
CREEKSIDE VILLAGE 31 SOLD
AVG PRICE: $285,858
AVG SQ FT: 1,627 AVG PPSF: $176
RISS LAKE 15 SOLD
AVG PRICE: $654,063
3,800
Top 5 Sales for Parkville First Half 2023
4 3 2 Rank 1 2 3 4 5 Address 6995 N National Drive 6446 N National Drive 6420 Bunker Hill 7415 NW Fawn Avenue 7067 NW Scenic Drive Neighborhood The National The National The National Estates at Chapel Hill Stone Gate Style 1 5 Stories Reverse Reverse 1 5 Stories 1.5 Stories SalesPrice $2,800,000 $1,675,000 $1,300,000 $1,263,675 $1,230,000 LotSize 0 62 Acre 0 58 Acre 0 32 Acre 1 37 Acres 1.27 Acres SqFootage 7,690 6,770 5,871 3,899 5,800 PPSF $364 $247 $221 $324 $212 5 1
27 #3 #1 #2
AVG SQ FT:
AVG PPSF: $172
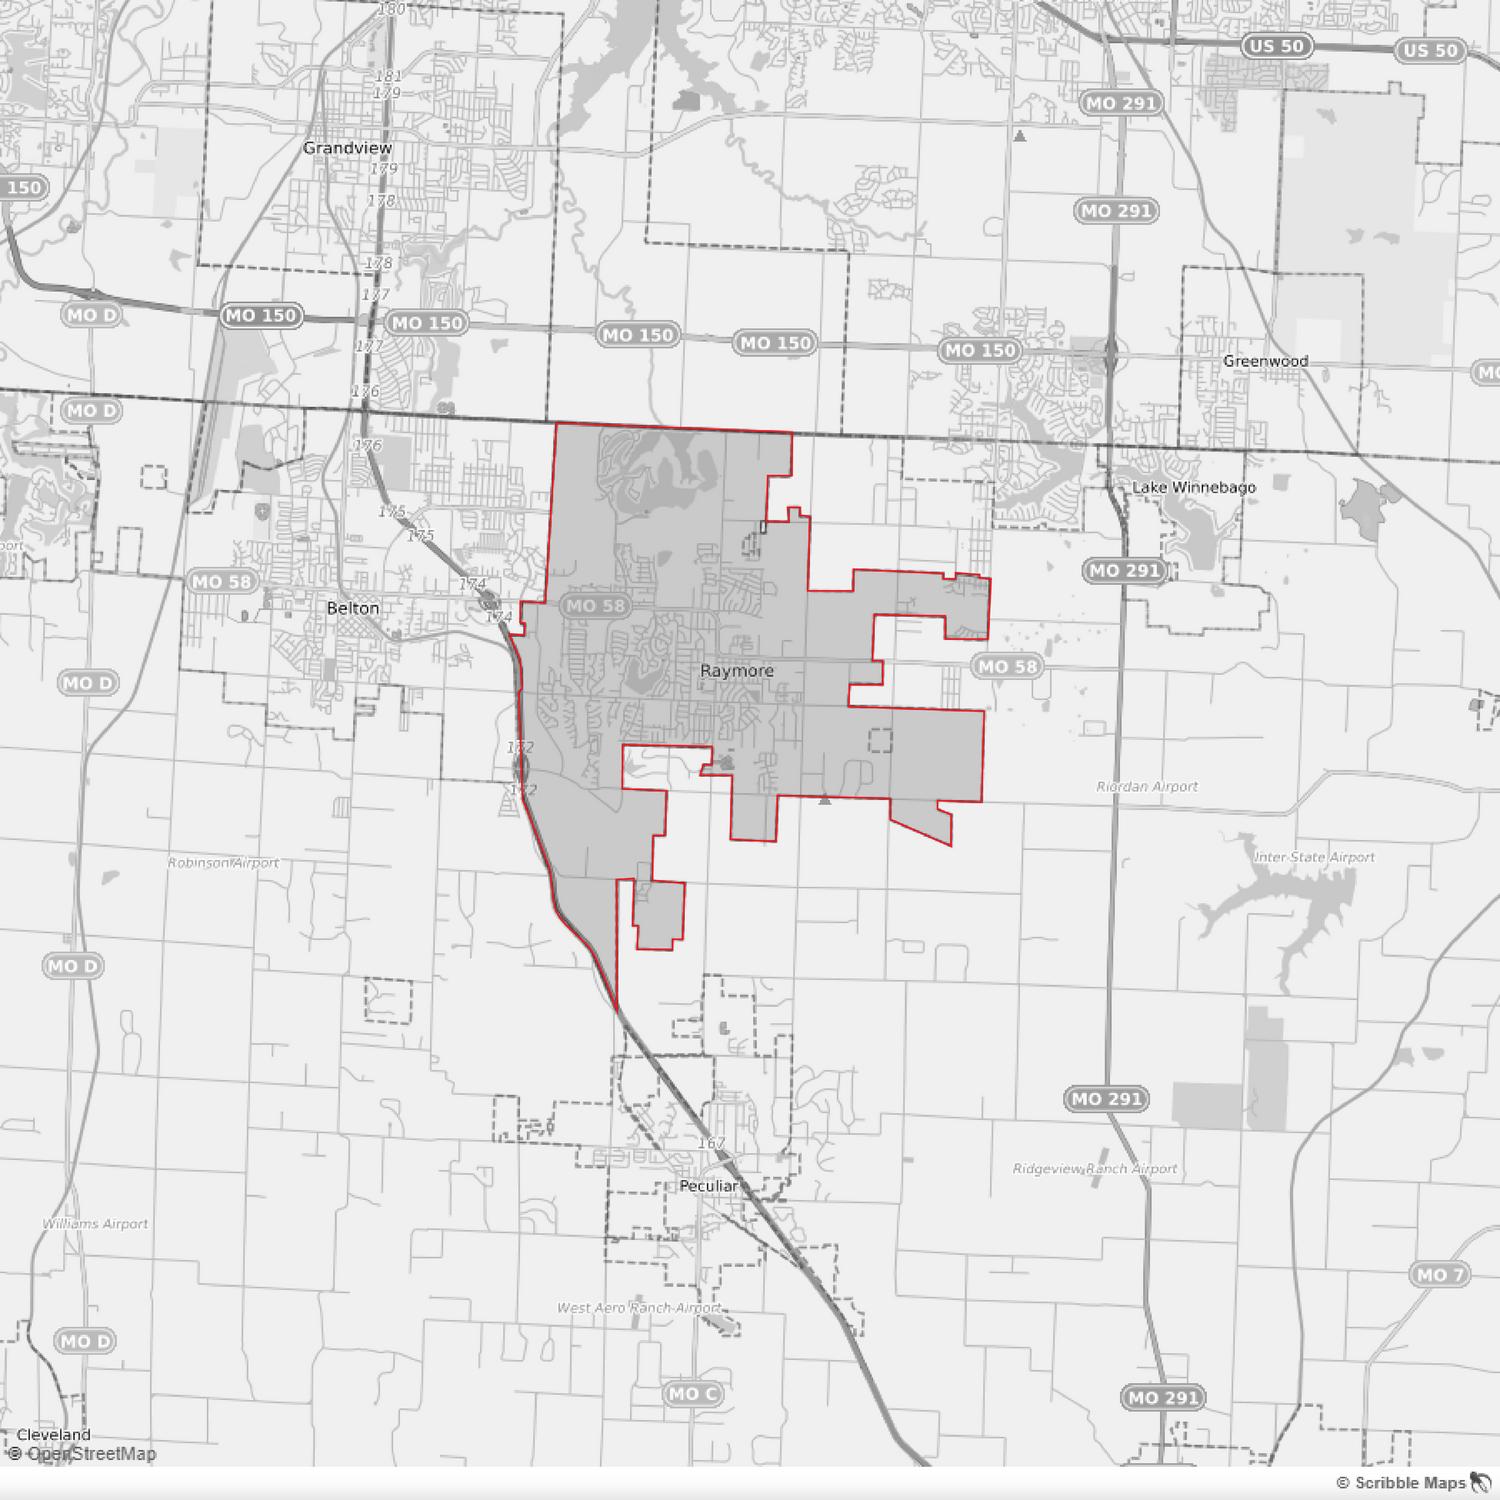
Raymore, Missouri
Raymore market trends for the first half of 2023 indicate an increase of 6% in average selling price, with the average topping out at $382,090 Raymore saw a 30% decrease in the number of contracted homes in the first half of 2023 compared to the first half of 2022. In addition, overall sales volume came in at $65 million, which is about 31% lower than the first half of 2022.
The three Raymore neighborhoods with the highest number of transactions were Creekmoor, Brookside and Foxhaven.
The five highest priced home sales in Raymore for the first half of 2023 ranged from $987,500 to $799,900, with an average of $231 per square foot
New construction sales volume decreased by about 41% to $15.6 million, with an average sales price of $537,347, up from $459,254 in the first half of 2022. The two residential home builders with the highest number of pulled permits for the first half of 2023 were Sway Development and Summit Homes.
Raymore New Construction Sales Volume 2010 - 2022
'21Q2 '21Q3 '21Q4 '22Q1 '22Q2 '22Q3 '22Q4 '23Q1 '23Q2 200 150 100 50 0 '10 '11 '12 '13 '14 '15 '16 '17 '18 '19 '20 '21 '22 60,000,000 40,000,000 20,000,000 0
1 5 1 1 6 6 1 2 3 1 4 3 1 3 2 1 6 9 6 5 8 3 1 3 0 1 2 7 7 2 7 3 1 0 8 1 3 4 9 7 6 7 1 0 4 1 4 3 1 0 4 9 8 1 0 9 1 9 8 1 8 4 1 6 1 1 8 4 1 5 2 1 7 4 $327,964 $359,663 $400,264 $370,382 $380,087 $352,916 $366,505 $375,025 $344,892
$13,990,594 $12,293,929 $15,265,321 $19,323,890 $22,955,560 $29,023,581 $32,836,572 $58,564,608 $53,527,971 $45,094,629 $43,199,703 $45,825,392 $40,642,705 28 New Listings Contracted Sold Average Sale Price
Raymore Neighborhoods with Highest Number of Sales First Half 2023
CREEKMOOR 32 SOLD
AVG PRICE: $552,444
AVG SQ FT: 2,911 AVG PPSF: $190
BROOKSIDE 9 SOLD
AVG PRICE: $306,378
AVG SQ FT: 1,865 AVG PPSF: $164
FOXHAVEN 8 SOLD
AVG PRICE: $285,925 AVG SQ FT: 1,870 AVG PPSF: $153
Top 5 Sales for Raymore First Half 2023
3
2 1 4 5
29
#3 #1 #2
A Recap of our KC Spring Parade of Homes Gold Winners
ASHLAR HOMES
Pick of the Parade
BICKIMER HOMES
Pick of the Parade & Distinctive Design
BRYANT RATLIFF BUILDERS
Distinctive Design
C&M BUILDERS
Pick of the Parade
DCB HOMES
Pick of the Parade
DON JULIAN BUILDERS
Pick of the Parade (3) & Distinctive Design (4)
DREAMS & DESIGN BUILDING
Pick of the Parade (2)
DREES BUILT HOMES
Distinctive Design
DUSTY RHODES HOMES
Pick of the Parade (2) & Distinctive Design (2)
ELEVATE DESIGN + BUILD
Pick of the Parade (2)
GARY KERNS HOMEBUILDERS
Pick of the Parade & Distinctive Design
GIANNI CUSTOM HOMES
Pick of the Parade
HELM CONSTRUCTION
Pick of the Parade & Distinctive Design
INSPIRED HOMES
Pick of the Parade
J S ROBINSON FINE HOMES
Pick of the Parade (2) & Distinctive Design (2)
JFE CONSTRUCTION
Pick of the Parade
LAMBIE HOMES
Distinctive Design
LEGACY HOMES OF KC
Pick of the Parade
MCGRAW HOMES
Pick of the Parade & Distinctive Design
MOJO BUILT
Pick of the Parade & Distinctive Design
NEW MARK HOMES KC
Pick of the Parade (3) & Distinctive Design
PARKS PHILLIPS HOMES
Pick of the Parade & Distinctive Design
PATRIOT HOMES
Pick of the Parade
PCDI HOMES
Pick of the Parade
RODROCK HOMES
Pick of the Parade (2)
ROYAL HOME BUILDERS
Pick of the Parade & Distinctive Design
SAB CONSTRUCTION
Pick of the Parade (4) & Distinctive Design (4)
SHEPARD HOMES
Distinctive Design (2)
SPIESS CUSTOM HOMES
Distinctive Design
WALKER CUSTOM HOMES
Pick of the Parade & Distinctive Design
WHEELER HOMES
Pick of the Parade & Distinctive Design
WILLIS CUSTOM HOMES
Pick of the Parade & Distinctive Design
30 WALKERCUSTOMHOMES
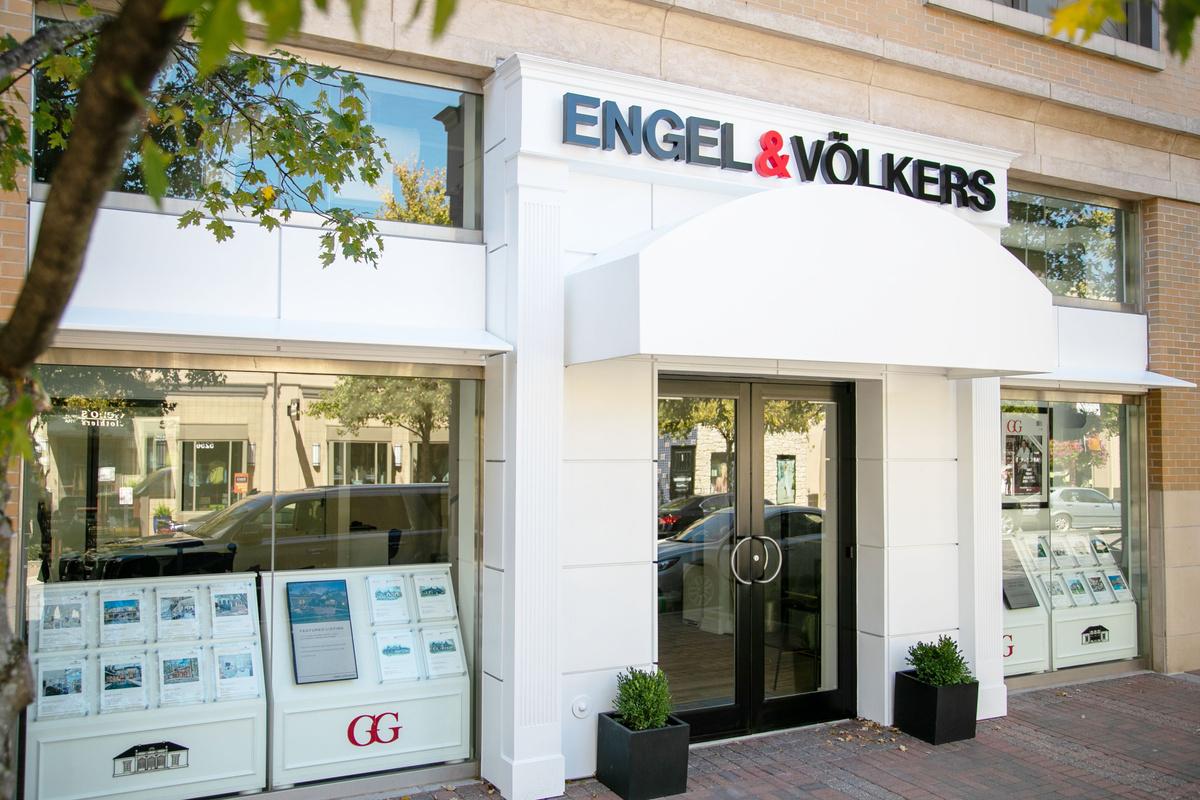
Engel & Völkers Kansas City
Engel & Völkers Kansas City is an experienced group of professional Real Estate Advisors Whatever your requirements, a member of our local team is there to guide and assist you
Real Estate is a people business and our Advisors are among the most experienced and respected in North America, with production measured in billions of dollars over thousands of transactions, we are here to assist with all your real estate needs on a global level
Our team possesses unrivaled market knowledge, a collaborative passion, and a love of life in the Kansas City area They are supported by a superb, dedicated staff and industry leading management, committed to excellence We invite you to explore our services and look forward to working with you
facebook.com/evkansascity
instagram.com/evkansascity
5255
W 116th Place, Leawood, KS 913-900-0001 evkansascity.com
31
evkansascity com 913-900-0001
