Comprehensive AnnuAl FinAnCiAl report
City of fayetteville, GeorGia for the year ended July 31, 2018

 Inside the Old Fayette County Courthouse clock tower
Photograph by Christopher Fairchild
Inside the Old Fayette County Courthouse clock tower
Photograph by Christopher Fairchild

Inside the Old Fayette County Courthouse clock tower
Photograph by Christopher Fairchild
Edward Johnson
CITY MANAGER
Ray Gibson
CITY CLERK
Anne Barksdale
January 25, 2019
Honorable Edward Johnson Jr., Mayor Members of the City Council and Citizens of Fayetteville, GeorgiaLadies and Gentlemen:
COUNCIL
Paul Oddo Jr., Mayor Pro Tem
Kathaleen Brewer
Richard J. Hoffman
Harlan Shirley
Scott Stacy
The comprehensive annual financial report of the City of Fayetteville, Georgia (the “City”) for the fiscal year ended July 31, 2018 is hereby submitted. Responsibility for both the accuracy of the data, and the completeness and fairness of the presentation, including all disclosures, rests with the government. To the best of our knowledge and belief, the enclosed data is accurate in all material respects and is reported in a manner designed to present fairly the financial position and results of operations of the various funds of the government. All disclosures necessary to enable a reader to gain an understanding of the City’s financial activities have been included.

The City’s management is responsible for establishing and maintaining an internal control structure designed to ensure that the assets of the City are protected from loss, theft or misuse and to ensure that adequate accounting data is compiled to allow for the preparation of financial statements in conformity with accounting principles generally accepted in the United States of America. The internal control structure is designed to provide reasonable, but not absolute, assurance that these objectives are met. We believe the City’s internal accounting controls adequately safeguard assets and provide reasonable assurance that all financial information has been recorded accurately.
State law requires that every general-purpose local government publish within six months of the close of each fiscal year a complete set of audited financial statements. These statements are to be presented in conformity with generally accepted accounting principles (GAAP) and audited in accordance with generally accepted auditing standards by a firm of licensed certified public accountants.
The accounting firm of Maudlin & Jenkins, LLC, is the City’s auditing firm. The independent auditors’ report on the basic financial statements and combining and individual fund statements and schedules is included in the financial section of this report.
As a recipient of federal and state financial assistance, the City of Fayetteville is also responsible for ensuring that an adequate internal control structure is in place to ensure compliance with applicable laws and regulations related to those programs. The internal control structure is subject to periodic evaluation by the management of the City. For fiscal year 2018, the City was not required to undergo a Single Audit.
Generally accepted accounting principles require that management provide a narrative introduction, overview, and analysis to accompany the basic financial statements in the form of Management’s Discussion and Analysis (MD&A). This letter of transmittal is designed to complement MD&A and should be read in conjunction with it. The City of Fayetteville’s MD&A can be found immediately following the report of the independent auditors.
Reporting Entity. This report includes all funds of the primary government. The government provides a full range of services. These services include police protection, fire protection, court system, the construction and maintenance of highways, street and drainage improvements, planning and zoning, engineering, building and code enforcement, economic development, water, sewer, and storm water services, and Main Street activities and events. Residential sanitation services are provided through a contractual agreement with a private carrier.
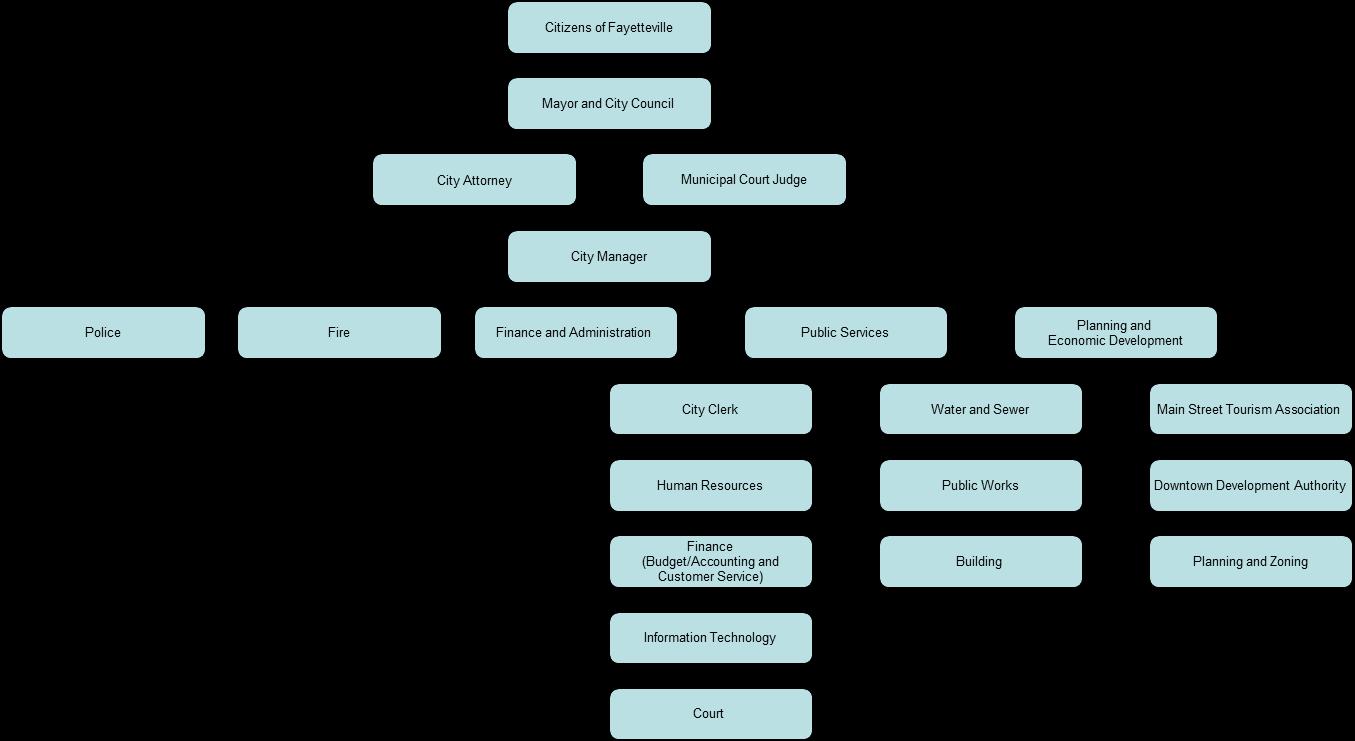
Government Structure. A Mayor and five (5) City Council members serve the City of Fayetteville. The Mayor and City Council are elected at large and serve four (4) year staggered terms. The Mayor and City Council serves as the legislative body responsible for enacting City ordinances, resolutions, appropriating funds, and providing policy direction to City staff. The City Council appoints a City Manager, City Attorney, Municipal Court Judge and various Boards, Commissions and Authorities. The City Council annually adopts a balanced budget and establishes a tax rate for the support of the City programs. The City Manager and Department Directors have the responsibility of administering these programs in accordance with policies and the annual budget adopted by the City Council.
An organizational chart depicting the current structure associated with the management of the City of Fayetteville is included in this introductory section.
General Information. The City of Fayetteville is named for General Marquis de Lafayette of France, who aided the American colonists during the Revolutionary War. Fayetteville was named as the county seat in 1823 and the present-day courthouse in the town square was built in 1825. Listed on the National Register, it remains the oldest courthouse in Georgia and boasts the longest court bench in the world.
There was more or less a city/county government until the 1880’s. The first mayor elected in Fayetteville was W. P. Redwine in 1889.
Downtown Fayetteville is rich in history with the preservation of many notable places of interest. Most of the store buildings that exist today around the courthouse square were built in the late 1890s and early 1900s.
In 1900, the first gas lamps and telephones were installed. The Fayette County Daily Newspaper that began in 1886 is still in operation. Electricity lit up Fayetteville in the 1920s. In 1926, the first public water system was installed with a 60,000-gallon tank above the city well. In 1953, the water system was upgraded with the construction of a new water plant just northwest of the City. A sewer system was installed in the early 1960s. In 1996, the City built a four MGD water treatment plant. And, then, in 2008 the final upgrade to the City’s wastewater treatment plant provides the City with a capacity of 5 MGD.
The history of Fayetteville remains in the downtown area, the historic district, through a program that initially was created in 1994 to bring businesses and activities into the historic district. Development standards have been developed just for the historic district. Fayetteville was designated Georgia’s 37th Main Street City by the Georgia Department of Community Affairs in 1996.
West of the square, one of Fayetteville’s finest historical attractions, The Holliday-Dorsey-Fife house was built in 1855, an antebellum structure with large white columns considered by many to be one of the most refined of the Greek revival houses in Fayette County. The house derives its name from the three main owners that dwelled there: Dr. John Stiles Holliday, whom built the house, and was the uncle of the “Doc” Holliday of Western fame; Solomon Dawson Dorsey, a Colonel of the State Militia during the war between the States who helped enlist volunteers for the confederacy; and Robert E. Lee Fife, a former Fayetteville city council member related to the last family to occupy the house as a residence. The house has ties with well-known personalities such as Margaret Mitchell of Gone with the Wind fame, former Georgia Governor Hugh M. Dorsey, and abounds in confederate history. Today, the City of Fayetteville Downtown Development Authority owns the Holliday-Dorsey-Fife house and is operating it as a museum.
Across, the street lays the city’s historic cemetery circa 1823. The Fitzgerald’s, great grandparents of Margaret Mitchell, as well as the Holliday’s, Dorsey’s and Fife’s are laid to rest. Recent enhancements to the cemetery have been completed to the entranceway, refurbishing and repairing headstones and designing a self-guided, walking tour brochure for preserving Fayetteville’s history.
East of the square is the historic Train Depot available for private rentals and used year around as a special events facility. The Train Depot was originally built in 1902 along the railroad that ran from Atlanta to Fort Valley via Fayetteville. The railroad ceased to run through Fayetteville and the tracks were lifted in 1939.
South of the square, The Fayetteville Academy or Seminary was built in 1857, which later became a public school, Glynn Street School, and later in 1994 was renovated and is where the Fayetteville City Hall resides.
In May 2006, a Georgia Historical Marker was unveiled at City Hall honoring former Georgia Governor Hugh M. Dorsey. He was born in Fayetteville and served as governor for two terms from 1917 to 1921.
In 2007, First Lady Laura Bush awarded the City of Fayetteville the Preserve America Designation in recognition of the continuing commitment to preserving and using its cultural and natural resources for the benefit and enjoyment of the public.
Fayetteville has a strong historical preservation ethic that is evident throughout the downtown district. At present, there is an effort underway by the Main Street program to revitalize the downtown area. The city limits have been extended far beyond the courthouse and the city business district now runs from a couple of miles south of the courthouse to almost three miles north for a total of about five miles of business area. There are now seven schools in Fayetteville, an outdoor shopping center (the Pavilion), the Southern Ground Amphitheater (formerly Villages Amphitheater), two hotels, specialty shops of all descriptions, and a developing west side, that includes the Fayette Piedmont Hospital and medical complexes, all which make Fayetteville an attractive community. Numerous festivals and events are held on the square during the calendar year, which brings thousands of people to downtown to participate in fellowship and community. Additionally, the Southern Ground Amphitheater plays host to a wide array of concerts, films, and dramatic events. In 2012, the Downtown Development Authority negotiated a multi- year, title sponsorship for the Villages Amphitheater with Southern Ground Artists, Inc. For the term of the agreement, the amphitheater will be listed in all advertising and mentions as the Southern Ground Amphitheater. In 2014, Pinewood Atlanta Studios, the largest film and television production studio in the United States outside the state of California located on the west side of Fayetteville, opened.
Economic Condition and Outlook. Located approximately 21 miles south of Atlanta, the City of Fayetteville continues to benefit economically by being an integral part of Metropolitan Atlanta. The City of Fayetteville is well positioned geographically to Atlanta and to the Hartsfield-Jackson Atlanta International Airport, which makes it convenient for the residents to travel for business and/or pleasure. The City of Fayetteville has a wealth of natural, cultural, historical, and commercial resources that provides an amenity for residents, a destination for tourists, and an attractive location for commercial businesses.
The population of Fayetteville is 17,056. The median housing value in Fayetteville is $242,197. Renters make up about 26.9% of the City’s population; while 67% own homes. 6% of the homes and apartments are vacant in the City. The City remains affordable to residents as the per capita income is $35,197.
The total number of building permit inspections for fiscal year 2018 was 4,524 compared to last fiscal year, was 3,613. The total number of development plan applications was 15 compared to last fiscal year, was 12, and the total number of erosion control inspections was 356 compared to last fiscal year, was 383.
The unemployment rate for Fayetteville is unchanged from 5.2% . Sales and office type jobs are the most prominent jobs in Fayetteville, followed by management, business, and financial operation.
Financial Planning. The annual budget(s) serves as the current foundation for the City of Fayetteville’s financial planning and control. The City of Fayetteville budget(s) are adopted by City Council on or before July 31 at a regular Council meeting that is open to the public. The level of legal budgetary control is the departmental level. A budget is legally adopted for all Governmental Fund types and Proprietary Fund types. Formal budgetary integration is employed as a management control device during the year. The budget is based on the same method of accounting as the fund it represents. Transfers of appropriations within a department budget or within a non-departmental expenditures category require the approval of the finance director. Increase or decrease (change) in appropriations within a departmental budget or in a nondepartmental expense category requires approval of the governing body in the form of amendments to the budget ordinance.
The Mayor and City Council have set the goals that our financial planning adheres to by providing the necessary and available resources. The overall goals are: (1) achieve all goals while striving for the lowest total cost for public services; (2) maintain a managed growth policy that requires quality development in concert with our economic development strategy; (3) provide for the public safety and welfare by committing appropriate resources to police, fire, streets, recreation, water and sewer, and support services; (4) continue cooperative efforts with other governments and government agencies; and (5) preserve our historic and cultural heritage and encourage revitalization of downtown through support of Main Street initiatives.
The financial position of the City of Fayetteville continues to improve from the recent recession. We have seen two years of positive growth in the tax digest. Most revenue sources seem to be stabilizing with even some slight increases in other revenue sources. Our city has been optimizing the use of limited resources to preserve core services. During the last several years, the cost to support existing city services outpaced growth in revenues. We continue to work on capital expenditures for mostly public safety needs, however, again, we were able to add to our fleet for public works The City continues to try and hold cost down through fuel conservation policy and debt restructuring.
The City has continued to maintain adequate fund balances consistent with our reserve fund policy. With continued monitoring of our revenues and expenditures, the City can meet goals and objectives in the public service area: police and fire protection, street and drainage improvements, and infrastructure.
During 2018, the City was able to add 43 new employees. Six were in General Government position, twelve in the Police Department, fifteen in the Fire Department, four in the Community Development, one in Downtown Development, and five more in the Public Services Department. Once again, the City had an increase in personal services and benefits. The increase was due mainly to the increasing cost of health insurance.
Major Initiatives. For fiscal year 2018, the new Upper Deck seating area at the Southern Ground Amphitheater was completed.
Launched a new branding for Main Street Fayetteville.
The Fire Department received the Department of Homeland Security SAFER grant award in the amount of $1,545,364 for the hiring of 12 firefighters.
The Water Division of Public Services completed the Yusifji Well Construction Project as part of the Groundwater Expansion Project.
The most significant project occurred with the completed negotiations for the purchase of the Fayette County Board of Education property for future City Hall site and the purchase of two strategic parcels in preparation for the Downtown redevelopment plan.
Strategic Financial Planning. The City of Fayetteville has initiated processes that have it looking to the future and planning for services, programs and facilities to meet the needs of the residents and businesses of the community. The most current budget process addressed both revenues and expenditures for its operating programs for the current year. The five- year financial forecast is developed to begin the process of looking at future needs and financial trends in order to better plan for the long-term needs of the City, which included personnel, operations and maintenance. The capital improvement program establishes a continuing five- year look at facility and equipment needs. The City also has a capital improvement program for transportation and infrastructure.
Financial Analysis and Planning is essentially a process, which assesses the future to the extent possible and determines what the picture of the community, from many different perspectives, should look like in the future years. The Mayor and City Council have recognized the need for this type of planning effort, which will in turn provide the roadmap for future budgeting and capital planning efforts. Such a plan provides guidance to the legislative and administrative arms of city government, but also provides a guideline for residents and businesses of the community to act upon in the development of private programs and services.
Relevant Financial Policies. Financial policies and procedures have also been implemented to ensure balance, control, and stability to maintain and oversee the finances within and throughout the City. These policies and procedures address fund balances, reserve fund policy, purchasing, contract administration, debt administration, accounting, auditing, financial reporting, budget, capital outlay, investment, revenue administration, fixed assets, strategic planning, and grant administration.
Awards. The Government Finance Officers Association (“GFOA”) of the United States and Canada awarded a Certificate of Achievement for Excellence in Financial Reporting to the City of Fayetteville for its Comprehensive Annual Financial Report (CAFR) for the fiscal year ended July 31, 2017. This was the twentieth-second consecutive year that the government has received this prestigious award. In order to be awarded a Certificate of Achievement, the government must publish an easily readable and efficiently organized comprehensive annual financial report. This report must satisfy both generally accepted accounting principles and applicable legal requirements.
A Certificate of Achievement is valid for a period of one year only. We believe that our current CAFR continues to meet the Certificate of Achievement Program’s requirements and we are submitting it to the GFOA to determine its eligibility for another certificate.
In addition, the City also received the GFOA Award for Distinguished Budget Presentation for the annual budget for fiscal year 2018. This was the twelfth consecutive year that the government has received this prestigious award. In order to qualify for the Distinguished Budget Presentation Award, the City’s budget document was judged proficient as a policy document, a financial plan, an operations guide, and a communication device.
A Distinguished Budget Presentation Award is valid for a period of one year only. We believe our current budget continues to conform to the Distinguished Budget Presentation Award Program’s requirements, and we are submitting it to the GFOA to determine its eligibility for another award.
Acknowledgments. The preparation of the CAFR on a timely basis was made possible by the dedicated service of the City staff and department directors and the auditors of our accounting firm, Mauldin and Jenkins, LLC. In closing, without the leadership and support of the Mayor and City Council, the preparation of this report would not have been possible. My sincere appreciation is extended to each individual for the contributions made in the preparations of this report.
Respectfully submitted,

CITY OF FAYETTEVILLE, GEORGIA
LIST OF PRINCIPAL OFFICIALS
MAYOR
Edward Johnson
CITY COUNCIL MEMBERS
Scott Stacy Mayor Pro Tem
James Williams
Paul Oddo
Kathaleen Brewer
Harlan Shirley
CITY MANAGER
Ray Gibson
CITY CLERK
Anne Barksdale
DIRECTOR OF FINANCE & ADMINISTRATIVE SERVICES
Mike Bush
CITY ATTORNEY
David Winkle
CITY AUDITORS
Mauldin & Jenkins, LLC
We have audited the accompanying financial statements of the governmental activities, the business-type activities, each major fund, and the aggregate remaining fund information of the City of Fayetteville, Georgia (the “City”) as of and for the year ended July 31, 2018, and the related notes to the financial statements, which collectively comprise the City’s basic financial statements as listed in the table of contents.
Management is responsible for the preparation and fair presentation of these financial statements in accordance with accounting principles generally accepted in the United States of America; this includes the design, implementation, and maintenance of internal control relevant to the preparation and fair presentation of financial statements that are free from material misstatement, whether due to fraud or error.
Our responsibility is to express opinions on these financial statements based on our audit. We conducted our audit in accordance with auditing standards generally accepted in the United States of America and the standards applicable to financial audits contained in Government Auditing Standards, issued by the Comptroller General of the United States. Those standards require that we plan and perform the audit to obtain reasonable assurance about whether the financial statements are free from material misstatement.
An audit involves performing procedures to obtain audit evidence about the amounts and disclosures in the financial statements. The procedures selected depend on the auditor’s judgment, including the assessment of the risks of material misstatement of the financial statements, whether due to fraud or error. In making those risk assessments, the auditor considers internal control relevant to the entity’s preparation and fair presentation of the financial statements in order to design audit procedures that are appropriate in the circumstances, but not for the purpose of expressing an opinion on the effectiveness of the entity’s internal control. Accordingly, we express no such opinion. An audit also includes evaluating the appropriateness of accounting policies used and the reasonableness of significant accounting estimates made by management, as well as evaluating the overall presentation of the financial statements.

We believe that the audit evidence we have obtained is sufficient and appropriate to provide a basis for our audit opinions.
In our opinion, the financial statements referred to above present fairly, in all material respects, the respective financial position of the governmental activities, the business-type activities, each major fund, and the aggregate remaining fund information of the City of Fayetteville, Georgia as of July 31, 2018, and the respective changes in financial position and, where applicable, cash flows thereof and the respective budgetary comparisons for the General Fund for the year then ended in accordance with accounting principles generally accepted in the United States of America.
Required Supplementary Information
Accounting principles generally accepted in the United States of America require that the Management’s Discussion and Analysis (on pages 4 through 13), the Schedule of Changes in the City’s Net Pension Liability and Related Ratios (on page 61), and the Schedule of City Contributions (on page 62) be presented to supplement the basic financial statements. Such information, although not a part of the basic financial statements, is required by the Governmental Accounting Standards Board, who considers it to be an essential part of financial reporting for placing the basic financial statements in an appropriate operational, economic, or historical context. We have applied certain limited procedures to the required supplementary information in accordance with auditing standards generally accepted in the United States of America, which consisted of inquiries of management about the methods of preparing the information and comparing the information for consistency with management’s responses to our inquiries, the basic financial statements, and other knowledge we obtained during our audit of the basic financial statements. We do not express an opinion or provide any assurance on the information because the limited procedures do not provide us with sufficient evidence to express an opinion or provide any assurance.
Our audit was conducted for the purpose of forming opinions on the financial statements that collectively comprise the City of Fayetteville, Georgia’s basic financial statements. The introductory section, combining and individual nonmajor fund financial statements and schedules, and the statistical section are presented for purposes of additional analysis and are not a required part of the basic financial statements of the City of Fayetteville, Georgia. The accompanying schedule of expenditures of special purpose local option sales tax proceeds is presented for purposes of additional analysis as required by the Official Code of Georgia (O.C.G.A.) 48-8-121, and is not a required part of the basic financial statements.
The combining and individual nonmajor fund financial statements and schedules and the schedule of expenditures of special purpose local option sales tax proceeds are the responsibility of management and were derived from and relate directly to the underlying accounting and other records used to prepare the basic financial statements. Such information has been subjected to the auditing procedures applied in the audit of the basic financial statements and certain additional procedures, including comparing and reconciling such information directly to the underlying accounting and other records used to prepare the basic financial statements or to the basic financial statements themselves, and other additional procedures in accordance with auditing standards generally accepted in the United States of America. In our opinion, the combining and individual nonmajor fund financial statements and schedules and the schedule of expenditures of special purpose local option sales tax proceeds are fairly stated, in all material respects, in relation to the basic financial statements as a whole.
The introductory and statistical sections have not been subjected to the auditing procedures applied in the audit of the basic financial statements, and accordingly, we do not express an opinion or provide any assurance on them .
In accordance with Government Auditing Standards, we have also issued our report dated January 25, 2019, on our consideration of the City of Fayetteville, Georgia’s internal control over financial reporting and on our tests of its compliance with certain provisions of laws, regulations, contracts and grant agreements and other matters. The purpose of that report is to describe the scope of our testing of internal control over financial reporting and compliance and the results of that testing, and not to provide an opinion on the effectiveness of the City of Fayetteville, Georgia’s internal control over financial reporting or on compliance. That report is an integral part of an audit performed in accordance with Government Auditing Standards in considering the City of Fayetteville, Georgia’s internal control over financial reporting and compliance.
Macon, Georgia
January 25, 2019

Management’s Discussion and Analysis of the City of Fayetteville, Georgia’s financial performance provides an overall review of the City’s financial activities for the fiscal year ended July 31, 2018. It is designed to give the reader an objective and easily readable analysis of the City’s financial performance. The primary intent of this discussion and analysis is to look at the City’s financial performance as a whole; readers should also review the letter of transmittal, notes to the basic financial statements, and the financial statements to enhance their understanding of the City’s financial performance.
Ke y financial highlights for FY 2018 are as follows:
In total, combined net position increased by $2,595,539 which represents a 2.79% increase over FY 2017. This increase can primarily be attributed to investments in capital assets.
• Com bined tax revenues accounted for $12,566,128 or 63.9% of all revenues from governmental activities. Service specific revenues in the form of charges for services, operating grants and contributions, and capital grants and contributions accounted for $7,030,105 or 26.3% of total revenues of $19,675,955 from governmental activities.
• The City had $17,417,406 in expenses related to governmental activities; $7,030,105 of these expenses were offset by charges for services, grants, and contributions. General revenues (primarily taxes) of $12,645,850 provided for these services as well as increasing the City’s net position by $2,258,549.
• Total Water and Sewer Fund revenues for fiscal year 2018 were $6,522,202 Total expenses for fiscal year 2018 were $5,695.756 Capital contributions were recorded in the amount of $184.970, including but not limited to donated property and sewer proportionate share. The change in net position after depreciation and non-operating revenues/expenses was $303.734 for the fiscal year-end 2018.
• Revenues from the General Fund were $13,466,734 fiscal year 2018, an increase of approximately 6.7% over the prior fiscal year, due to an increase in taxes, fines and forfeitures, charges for services, and collections. General Fund expenditures totaled $15,152,520 for the fiscal year ended July 31, 2018, an increase of 24.6% over last fiscal year due mostly to increased spending in general government, judicial, public works, housing and development, and public safety areas.
This comprehensive annual financial report consists of a series of financial statements and notes to those statements. These statements are organized so the reader can understand the City of Fayetteville as a financial whole, or as an entire operating entity.
The Statement of Net Position and Statement of Activities provide information about the activities of the whole City, presenting both an aggregate view of the City’s finances and a longer-term view of those finances. Fund financial statements provide the next level of detail. For governmental funds, these statements tell how services were financed in the short term as well as what remains for future spending. For proprietary funds, the statements offer short- and long-term financial information about activities the City operates like businesses, such as water and sewer. The fund financial statements also look at the City’s most significant funds with all other non-major funds presented in total in one column.
These two statements report the City’s net position and changes in net position. This change in net position is important because it tells the reader that, for the City as a whole, the financial position of the City has improved or diminished. The causes of this change may be the result of many factors, some financial and some non-financial, including the City’s property tax base, facility conditions, and other factors.
In the Statement of Net Position and the Statement of Activities, the City has both governmental and business-type activities:
• Governmental Activities: Most of the City’s programs and services are reported here including general government, judicial, public safety, public works, culture and recreation, and housing and development. Sales taxes, property taxes, occupation taxes, and fines and forfeitures finance most of these activities.
• Business-Type Activities: The City charges fees to cover the services it provides. These activities include water and sewer services, stormwater services, sanitation services and recycling services.
Fund financial reports provide detailed information about the City’s major funds. The City uses many funds to account for a multitude of financial transactions. However, these fund financial statements focus on the City’s most significant funds.
Most of the City’s activities are reported in the governmental funds, which focus on how money flows into and out of those funds and the balances left at year-end available for spending in future periods. These funds are reported using an accounting method called modified accrual accounting which measures cash and all other financial assets that can readily be converted to cash. The governmental fund statements provide a detailed short-term view of the City’s general governmental operations and basic services it provides. Governmental fund information helps the reader determine whether there are more financial resources that can be spent in the near future to finance governmental services. The relationship (or difference) between governmental activities (reported in the Statement of Net Position and the Statement of Activities) and governmental funds is reconciled in the financial statements. See Note 2 to the Financial Statements.
The capital projects funds are used to account for financial resources to be used for the acquisition, construction, or renovation of major capital assets. The City of Fayetteville has four Capital Projects Funds: (1) Building Fund, (2) Impact Fee Fund, (3) Capital Projects 2 Fund, and (4) 2017 Special Purpose Local Option Sales Tax (SPLOST) Fund.
The special revenue funds are used to account for specific revenues that are legally restricted to expenditures for particular purposes. The City of Fayetteville has seven Special Revenue Funds: (1) Confiscated Assets Fund, (2) Hotel/Motel Tax Fund, (3) Vehicle Excise Tax Fund, (4) Cemetery Fund, (5) Veterans Memorial, (6) Downtown Development Authority Fund, and (7) Main Street Tourism Association Fund.
Proprietary funds are activities that a City operates similar to a business in that it attempts to recover costs through charges to the user. The City’s only proprietary funds are enterprise funds. Enterprise funds may be used to account for any activity or service that charges a fee to external users to cover the cost of operations, including cost of depreciation and debt service. The City operates its water and sewer fund and solid waste fund as enterprise funds. Proprietary fund statements use the accrual basis of accounting similar to the City-wide statements.
The fiscal year 2018 total net position represents an increase of 2.8% over fiscal year 2017. The City is starting to see changes in the economy that have affected some revenue sources: improvement in local option sales tax and other taxes with a decrease in capital grant monies.
Please note that public safety expenses of $7,904,689 represent 45% of the total governmental expenses. The next most significant program expense is general government, which totals $3,580,927 or 21% of the total.
The most significant business-type activity of the City is the Water and Sewer Department. The majority of its revenue was derived from user fees charged for product and service.
The Statement of Activities shows the cost of program services and the charges for services and grants offsetting those services. Table 3 shows, for governmental and business-type activities, the combined total cost of services and the combined net cost of services; that is, it identifies the cost of these services supported by tax revenue.
This information was taken from the Statement of Activities on pages 15 and 16.
At the end of the fiscal year 2018, the combined ending fund balances for the City’s Governmental Funds were $12,449,287. Of the total fund balance, $11,948,810 is available as working capital for current spending in accordance with the purposes of the specific funds. The remainder of the fund balance, $500,477, is not available for new spending because it is considered nonspendable (pre-paid items and inventory).
The General Fund’s fund balance for the fiscal year ended 2018 was $4,798,621, which indicates a decrease in fund balance over the previous year by $1,908,057. The decrease in the General Fund’s fund balance is due to $80,000 being used to fund shortfalls in general government activities, $726,000 to cover 12 new firefighters and one new police officer, $325,000 to fund the purchase of land for the DDA, $140,000 to fund the City’s portion of two TE projects, and $637,000 for the purchase of land for the new City Hall Project. The new SPLOST 2017 fund collected $4,096,234 more in revenues than we spent in expenditures in 2018 Information provided in Table 4 is from the Governmental Funds Balance Sheet on pages 17 and 18
*Formerly referred to as the SPLOST Fund.
At the end of the fiscal year 2018, the combined net position of the City’s Proprietary Funds were $13,991,853. The most significant event that took place in the Water and Sewer Funds was the increase of supplies and contracted services and the increase in revenue collections.
• The City’s budget is prepared according to Georgia law. The most significant budget fund is the General Fund.
• For the General Fund, the actual revenues of $13,466,734 were less than the final budgeted amount of $14,469,660 by $1,002,926.
• The actual expenditures of $15,152,520 were less than the final budgeted amount of $15,704,678 by $552,158. This difference was primarily due to less capital outlay than expected during the current year.
• The original budget had to be increased by $1,024,620 due to the change in revenues. Sales taxes were originally budgeted as $3,310,951 with actual revenues of $3,799,392 for a total increase of $488,441; other taxes were originally budgeted as $4,450,900 with actual revenues of $4,528,300 for a total increase of $77,400; intergovernmental revenues were originally budgeted as $136,372 with actual revenues of $378,631 for an increase of $242,259; and fines and forfeitures were originally budgeted as $1,050,000 with actual revenues of $901,655 for a decrease of $148,345.
At the end of fiscal year 2018, the City had $107,631,965 invested in capital assets, which is an increase over fiscal year 2017 of $4,416,113. Table 5 shows fiscal years 2018 and 2017 balances of the Capital Assets, Net of Accumulated Depreciation as presented in Note 7.
The City reported outstanding debt of $18,365,201 as of July 31, 2018. Debt for the Business-type activities relates to the Water and Sewerage Revenue Bonds that were issued in FY2013 to refinance the cost of the 2003 Water and Sewerage Revenue Bonds, the Water and Sewer Fund’s allocated portion of the net pension liability, and Water and Sewerage issuance of GEFA note payable in FY2017 to make improvements to the city’s storm water infrastructure. The amount of outstanding debt in Governmental Activities includes Certificates of Participation (COPS) with Georgia Municipal Association (GMA), revenue bonds, compensated absences, capital leases, net pension liability, and notes payable totaling $14,511,163. This amount increased over the prior year as a result of an additional lease purchase transaction and additional compensated absences and the implementation of GASB Statement No. 68 and 71 requiring the City to report a net pension liability. Table 6 – Outstanding Long- Term Liabilities reflects information provided in Note 8.
Today, the population for the City of Fayetteville increased by 351 and is estimated to be 17,056. The City continued to see growth in the City’s General Fund revenues, which have increased from $3,840,328 in 1994 to $13,466,734 in 2018. The economic condition and outlook of the City is beginning to show some improvement in residential construction, purchasing by City residents, and the loss of jobs and employment in our area has stabilized.
The City has started to see growth in revenues, particularly property taxes and building related fees. The local option sales taxes are continuing to increase which is a direct reflection of our area’s slow recovery from the recession. Our operating expenses have increased due to the collection of additional revenues through taxes and other revenues. Additionally, our debt service expenses have increased as a result of infrastructure projects and newly required pension liabilities being added to the financial statements.
Staff has developed a Five-Year Plan that includes Workload Indicators and Trend Analysis to assist the City in long-range financial planning and forecasting. This plan is developed with input from each department and is updated annually to reflect any changing needs. This plan is a very conservative forecast of the City’s financial resources and departmental needs to maintain our existing service levels to the community. The Mayor and Council and staff will need to continue to closely evaluate the service and staffing levels on an ongoing basis to ensure that adequate personnel resources and financial resources are available to achieve the desired service levels.
This financial report is designed to provide our citizens, taxpayers, investors, and creditors with a general overview of the City’s finances and to show the City’s accountability for the money it receives. If you have questions about this report or need additional financial information, please contact Mike Bush, Director of Finance and Administrative Services, City of Fayetteville, 240 Glynn Street South, Fayetteville, Georgia 30214, 770-461-6029, or mbush@fayetteville-ga.gov.
The accompanying notes are an integral part of these financial statements.
The accompanying notes are an integral part of these financial statements.
JULY 31, 2018
LIABILITIES, DEFERRED INFLOWS OF RESOURCES, AND FUND BALANCES
Amounts reported for governmental activities in the statement of net position are different because: Capital assets used in governmental activities are not financial resources and therefore, are not reported in the funds.
are not available to pay for current-period expenditures and therefore, are deferred in the funds.
The net pension liability and related deferred outflows and inflows of resources are not financial resources and, therefore, are not reported in the governmental funds.
Long-term liabilities are not due and payable in the current period and therefore, are not reported in the funds.
The accompanying notes are an integral part of these financial statements.
(Continued)
CITY OF FAYETTEVILLE, GEORGIA
STATEMENT OF REVENUES, EXPENDITURES
AND CHANGES IN FUND BALANCES
FOR THE FISCAL YEAR ENDED JULY 31, 2018
The accompanying notes are an integral part of these financial statements.
Governmentalfundsreportcapitaloutlaysasexpenditures.However, in the statementof activities the cost ofthoseassets is allocatedovertheirestimateduseful lives andreportedas depreciationexpense. This is the amountby which capitaloutlayexceeded depreciation expense in the current period.
The issuanceoflong-termdebtprovidescurrentfinancialresources to governmentalfunds, while the repaymentof the principaloflong-termdebtconsumes the currentfinancialresources of governmentalfunds.Neithertransaction,however,hasany effect onnetposition. Also, governmentalfundsreport theeffect ofpremiums,discounts,and similar items whendebt is first issued,whereastheseamounts are deferredandamortized in the statementof activities. This amount is the net effect of these differences in the treatment of long-term debt and related items.
accompanying notes are an integral part of these financial statements.
STATEMENT OF REVENUES, EXPENDITURES AND CHANGES IN FUND BALANCES
BUDGET AND ACTUAL GENERAL FUND FOR THE FISCAL YEAR ENDED JULY 31, 2018
(Continued)
AND ACTUAL GENERAL FUND FOR THE FISCAL YEAR ENDED JULY 31, 2018
The accompanying notes are an integral part of these financial statements.
(Continued)
JULY 31, 2018
JULY 31, 2018
The accompanying notes are an integral part of these financial statements.
PROPRIETARY FUNDS FOR THE FISCAL YEAR ENDED JULY 31, 2018
The accompanying notes are an integral part of these financial statements.
(Continued)
31, 2018
Reconciliation of operating income to net cash provided by (used in) operating activities:
The accompanying notes are an integral part of these financial statements.
The financial statements of the City of Fayetteville, Georgia (the “City”) have been prepared in conformity with accounting principles generally accepted in the United States of America as applied to governments. The Governmental Accounting Standards Board (GASB) is the accepted standardsetting body for establishing governmental accounting and financial reporting principles. The more significant of the City's accounting policies are described below.
The City operates under a Council/Manager form of government. As required by accounting principles generally accepted in the United States of America, the financial statements of the reporting entity include those of the City of Fayetteville, Georgia (the primary government) and its component units. The component units discussed below are included in the City's reporting entity because of the significance of their operational or financial relationship with the City. In conformity with accounting principles generally accepted in the United States of America, as set forth in GASB Statement No. 14, and as amended by Statements No. 34 and 61, the financial statements of the component units are blended in the government-wide financial statements.
The City of Fayetteville Downtown Development Authority (the “Downtown Development Authority”) was organized to develop and promote commerce, industry and general welfare within the City. The City appoints the Downtown Development Authority’s board members and provides the majority of funding for the Downtown Development Authority’s operating budget The Downtown Development Authority’s debt outstanding is expected to be repaid almost entirely from the resources of the City. The Downtown Development Authority is reviewed and audited along with the primary government financial statements in accordance with the GASB statements noted above, however, separate financial statements are not prepared.
The Fayetteville Main Street Tourism Association, Inc. (the “Main Street Tourism Association”) was organized to serve the needs and interests of tourism within the City of Fayetteville, and in particular, tourism within the Main Street District of Fayetteville. The City’s governing body is substantively the same as the Fayetteville Main Street Tourism Association’s governing body and has operational responsibility for the Main Street Tourism Association in that the City manages the activities of the component unit in essentially the same manner in which it manages its own programs, departments, or agencies. The Main Street Tourism Association is reviewed and audited along with the primary government financial statements in accordance with the GASB statements noted above, however, separate financial statements are not prepared.
The government-wide financial statements (i.e., the statement of net position and the statement of activities) report information on all of the activities of the government. For the most part, the effect of interfund activity has been removed from these statements. Governmental activities , which normally are supported by taxes and intergovernmental revenues, are reported separately from business-type activities, which rely to a significant extent on fees and charges for support.
The statement of activities demonstrates the degree to which the direct expenses of a given function or segment are offset by program revenues. Direct expenses are those that are clearly identifiable with a specific function or segment. Program revenues include: 1) charges to those who purchase, use, or directly benefit from goods, services, or privileges provided by a given function or, segment and 2) grants and contributions that are restricted to meeting the operational or capital requirements of a particular function or segment. Taxes and other items not properly included among program revenues are reported instead as general revenues
Separate financial statements are provided for governmental funds and proprietary funds. Major individual governmental funds and major individual enterprise funds are reported as separate columns in the fund financial statements.
The government-wide financial statements are reported using the economic resources measurement focus and the accrual basis of accounting, as are the proprietary fund financial statements. Revenues are recorded when earned and expenses are recorded when a liability is incurred, regardless of the timing of the related cash flows. Property taxes are recognized as revenues in the year for which they are levied. Grants and similar items are recognized as revenue as soon as all eligibility requirements imposed by the provider have been met.
Governmental fund financial statements are reported using the current financial resources measurement focus and the modified accrual basis of accounting. Revenues are recognized as soon as they are both measurable and available. Revenues are considered to be available when they are collectible within the current period. For this purpose, the City considers revenues to be available if they are collected within 60 days of the end of the current fiscal period. Expenditures generally are recorded when a liability is incurred, as under accrual accounting. However, debt service expenditures, as well as expenditures related to compensated absences and claims and judgments, are recorded only when payment is due.
Property taxes, intergovernmental grants, and investment income associated with the current fiscal period are all considered to be susceptible to accrual and so have been recognized as revenues of the current fiscal period. All other revenue items are considered to be measurable and available only when cash is received by the City.
The City reports the following major governmental funds:
The General Fund is the City’s primary operating fund. It accounts for all financial resources of the general government, except those required to be accounted for in another fund.
The Special Purpose Local Option Sales Tax (SPLOST) 2017 Fund is the fund that accounts for expenditures relating to the renovation of existing stormwater projects, recreation projects, public safety uses, construction of roads, and all such projects under the SPLOST 2017 referendum.
The City reports the following major proprietary fund:
The Water and Sewer Fund accounts for the operation of the water and sewerage system including all revenues from sources applicable to these operations and all expenses of the operation.
As a general rule, the effect of interfund activity has been eliminated from the government-wide financial statements. Exceptions to this general rule are charges between the City’s water and sewer function and the other functions of the government. Elimination of these charges would distort the direct costs reported for the various functions concerned.
Proprietary funds distinguish operating revenues and expenses from non-operating items. Operating revenues and expenses generally result from providing services and producing and delivering goods in connection with a proprietary fund’s principal ongoing operations. The principal operating revenues of the enterprise funds are charges for goods and services provided. Operating expenses of the enterprise funds include the cost of these goods and services, administrative expenses, and depreciation on capital assets. All revenues and expenses not meeting this definition are reported as non-operating revenues and expenses.
When both restricted and unrestricted resources are available for use, it is the City’s policy to use restricted resources first, then unrestricted resources as they are needed.
The City’s cash and cash equivalents are considered to be cash on hand, demand deposits, and short-term investments with original maturities of three months or less from the date of acquisition.
State statutes authorize the City to invest in: obligations of the United States, the State of Georgia and other political subdivisions of the State of Georgia, and other states; prime bankers’ acceptances; repurchase agreements; and the Georgia local government investment pool (Georgia Fund 1). Georgia Fund 1, created by O.C.G.A. 36-83-8, is a stable net asset value investment pool which follows Standard & Poor’s criteria for AAAf rated money market funds. The investment in the Georgia Fund 1 represents the City’s portion of a pooled investment account operated by the Office of the State Treasurer. The pool consists of U.S. treasury obligations, securities issued or guaranteed by the U.S. Government or any of its agencies or instrumentalities, banker’s acceptances, overnight and term repurchase agreements with highly rated counterparties, and collateralized bank accounts. The pool also adjusts the value of its investments to fair value as of year-end and the City’s investment in the Georgia Fund 1 is valued at fair value.
Activity between funds that are representative of lending/borrowing arrangements outstanding at the end of the fiscal year as well as all other outstanding balances between funds are reported as “due to/from other funds”. Any residual balances outstanding between the governmental activities and business-type activities are reported in the government-wide financial statements as “internal balances”.
Inventories are valued at cost, which approximates market, using the first in, first out (“FIFO”) method. The consumption method is used to account for inventories. Under the consumption method, inventory items are recognized as expenditures when used.
Prepaid items are accounted for using the consumption method. A prepaid item is recognized when a cash expenditure/expense is made for goods or services that were purchased for consumption, but not consumed as of July 31.
Certain proceeds of enterprise fund revenue bonds, as well as certain resources set aside for their repayment, are classified as restricted assets on the balance sheet because their use is limited by applicable bond covenants.
Capital assets, which include property, plant, equipment, and infrastructure assets, are reported in the applicable governmental or business-type activities column in the government-wide financial statements. Capital assets are defined by the City as assets with an initial, individual cost of more than $5,000 and an estimated useful life in excess of two years. Such assets are recorded at historical cost or estimated historical cost if purchased or constructed. Donated capital assets are recorded at acquisition value at the date of donation. The City has retroactively reported major general infrastructure assets. In this case, the City chose to include all items regardless of their acquisition date. The City was able to estimate the historical cost for the initial reporting of these assets through back trending The costs of normal maintenance and repairs that do not add to the value of the assets or materially extend assets’ lives are not capitalized.
Property, plant and equipment of the primary government, as well as the component units, are depreciated using the straight-line method over the following useful lives:
It is the City’s policy to permit employees to accumulate earned but unused vacation and sick pay benefits. There is no liability for unpaid accumulated sick leave since the City does not have a policy to pay any amount when employees separate from service with the City. All vacation pay is accrued when incurred in the government-wide and proprietary fund financial statements. A liability for these amounts is reported in governmental funds only if they have matured, for example, as a result of employee resignations or retirements.
In the government-wide financial statements, and proprietary fund types in the fund financial statements, long-term debt and other long-term obligations are reported as liabilities in the applicable governmental activities, business-type activities, or proprietary fund type statement of net position. Bond premiums and discounts are deferred and amortized over the life of the bond using the straight-line method, which approximates the effective interest method. The gain/loss on defeasance of bonds is presented as an increase/decrease to the face amount of bonds payable and is being amortized over the life of the bonds through interest expense. Bond issuance costs are expensed in the period incurred.
In the fund financial statements, governmental fund types report the face amount of debt issued as other financing sources. Bond issuance costs, whether or not withheld from proceeds, are reported as expenditures when incurred.
GASB Statements No. 63, Financial Reporting of Deferred Outflows of Resources, Deferred Inflows of Resources, and Net Position and No. 65, Items Previously Reported as Assets and Liabilities, established accounting and financial reporting for deferred outflows/inflows of resources and the concept of net position as the residual of all other elements presented in a statement of net position.
In addition to assets, the statement of net position will sometimes report a separate section for deferred outflows of resources. This separate financial statement element, deferred outflows of resources, represents a consumption of net position that applies to future period(s) and so will not be recognized as an outflow of resources (expense/expenditure) until then. The City had four item s that qualified for reporting in this category. The first relates to the deferred charge on refunding reported in the government-wide and proprietary fund statements of net position. A deferred charge on refunding results from the difference in the carrying value of refunded debt and its reacquisition price. This amount is deferred and amortized over the shorter of the life of the refunded debt or the refunding debt. The other three items relate to the City’s defined benefit pension plan The pension experience differences, pension assumption changes, and the contributions made subsequent to the measurement date are deferred and recognized as pension expense in future years.
In addition to liabilities, the statement of net position and the governmental funds balance sheet will sometimes report a separate section for deferred inflows of resources. This separate financial statement element, deferred inflows of resources, represents an acquisition of fund balance that applies to future period(s) and so will not be recognized as an inflow of resources (revenue) until that time. The City had two item s which qualified for reporting in this category. The first item, unavailable revenue, arises only under the modified accrual basis of accounting, and is reported only in the governmental funds balance sheet. The governmental funds report unavailable revenues from property taxes and these amounts are deferred and will be recognized as an inflow of resources in the period in which the amounts become available. The other item relates to the City’s defined benefit pension plan. The pension investment earnings gain represents future acquisitions of net position and, accordingly, are reported as deferred inflows of resources
Fund equity at the governmental fund financial reporting level is classified as “fund balance” Fund equity for all other reporting is classified as “net position”.
Fund Balance – Generally, fund balance represents the difference between the assets and liabilities under the current financial resources measurement focus of accounting. In the fund financial statements, governmental funds report fund balance classifications that comprise a hierarchy based primarily on the extent to which the City is bound to honor constraints on the specific purposes for which amounts in those funds can be spent. Fund balances are classified as follows:
• Nonspendable – Fund balances are reported as nonspendable when amounts cannot be spent because they are either (a) not in spendable form (i.e., items that are not expected to be converted to cash) or (b) legally or contractually required to be maintained intact.
• Restricted – Fund balances are reported as restricted when there are limitations imposed on their use either through the enabling legislation adopted by the City or through external restrictions imposed by creditors, grantors or laws or regulations of other governments.
• Committed – Fund balances are reported as committed when they can be used only for specific purposes pursuant to constraints imposed by formal action of the City Council through the adoption of a resolution. Only the City Council may modify or rescind the commitment.
• Assigned – Fund balances are reported as assigned when amounts are constrained by the City’s intent to be used for specific purposes, but are neither restricted nor committed. Through resolution, the City Council has authorized the City Manager or the City’s Finance Director to assign fund balances.
• Unassigned – Fund balances are reported as unassigned when the balances do not meet any of the above criterion. The City reports positive unassigned fund balance only in the General Fund. Negative unassigned fund balances may be reported in all funds.
Flow Assumptions – When both restricted and unrestricted amounts of fund balance are available for use for expenditures incurred, it is the City’s policy to use restricted amounts first and then unrestricted amounts as they are needed. For unrestricted amounts of fund balance, it is the City’s policy to use fund balance in the following order:
• Committed
• Assigned
• Unassigned
Net Position – Net position represents the difference between assets and liabilities in reporting which utilizes the economic resources measurement focus. The net investment in capital assets, consists of capital assets, net of accumulated depreciation, reduced by the outstanding balances of any borrowing used (i.e., the amount that the City has spent) for the acquisition, construction or improvem ent of those assets. Net position is reported as restricted using the same definition as used for restricted fund balance as described in the section above. All other net position is reported as unrestricted.
The City applies restricted resources first when an expense is incurred for purposes for which both restricted and unrestricted net position are available.
The preparation of financial statements in conformity with generally accepted accounting principles requires management to make estimates and assumptions that affect the reported amounts of assets and liabilities, the disclosure of contingent assets and liabilities at the date of the financial statements, and the reported amounts of revenues and expenses during the reporting period. Actual results could differ from those estimates.
For purposes of measuring the net pension liability, deferred outflows of resources and deferred inflows of resources related to pensions, and pension expense, information about the fiduciary net position of the City of Fayetteville Retirement Plan and additions to/deductions from the Plan's fiduciary net position have been determined on the same basis as they are reported by the Plan. For this purpose, benefit payments (including refunds of employee contributions) are recognized when due and payable in accordance with the benefit terms. Investments are reported at fair value.
During the year ended July 31, 2017, the City implemented GASB Statement No. 77, Tax Abatement Disclosures. This statement requires the City to disclose information for any tax abatement agreements either entered into by the City, or agreements entered into by other governments that reduce the City’s tax revenues.
A. Explanation of Certain Differences between the Governmental Fund Balance Sheet and the Government-wide Statement of Net Position
The governmental fund balance sheet includes a reconciliation between fund balance – total governmental funds and net position – governmental activities as reported in the government-wide statement of net position. One element of that reconciliation explains that “Long-term liabilities are not due and payable in the current period and, therefore, are not reported in the funds.” The details of this difference are as follows:
B. Explanation of Certain Differences between the Governmental Fund Statement of Revenues, Expenditures and Changes in Fund Balances and the Government-wide Statement of Activities
The governmental fund statement of revenues, expenditures, and changes in fund balances includes a reconciliation between net changes in fund balances – total governmental funds and changes in net position of governmental activities as reported in the government-wide statement of activities. One element of that reconciliation explains that “Governmental funds report capital outlays as expenditures. However, in the statement of activities the cost of those assets is allocated over their useful lives and reported as depreciation expense.” The details of this difference are as follows:
- total
B. Explanation of Certain Differences between the Governmental Fund Statement of Revenues, Expenditures and Changes in Fund Balances and the Government-wide Statement of Activities (Continued)
Another element of the reconciliation states that “The issuance of long-term debt (e.g., bonds, leases) provides current financial resources to governmental funds, while the repayment of the principal of long-term debt consumes the current financial resources of governmental funds. Neither transaction, however, has any effect on net position. Also, governmental funds report the effect of premiums, discounts, and similar items when debt is first issued, whereas these amounts are deferred and amortized in the statement of activities.” The details of this difference are as follows:
Another element of that reconciliation states that “Some expenses reported in the statement of activities do not require the use of current financial resources and, therefore, are not reported as expenditures in governmental funds.” The details of this difference are as follows:
Budgetary Data. Budgets are adopted on a basis consistent with generally accepted accounting principles for the General Fund, special revenue funds, and capital projects funds. Enterprise fund budgets are prepared and utilized as a management tool to assess the operations of the enterprise funds. All annual appropriations lapse at fiscal year-end Prior to July 31, the Director of Finance with the City Manager receives budget requests from the various departments and their department chairmen. A budget is then formulated which the City Manager and Mayor present to full Council sixty (60) days prior to the beginning of each fiscal year. After review by full Council, the budget is published for public hearing. A public hearing is held and the budget is legally adopted by the City Council on the second council meeting in July before the new year begins on August 1. The legal level of budgetary control is the department level.
The appropriated budget is prepared by fund, function, and department. Transfers of appropriations within a department budget or within a nondepartmental expenditure category can be authorized by the Director of Finance, except expenditures for additional personnel. Increases in appropriations in a departmental budget or in a nondepartmental expenditure category, as well as increases in appropriations for employing additional personnel, require approval of the governing body in the form of amendments to the budget resolution. The Council made several immaterial supplemental budgetary appropriations throughout the year.
Encumbrance accounting is employed in governmental funds. Encumbrances (e.g., purchase orders, contracts) outstanding at year-end are reported as assignments or commitments of fund balances, as appropriate, and do not constitute expenditures or liabilities because the commitments will be reappropriated and honored during the subsequent year. At July 31, 2018, there were no outstanding encumbrances.
Credit Risk. State statutes authorize the City to invest in obligations of the State of Georgia or other states; obligations issued by the U.S. government; obligations fully insured or guaranteed by the U.S. government or by a government agency of the United States; obligations of any corporation of the U.S. government; prime bankers’ acceptances; the local government investment pool established by state law; repurchase agreements; and obligations of other political subdivisions of the State of Georgia. The City has no formal credit risk policy other than to only invest in obligations authorized by the State of Georgia. As of July 31, 2018, the City’s investment in Georgia Fund 1 was rated AAAf by Standard & Poor’s and is valued at fair market value.
At July 31, 2018, the City had the following investments:
Interest Rate Risk. The City does not have a formal investment policy that limits investment maturities as a means of managing its exposure to fair value losses arising from increasing interest rates.
Fair Value Measurements. The City categorizes its fair value measurements within the fair value hierarchy established by generally accepted accounting principles. The hierarchy is based on the valuation inputs used to measure the fair value of the asset. Level 1 inputs are quoted prices in active markets for identical assets; Level 2 inputs are significant other observable inputs; and Level 3 inputs are significant unobservable inputs.
The Georgia Fund 1 is an investment pool which does not meet the criteria of GASB Statement No. 79, and, is thus valued at fair value in accordance with GASB Statement No. 31. As a result, the City does not disclose investment in the Georgia Fund 1 within the fair value hierarchy.
Custodial Credit Risk – Deposits. Custodial credit risk for deposits is the risk that, in the event of the failure of a depository financial institution, a government will not be able to recover deposits or will not be able to recover collateral securities that are in the possession of an outside party. State statutes require all deposits and investments (other than federal or state government instruments) to be collateralized by depository insurance, obligations of the U.S. government, or bonds of public authorities, counties, or municipalities. As of July 31, 2018, all of the deposits for the City were fully collateralized in accordance with the state statutes.
Receivables at July 31, 2018 for the City’s individual major funds and nonmajor funds in the aggregate, including the applicable allowances for uncollectible accounts are as follows:
The City receives its property tax revenue from Fayette County, which assesses, levies, and collects the taxes, including real and personal property, mobile homes, and motor vehicles. Tax bills were levied to taxpayers on August 24, 2017, and were due and payable on November 15, 2017. All unpaid taxes became delinquent as of November 16, 2017. Property taxes attached as an enforceable lien on property as of January 15, 2018. Receivables are recorded when taxes are levied.
Capital asset activity for the fiscal year ended July 31, 2018, is as follows:
Depreciation expense was charged to functions/programs of the City as follows:
Revenue Bonds. During the year ended July 31, 2010, the City issued Series 2010 revenue bonds in the amount of $9,870,000. The bond proceeds were used to pay off a note payable to the Georgia Environmental Facilities Authority and to refund a portion of the series 2003 revenue bonds. Revenue bonds outstanding at July 31, 2018, are as follows:
During the year ended July 31, 2014, the City issued Series 2013A and 2013B revenue bonds in the amount of $6,750,000 and $2,635,000, respectively. The bond proceeds were used to refund the remaining portion of the series 2003 revenue bonds. The difference between the cash flows required to service the old debt, series 2003, and the cash flows required to service the new debt, Series 2013A and 2013B, and complete the refunding totaled $330,775. This refunding resulted in an economic gain of $567,355. Revenue bonds outstanding at July 31, 2018, are as follows:
Revenue Bonds (Continued). Debt service requirements to maturity on the revenue bonds are as follows:
The Downtown Development Authority issued revenue bonds during the year ended July 31, 2012 in the amount of $1,885,000 The purpose of the bonds is to advance refund the remaining series 2001 bonds issued during the year ended July 31, 2002. The principal and interest on the bonds is payable from and secured by certain payments made to the Downtown Development Authority by the City pursuant to a contract between the Downtown Development Authority and the City until maturity or the bonds are redeemed. To fulfill its obligations under the contract, the City has agreed that it will, to the extent necessary, levy an annual tax on all taxable property located within the boundaries of the City, at such rate or rates, limited to 3 mills, as may be necessary to make the payments to the Downtown Development Authority for its services as called for by the contract. For the fiscal year ended July 31, 2018, the levied tax by the City totaled $2,536,503 and the total debt service related to the revenue bonds totaled $246,394 Amounts pledged equal total debt service for each applicable year. Revenue bonds outstanding at July 31, 2018, are as follows:
Revenue Bonds (Continued). Downtown Development Authority revenue bond debt service requirements to maturity are as follows:
Notes Payable The Downtown Development Authority has incurred debt to a financial institution to be used on specifically identified Main Street projects. In connection with this debt, a contract has been entered into between the Downtown Development Authority and the City of Fayetteville whereby the City is to levy an annual tax on all taxable property located within the boundaries of the City in order to produce revenues sufficient to pay the debt service on the Downtown Development Authority debt. In the event that payments of this tax by the City to the Downtown Development Authority each year are not sufficient to pay the debt service payment on the debt, the City will be liable for any difference. For the fiscal year ended July 31, 2018, the levied tax by the City totaled $2,536,503 and the total debt service related to the revenue bonds totaled $48,787. Amounts pledged equal total debt service for each applicable year. The note is as follows at July 31, 2018:
Notes Payable (Continued). The Downtown Development Authority has incurred debt to a financial institution to purchase a building. In connection with this debt, a contract has been entered into between the Downtown Development Authority and the City of Fayetteville whereby the City is to levy an annual tax on all taxable property located within the boundaries of the City in order to produce revenues sufficient to pay the debt service on the Downtown Development Authority debt. In the event that payments of this tax by the City to the Downtown Development Authority each year are not sufficient to pay the debt service payment on the debt, the City will be liable for any difference. For the fiscal year ended July 31, 2018, the levied tax by the City totaled $2,536,503 and the total debt service related to the revenue bonds totaled $12,212. Amounts pledged equal total debt service for each applicable year. The note is as follows at July 31, 2018:
During the fiscal year ended July 31, 2018, the City entered into an Installment Sales Agreement debt in the amount of $2,895,000. The proceeds from the debt agreement were used to purchase land for capital outlay projects. The note is as follows at July 31, 2018:
The annual requirements to pay the notes outstanding are as follows:
Notes Payable (Continued). The City has also incurred debt to the Georgia Environmental Facilities Authority for construction of various water and sewer system projects. This note is a construction line of credit agreement with a rate of 2.03% for $1,465,000, of which $801,206 had been drawn as of July 31, 2018. A debt service requirements to maturity schedule is not presented for the construction line of credit as this note payable is in the draw down phase as of July 31, 2018, and repayment will be determined when construction is complete and all draws have been made.
Certificates of Participation. During the year ended July 31, 2005, the City entered into leasepurchase agreements with the Georgia Municipal Association for the construction of a new law enforcement center issuing certificates of participation in the amount of $4,575,000. The City refinanced the previously issued certificates of participation during the year ended July 31, 2013. Certificates of participation outstanding at July 31, 2018, are as follows:
Annual debt service requirements on the certificates of participation are as follows:
Capital Leases. During the year ended July 31, 2016, the City entered into a lease-purchase agreement with the Georgia Municipal Association for the purchase of a vehicle in the amount of $768,055 for the public safety department. The lease agreements qualify as capital leases for accounting purposes (title transfers at the end of the lease term) and have been recorded at the present value of the future minimum lease payments as of the date of their inception. The vehicle leases are being serviced by Building Fund payments with annual interest rates of 2.54%. During the year ended July 31, 2017, the City entered into a lease-purchase agreement with the Georgia Municipal Association for the purchase of a vehicle in the amount of $580,700 for the public safety department. The lease agreements qualify as capital leases for accounting purposes (title transfers at the end of the lease term) and have been recorded at the present value of the future minimum lease payments as of the date of their inception. The vehicle leases are being serviced by Building Fund payments with annual interest rates of 2.06%. During the year ended July 31, 2018, the City entered into three lease-purchase agreements with SunTrust for the purchase of vehicles, equipment and land in the amount of $650,000, $1,200,000, and $515,000. The lease agreements qualify as capital leases for accounting purposes (title transfers at the end of the lease term) and have been recorded at the present value of the future minimum lease payments as of the date of their inception These leases are being serviced by Building Fund and SPLOST 2017 Fund payments with annual interest rates of 2.42%, 2.12%, and 1.94% respectively.
The City reported accumulated depreciation and depreciation expense in the respective amounts of $610,238 and $218,398 on the above leased assets as of July 31, 2018
The following is a schedule of future minimum lease payments under the capital leases and the present value of the net minimum lease payments at July 31, 2018:
Long-term liability activity for the year ended July 31, 2018, is as follows:
For governmental activities, compensated absences are generally liquidated by the General Fund.
Defeasance of Debt. During prior years, the City defeased certain Downtown Development Authority bonds by placing part of the proceeds of the new bonds in irrevocable trusts to provide for all future debt service payments on the old bonds. Accordingly, the trust account assets and the liability for the defeased bonds are not included in the City’s financial statements. On July 31, 2018, the total outstanding amount of bonds considered defeased was $900,000 for the Downtown Development Authority bonds.
The composition of interfund balances as of July 31, 2018, is as follows:
These balances resulted from the time lag between the dates that (1) interfund goods and services are provided or reimbursable expenditures occur, (2) transactions are recorded in the accounting system, and (3) payments between funds are made.
Interfund transfers:
Transfers are used to (1) move revenues from the fund that the statute or budget requires to collect them to the fund that the statute or budget requires to expend them, and (2) use unrestricted revenues collected in the General Fund to finance various programs accounted for in other funds in accordance with budgetary authorizations.
Under Georgia law, the City, in conjunction with other cities and counties in the ten county Atlanta area, is a member of the Atlanta Regional Commission (RC) and is required to pay annual dues thereto. During its fiscal year ended July 31, 2018, the City’s membership dues were paid by Fayette County, Georgia. The City did not pay any annual dues. Membership in an RC is required by the O.C.G.A. Section 50-8-34 which provides for the organizational structure of the RC in Georgia. The RC Board membership includes the chief elected official of each county and municipality of the area. O.C.G.A. 50-8-39.1 provides that the member governments are liable for any debts or obligations of an RC. Separate financial statements may be obtained from:
Atlanta Regional Commission
3715 Northside Parkway
200 Northcreek Suite 300 Atlanta, Georgia 30327
Plan Description
The City’s pension plan is administered through the Georgia Municipal Employee Benefit System (GMEBS), an agent multiple-employer pension plan administered by the Georgia Municipal Association. The Plan provides retirement and disability benefits, annual cost of living adjustments, and death benefits to plan members and beneficiaries. Benefits are provided by the Plan whereby retirees receive between 1% and 1.75% multiplied by the average of the five highest years of regular earnings multiplied by the total credited years of service. The City Council, in its role as the Plan sponsor, has the governing authority to establish and amend from time to time, the benefits provided and the contribution rates of the City and its employees. The Georgia Municipal Association issues a publicly available financial report that includes financial statements and required supplementary information for GMEBS. That report may be obtained at www.gmanet.com or by writing to Georgia Municipal Association, Risk Management and Employee Benefit Services, 201 Pryor Street, NW, Atlanta, Georgia 30303 or by calling (404) 688-0472. Plan
The Plan is subject to minimum funding standards of the Georgia Public Retirement Systems Standards law. The Board of Trustees of GMEBS has adopted a recommended actuarial funding policy for the plan which meets state minimum requirements and will accumulate sufficient funds to provide the benefits under the plan. The funding policy for the Plan, as adopted by the City Council, is to contribute an amount equal to or greater than the actuarially recommended contribution rate. This rate is based on the estimated amount necessary to finance the costs of benefits earned by plan members during the year, with an additional amount to finance any unfunded accrued liability. The City is required to contribute the difference between the actuarially determined rate and the contribution rate of plan members, as determined by the City Council. For the year ended July 31, 2018, the City's contribution rate was 16.32% of annual payroll. City contributions to the Plan were $1,022,541 for the year ended July 31, 2018
The City’s net pension liability was measured as of September 30, 2017. The total pension liability used to calculate the net pension liability was determined by an actuarial valuation as of January 1, 2017, with update procedures performed by the actuary to roll forward to the total pension liability m easured as of September 30, 2017.
Actuarial Assumptions. The total pension liability in the January 1, 2017 actuarial valuation was determined using the following actuarial assumptions, applied to all periods included in the measurement:
rates were based on the RP-2000 Combined Healthy Mortality Table with gender-distinct rates, set forward two years for males and one year for females
The actuarial assumptions used in the January 1, 2018 valuation were based on the results of an actuarial experience study for the period January 1, 2010 – June 30, 2014
Cost of living adjustments were assumed to be 2.75% although the Plan allowance for annual cost of living adjustment is variable, as established by the City Council, in an amount not to exceed 4%.
The long-term expected rate of return on pension plan investments was determined using a building-block method in which best-estimate ranges of expected future real rates of return (expected returns, net of pension plan investment expense and inflation) are developed for each major asset class. These ranges are combined to produce the long-term expected rate of return by weighting the expected future real rates of return by the target asset allocation percentage and by adding expected inflation. Best estimates of arithmetic real rates of return for each major asset class included in the pension plan's target asset allocation as of September 30, 2017, are summarized in the following table:
The discount rate used to measure the total pension liability was 7.50%. The projection of cash flows used to determine the discount rate assumed that plan member contributions will be made at the current contribution rate and that City contributions will be made at rates equal to the difference between actuarially determined contribution rates and the member rate. Based on those assumptions, the pension plan's fiduciary net position was projected to be available to make all projected future benefit payments of current plan members. Therefore, the long-term expected rate of return on pension plan investments was applied to all of the projected benefit payments to determine the total pension liability.
The changes in the components of the net pension liability of the City for the year ended July 31, 2018, were as follows:
The required schedule of changes in the City’s net pension liability and related ratios immediately following the notes to the financial statements presents multi-year trend information about whether the value of plan assets is increasing or decreasing over time relative to the total pension liability.
The following presents the net pension liability of the City, calculated using the discount rate of 7.50%, as well as what the City's net pension liability would be if it were calculated using a discount rate that is 1-percentage-point lower (6.50%) or 1-percentage-point higher (8.50%) than the current rate:
Actuarial valuations involve estimates of the value of reported amounts and assumptions about the probability of events far into the future, and actuarially determined amounts are subject to continual revision as results are compared to past expectations and new estimates are made about the future. Actuarial calculations reflect a long-term perspective. Calculations are based on the substantive plan in effect as of September 30, 2017, and the current sharing pattern of costs between employer and employee.
For the year ended July 31, 2018, the City recognized pension expense of $1,044,574 At July 31, 2018, the City reported deferred outflows of resources and deferred inflows of resources related to pensions from the following sources:
City contributions subsequent to the measurement date of $852,118 are reported as deferred outflows of resources and will be recognized as a reduction of the net pension liability in the year ending July 31, 2019. Other amounts reported as deferred outflows of resources and deferred inflows of resources related to pensions will be recognized in pension expense as follows:
The City participates in the Georgia Municipal Association 401(a) Defined Contribution Plan (the “Plan”) which is administered by the Georgia Municipal Association through their service manager, MetLife. The Plan provides retirement benefits to plan participants and beneficiaries. Plan provisions and contribution requirements are established and may be amended by the City. Employees are not required to contribute to the Plan. The City contributes an amount equal to 50% of the amount contributed by participants to the City’s deferred compensation plan, except that the City shall not match in excess of 2% of the participant’s annual compensation. The City’s contribution for each employee is 100% vested after ten years of continuous service. For the fiscal year ended July 31, 2018, the City’s contribution to the Plan was $57,093. The amount contributed by employees was $169,302
The City is exposed to various risks of losses related to torts; thefts of, damage to, and destruction of assets; errors and omissions; injuries to employees; and natural disasters. The City has joined together with other municipalities in the state as part of the Georgia Interlocal Risk Management Agency Property and Liability Insurance Fund and the Georgia Municipal Association Group SelfInsurance Workers' Compensation Fund, public entity risk pools currently operating as common risk management and insurance programs for member local governments.
As part of these risk pools, the City is obligated to pay all contributions and assessments as prescribed by the pools; to cooperate with the pools’ agents and attorneys; to follow loss reduction procedures established by the funds; and to report as promptly as possible, and in accordance with any coverage descriptions issued, all incidents which could result in the funds being required to pay any claim of loss. The City is also to allow the pools’ agents and attorneys to represent the City in investigation, settlement discussions and all levels of litigation arising out of any claim made against the City within the scope of loss protection furnished by the funds.
The funds are to defend and protect the members of the funds against liability or loss as prescribed in the member City contract and in accordance with the Workers' Compensation law of Georgia. The funds are to pay all cost taxed against members in any legal proceeding defended by the members, all interest accruing after entry of judgment, and all expenses incurred for investigation, negotiation or defense.
Settled claims in the past three years have not exceeded the coverages.
• Nonspendable – The following fund balance is nonspendable because it is allocated to:
• Restricted – The following fund balances are restricted for:
account for public
A. Fund Balances: (Continued)
• Assigned – The following fund balances are assigned for:
General Fund
Three-month operating reserve, as provided for in adopted City policy
$ 3,500,000
The City is involved in several pending lawsuits. Liability, if any, which might result from these proceedings, would not, in the opinion of management and legal counsel, have a material adverse effect on the financial position of the City.
The City has received federal and state grants for specific purposes that are subject to review and audit by the grantor agencies. Such audits could lead to the disallowance of certain expenditures previously reimbursed by those agencies. Based upon prior experience, management of the City believes such disallowances, if any, will not be significant.
In addition to the liabilities enumerated in the balance sheet at July 31, 2018, the City has contractual commitments on uncompleted construction contracts of approximately $65,478
The City has levied a 5% lodging tax. The O.C.G.A. Section 48-13-50 requires that all lodging taxes levied of 5% or more be expended or obligated contractually for the promotion of tourism, conventions, or trade shows. For the fiscal year ended July 31, 2018, the City collected $277,159 of hotel/motel taxes, and transferred 100% of the lodging tax received during the year ended July 31, 2018 to the Downtown Development Authority Fund, where it was used for the promotion of tourism.
Under the provisions of the O.C.G.A. Section 48-13-93, the City has imposed and collected an excise tax on rental motor vehicles. The Code section requires the City to expend taxes collected for the purpose of promoting tourism, conventions, trade shows, etc., and promoting the City and business therein. During the year ended July 31, 2018, the City transferred all motor vehicle excise taxes to the Downtown Development Authority Fund, where it was used for the promotion of tourism. The following schedule represents the revenues and expenditures pertaining to the tax for the year ended July 31, 2018:
Pursuant to Governmental Accounting Standards Board (GASB) Statement No. 77, Tax Abatement Disclosures, the City is required to disclose certain information about tax abatements as defined in the Statement. For the purposes of GASB No. 77, a tax abatement is a reduction in tax revenues that results from an agreement between one or more governments and an individual or entity in which (a) one or more governments promise to forgo tax revenues to which they are otherwise entitled and (b) the individual or entity promises to take specific action after the agreement has been entered into that contributes to economic development or otherwise benefits the City or the citizens of the City. The City has entered into such agreements. The following is a description of the City’s abatement program where the City has promised to forgo taxes.
The Fayette County Board of Commissioners authorizes industries which promote the development of trade, commerce, industry and employment opportunities in the City to participate in the Economic Development Program. Abatements of real and personal property taxes are provided to companies based on a criteria calculation which includes targeted industry, capital investment and employment. The abatement may reduce the amount of property taxes paid over ten or twenty years. The agreements may contain claw back provisions which would result in the re-payment of the annual tax abatement for each year the Company fails to meet its jobs/investment commitment. For the fiscal year ended July 31, 2018, the City abated property taxes totaling $ 151,227.
The General Fund’s building and plant department had actual expenditures in excess of appropriations of $40,897 for the year ended July 31, 2018. This department’s over expenditures were funded by greater than anticipated revenues.
SCHEDULE OF CHANGES IN THE CITY'S NET PENSION LIABILITY AND RELATED RATIOS FOR THE FISCAL YEAR ENDED JULY 31
Notes to the Schedule
The schedule will present 10 years of information once it is accumulated.
JULY 31
Sum ofactuarialvalueatbeginningofyearand the cash flow during the yearplus the assumedinvestmentreturn,adjustedby 10%of the amountsthat the valueexceedsor is lessthan the marketvalueat the endof the year. The actuarialvalue is
Remainingamortizationperiodvaries forthe bases, with a net effective amortization period of 10 years.
The schedule will present 10 years of information once it is accumulated.
Vehicle Excise Tax Fund – This fund is used to account for revenues from an excise tax on rental motor vehicles, which must be used for the promotion of recreation, tourism and commerce and for the construction or repair of related facilities.
Confiscated Assets Fund – This fund is used to account for cash received either as a result of a cash confiscation or from the sale of capital assets acquired from a drug raid.
Hotel/Motel Tax Fund – This fund is used to account for hotel/motel taxes collected.
Veterans Memorial Park Fund – This fund is used to account for funds donated to the City for the design and construction of a Veterans Memorial, representing those persons from Fayette County, Georgia who have died in service of our country.
Cemetery Fund – This fund is used to account for revenues earned from a trust set up for cemetery improvements.
Downtown Development Authority Fund – This fund is used to account for downtown revitalization and preservation of the historic district.
Main Street Tourism Association Fund – This fund is used to account for revenues and expenditures associated with the promotion of tourism in the City of Fayetteville, Georgia.
Building Fund – This fund is used to account for the accumulation and expenditures of resources for various public improvements which are funded by a percentage of property taxes.
Impact Fee Fund – This fund is used to account for capital projects activity funded by development impact fees.
Capital Projects 2 Fund – This fund is used to account for the accumulation and expenditures of resources for various capital projects which are funded by a percentage of property taxes.
JULY 31, 2018
(Continued)
SCHEDULE OF REVENUES, EXPENDITURES AND CHANGES IN FUND BALANCES – BUDGET AND ACTUAL SPECIAL REVENUE FUNDS FOR THE FISCAL YEAR ENDED JULY 31, 2018
(Continued)
SCHEDULE OF REVENUES, EXPENDITURES AND CHANGES IN FUND BALANCES – BUDGET AND ACTUAL SPECIAL REVENUE FUNDS
FOR THE FISCAL YEAR ENDED JULY 31, 2018
SCHEDULE OF REVENUES, EXPENDITURES AND CHANGES IN FUND BALANCES – BUDGET AND ACTUAL SPECIAL REVENUE FUNDS FOR THE FISCAL YEAR ENDED JULY 31, 2018
SCHEDULE OF REVENUES, EXPENDITURES AND CHANGES IN FUND BALANCES – BUDGET AND ACTUAL SPECIAL REVENUE FUNDS FOR THE FISCAL YEAR ENDED JULY 31, 2018
(Continued)
CITY OF
SCHEDULE OF REVENUES, EXPENDITURES AND CHANGES IN FUND BALANCES – BUDGET AND ACTUAL CAPITAL PROJECTS FUNDS FOR THE FISCAL YEAR ENDED JULY 31, 2018
CAPITAL PROJECTS FUNDS FOR THE FISCAL YEAR ENDED JULY 31, 2018
SCHEDULE OF EXPENDITURES OF SPECIAL PURPOSE LOCAL OPTION SALES TAX PROCEEDS FOR THE FISCAL YEAR ENDED JULY 31, 2018
This part of the City of Fayetteville’s comprehensive financial report presents detailed information as a context for understanding what the information in the financial statements, note disclosures, and required supplementary information says about the City’s overall financial health.
contain information to help the reader assess the City’s most significant local revenue source, the property tax.
contain information to help the reader assess the affordability of the City’s current levels of outstanding debt and the City’s ability to issue additional debt in the future.
offer demographic and economic indicators to help the reader understand the environment within which the City’s financial activities take place.
These schedules contain service and infrastructure data to help the reader understand how the information in the City’s financial report relates to the services the City provides and the activities it performs.
Sources: Unless otherwise noted, the information in these schedules is derived from the comprehensive financial reports for the relevant year.
NET POSITION BY COMPONENT
(ACCRUAL BASIS OF ACCOUNTING)
FAYETTEVILLE, GEORGIA
LAST TEN FISCAL YEARS
(3) Reclassification of impact fees (program revenues) from public works to housing and development.
(4) Multiple transportation and sidewalk construction projects.
(5) State of Georgia Local Assistance Road Program (LARP) for street maintenance.
(6) Decrease in residential and commercial building; therefore, decrease in impact fees collected.
(8) Drastic decrease in interest rates due to the current economic recession.
(12) Public Safety SAFER grant received by the City.
(13) Renewed contractual services through RFP and bid process, resulting in lower cost.
(14) One time payment for prior years rent owed on downtown tower.
(15) Veterans Memorial Park Fund opened.
GOVERNMENTAL ACTIVITIES TAX REVENUES BY SOURCE LAST TEN FISCAL YEARS (ACCRUAL BASIS OF ACCOUNTING)
(1) Beginning in 2009, Special Purpose Local Option Sales Taxes received from the County were reclassified as Capital Contributions.
FUND BALANCES OF GOVERNMENTAL FUNDS LAST TEN FISCAL YEARS
(MODIFIED ACCRUAL BASIS OF ACCOUNTING)
CHANGES IN FUND BALANCES OF GOVERNMENTAL FUNDS
LAST TEN FISCAL YEARS (MODIFIED ACCRUAL BASIS OF ACCOUNTING)
(5) The decrease in impact fees and permits is due to the continual decline in new construction during fiscal
years 2009 and 2010.
(6) The City received a federal grant for Downtown Pedestrian Improvements.
(8) Drastic decrease in interest rates due to the current economic recession.
(9) Costs associated with the Downtown Pedestrian Improvements project and other transportation and sidewalk projects.
(10) Beginning in 2009, Special Purpose Local Option Sales Taxes received from the County were reclassified as Intergovernmental revenues.
(11) Increase in fine fees and confiscated assets.
(12) Collection adjustment of tower rental.
(13) No major cost associated with transportation or sidewalk projects.
(14) The City has received several grants for transportation and sidewalk projects.
(15) Cost associated with transportation and sidewalk projects.
(16) Veterans Memorial Park Fund opened.
(2) Beginning in 2009, Special Purpose Local Option Sales Taxes received from the County were reclassified as
intergovernmental revenues.
ASSESSED VALUE AND ESTIMATED ACTUAL VALUE OF TAXABLE PROPERTY LAST TEN FISCAL YEARS
SOURCE: City of Fayetteville, Georgia and Fayette County, Georgia tax records.
(1) Includes heavy duty equipment, timber, and conservation use.
(2) State of Georgia requires 40% assessment of actual value.
PROPERTY TAX RATES
DIRECT AND OVERLAPPING GOVERNMENTS (PER $1,000 OF ASSESSED VALUE) LAST TEN FISCAL YEARS
SOURCE: City of Fayetteville, Georgia and Fayette County, Georgia tax records.
WATER SOLD BY CUSTOMER TYPE LAST TEN FISCAL YEARS (MILLIONS OF GALLONS)
Fiscal Year
TEN FISCAL YEARS
Water (Residential)
Water (Commercial)
SOURCE: City of Fayetteville, Georgia ordinances.
RATIOS OF OUTSTANDING DEBT BY TYPE LAST TEN FISCAL YEARS
Governmental Activities
NOTES:
Details regarding the City's outstanding debt can be found in the notes to the financial statements.
(1) See the Schedule of Demographic and Economic Statistics for personal income and population data.
(2) Due tothe implementationof GASB 61, the DowntownDevelopmentAuthority was changed from a discretelypresentedcomponentunit to a blendedcomponentunitand the relateddebtbecamepart of the primary government in fiscal year 2013.
SOURCES:
Fayette County School District and Fayette County Public Facilities Authority.
NOTE:
Overlappinggovernments are thosethatcoincide,atleast in part, with the geographicboundariesof the City. This schedule estimates the portionof the outstandingdebtofthoseoverlappinggovernmentsthat is borneby the residentsandbusinesses of the City ofFayetteville. This processrecognizes that, whenconsidering the City's ability to issue andrepaylong-termdebt, the entiredebtburdenbornebyresidentsandbusinessesshouldbetaken into account.However, this doesnot imply that every taxpayer is a resident, and therefore responsible for repaying the debt of each overlapping government.
(1) The percentageofoverlappingdebtapplicable is estimatedusingtaxable assessed propertyvalues.Applicable percentages were estimatedbydetermining the portionof the County'staxable assessed valuethat iswithin the City's boundaries and dividing it by the County's total taxable assessed value.
NOTE:
UnderGeorgia law, the City ofFayetteville'soutstandinggeneralobligationdebt shouldnotexceed10%of total assessed propertyvalue. By law, the general obligationdebtsubject tothe limitation maybe offset byamountssetaside for repaying the general obligation bonds.
NOTES:
Details regarding the City's outstanding debt can be found in the notes to the financial statements. Utility service charges include tap fees, but exclude interest. Operating expenses do not include interest, depreciation, or amortization expense.
WATER SUPPLY BY SOURCE LAST TEN CALENDAR YEARS (IN THOUSAND GALLONS)
Fayette County System Well/Water Plant
Note:
The City's sewerage systemconsists of a modernsecondarywastewatertreatment facility, twenty-four(24) pumpingstationsandapproximatelyonehundred twenty-two (122) miles ofcollectorandtransmission lines. The Whitewater Creek wastewater treatment plant was expanded and upgraded in 1992 to 3.75 MGC and in 2008 to 5.0 MGC through 2003 Water and Sewer Bonds and a GEFA Loan.
SOURCE: City of Fayetteville, Georgia records.
WATER AND SEWER CUSTOMERS LAST TEN CALENDAR YEARS
In accordance with the requirements of Rule 15c-2-12 promulgated by the Securities and Exchange Commission (“SEC”), the City has covenanted to disclose the following annual financial information.
User fees are set by the Mayor and Council to recover independently the cost of providing water and sewerage service, to pay principal and interest on debt obligations of the System and to general reserves for emergencies and expansion of the System. The Mayor and Council last adopted a schedule for rates, tolls, assessments and fees charged by the System in August 2009. The City has covenanted in the Ordinance to revise and adjust such schedules of rates, fees and charges for water sewerage services and facilities to the extent necessary to produce funds at least equal to the amount necessary to: (1) operate and maintain the System on a sound businesslike basis but before provision for depreciation or am ortization; (2) produce an amount equal to 115% of the Debt Service Requirement for the then current Sinking Fund Year; (3) create and maintain in the Debt Service Reserve Fund an amount equal to the Debt Service Reserve Requirement; and (4) make the payments then required to be made into the Renewal and Extension Fund.
The minimum water and sewer bill is based on the first 2,000 gallons of water usage. In addition to the charges for water and sewerage usage, the City charges a connection fee for new water and sewer services based upon the size of water meter as indicated in the following table:
Based on the current rate structure and average residential water of usage of 6,500 gallons per month, the average water bill for a residential customer is approximately $30.97 per month. The average residential sewer bill is approximately $33.03 per month.
We have audited, in accordance with the auditing standards generally accepted in the United States of America and the standards applicable to financial audits contained in Government Auditing Standards, issued by the Comptroller General of the United States, the financial statements of the governmental activities, the business-type activities, each major fund, and the aggregate remaining fund information of the City of Fayetteville, Georgia (the “City”) for the year ended July 31, 2018, and the related notes to the financial statements, which collectively comprise the City’s basic financial statements and have issued our report thereon dated January 25, 2019.
In planning and performing our audit of the financial statements, we considered the City of Fayetteville, Georgia’s internal control over financial reporting (internal control) to determine the audit procedures that are appropriate in the circumstances for the purpose of expressing our opinions on the financial statements, but not for the purpose of expressing an opinion on the effectiveness of the City’s internal control. Accordingly, we do not express an opinion on the effectiveness of the City’s internal control
A deficiency in internal control exists when the design or operation of a control does not allow management or employees, in the normal course of performing their assigned functions, to prevent, or detect and correct misstatements on a timely basis. A material weakness is a deficiency, or a com bination of deficiencies, in internal control such that there is a reasonable possibility that a material misstatement of the entity’s financial statements will not be prevented, or detected and corrected on a timely basis. A significant deficiency is a deficiency, or a combination of deficiencies, in internal control that is less severe than a material weakness, yet important enough to merit attention by those charged with governance.
Our consideration of internal control was for the limited purpose described in the first paragraph of this section and was not designed to identify all deficiencies in internal control that might be material weaknesses or significant deficiencies. Given these limitations, during our audit we did not identify any deficiencies in internal control that we consider to be material weaknesses. However, material weaknesses may exist that have not been identified.
As part of obtaining reasonable assurance about whether the City’s financial statements are free from material misstatement, we performed tests of its compliance with certain provisions of laws, regulations, contracts and grant agreements, noncompliance with which could have a direct and material effect on the determination of financial statement amounts. However, providing an opinion on compliance with those provisions was not an objective of our audit, and accordingly, we do not express such an opinion. The results of our tests disclosed no instances of noncompliance or other matters that are required to be reported under Government Auditing Standards.
The purpose of this report is solely to describe the scope of our testing of internal control and compliance and the results of that testing, and not to provide an opinion on the effectiveness of the entity’s internal control or on compliance. This report is an integral part of an audit performed in accordance with Government Auditing Standards in considering the entity’s internal control and compliance. Accordingly, this communication is not suitable for any other purpose.
Macon, Georgia
January 25, 2019
There was not an audit of major federal award programs due to the amount expended on federal programs being less than $750,000.
None reported.
SCHEDULE OF FINDINGS AND RESPONSES FOR THE FISCAL YEAR ENDED JULY 31, 2018
SECTION II
FINANCIAL STATEMENT FINDINGS AND RESPONSES
SECTION III
FEDERAL AWARDS FINDINGS AND QUESTIONED COSTS
Not applicable.
None reported.
SUMMARY SCHEDULE OF PRIOR YEAR FINDINGS FOR THE FISCAL YEAR ENDED JULY 31, 2017
STATUS OF PRIOR YEAR AUDIT FINDINGS
