
Closing the sustainable infrastructure gap to achieve net zero June 2023

FIDIC (International Federation of Consulting Engineers) celebrates its 110th anniversary in 2023 and throughout its history has been the voice of the consulting engineering industry in a globalised world. Over the past century, there have been many challenges, but it’s fair to say climate change may be the most significant one to date.
Populations and regions across the globe continue to struggle for food, clean water and even survival: the survival of the planet. Technical solutions alone are insufficient in the broader discussions on effective governance and restricted finance.
FIDIC stakeholders have a substantial impact on the infrastructure sector globally and raising the bar on how we work to decarbonise the infrastructure sector in all life cycle phases of projects that can have a real impact towards staying within a 1.5°C temperature rise as per the Paris Agreement.
Consulting engineers have made a truly significant impact on society worldwide. Innovative advances in transport, water supply, energy, buildings and critical national infrastructure have all led to improved health and economic development and hence a much better life for all. It also highlights that whilst significant investment is required globally, emerging economies still tend to be disproportionally at risk from the adverse impacts of climate change. This is largely because households often live in areas more exposed to climate risks such as flooding, drought or extreme weather events.
Meeting the climate challenge will involve the entire infrastructure sector and will be reliant on customers, clients, companies, professions and governments all working towards the same goal. If we stand still, we are not progressing as the world will continue to evolve around us.
FIDIC was delighted to welcome EY as a strategic partner to the Global Leadership Forum (GLF) who helped prepare and present this report. The paths it outlines towards net zero, the significant scale of investment and the recommendations, show how much we must do to achieve a sustainable and net zero future. We in FIDIC are proud to make our own commitments to drive this forward.

We are delighted to have been the strategic partner of FIDIC for the GLF and to have presented this report at the Forum’s Summit in April 2023 in Geneva, Switzerland. At this event, members from the global infrastructure community considered the pathways to delivering net zero and reducing climate change to 1.5°C.
At EY, our purpose is to build a better working world. Critical to the world we live in is our ability to sustain the planet and reduce the impact of man-made global warming. The current policies from governments around the world are mobilising huge investment to address the challenge, with USD 75 trillion expected to be spent between 2020 and 2050. However, this level of investment is not nearly enough, with emissions still expected to rise globally by 15 gigatons CO2e by 2050, a 30% increase compared with today. This report highlights that USD 139 trillion will have to be invested in sustainable infrastructure projects to achieve net zero
This report answers four key questions:
1. What is the gap in sustainable infrastructure funding required to achieve net zero?
2. What are the required changes in net zero sustainable infrastructure investment by region and sector?
3. What are the recommendations to close this gap?
4. What commitments has the GLF made to drive progress?
I would like to thank everyone at the FIDIC and the Global Leadership Forum Think Tank steering group: Malani Padayachee−Saman (MPAMOT), Fidel Saenz de Ormijana (Ferrovial), Jim Johnson (Arup), Graham Pontin (FIDIC) and Sara Lipscombe (FIDIC). And a special thanks, to Dr Nelson Ogunshakin, whose leadership in drawing together the forum and setting out the challenges is an inspiration to us at EY. Many thanks to all the delegates at the GLF Summit for their enthusiastic engagement with the findings and leading on making commitments, which have been reflected in this report. And, finally, my own EY team that have supported its delivery throughout.
Ultimately, our challenge as a global infrastructure community is to take the most efficient carbon reduction projects in energy and transport, and scale up global delivery.


Executive summary Pg 06
03
04
What are the required changes in net zero sustainable infrastructure investment by region and sector? Pg 16 06
What are the recommendations to close the infrastructure gap? Pg 30
05
What commitments has the GLF made to drive progress? Pg 36
Conclusion Pg 39
What is the gap in sustainable infrastructure funding required to achieve net zero? Pg 08 07 08 Acknowledgements and thanks Pg 40 Appendix Pg 42

How can the engineering sector effectively contribute to helping the global economy decarbonise and reduce the most devastating impacts of climate change? Every area of government and business has a part to play in achieving global net zero targets. Investing in, building, and operating new sustainable infrastructure by governments, businesses and individuals lies at the very heart of decarbonisation.
economies. To ensure we reach the Intergovernmental Panel on Climate Change (IPCC) target of 1.5°C by 2100, emissions must decline by 45% (relative to 2010 levels) by 2030, reaching net zero by 2050.
Under current governmental decarbonisation policies, sustainable infrastructure investment is estimated to remain at around USD 2 trillion per year with cumulative investment between 2020 and 2050 totalling around USD 75 trillion.
Clearly, the need to act is pressing and will only continue to grow as the effects of climate change take hold. Global greenhouse gas emissions have grown significantly since the second half of the 20th century with an accelerated rise from 1990 following the industrialisation of a number of emerging
This report answers four key questions:
What is the gap in sustainable infrastructure funding required to achieve net zero?
What are the required changes in net zero sustainable infrastructure investment by region and sector?
Our analysis shows that, cumulatively, USD 139 trillion needs to be invested in sustainable infrastructure to achieve net zero by 2050. This highlights a gap of USD 64 trillion compared with current investment policies. The USA, China, India, European Union 27 (EU27), and the UK require the largest increases in annual investment, although issues and challenges faced by individual countries will differ depending on their legacy infrastructure, and their ability to leverage different types of renewable energy and carbon capture or nature-based solutions.
To achieve an orderly transition, global annual spend on sustainable infrastructure will have to more than double within the next seven years from around USD 2 trillion per year to USD 5 trillion per year by 2030. Delaying the transition to net zero will require an even higher ramp-up of global investment to USD 7 trillion per year to avoid the worst impacts of climate change.
By far the largest sector where investment will need to be targeted is the electrification of the global energy supply (62% or USD 86 trillion of the USD 139 trillion). The remaining investment will be directed towards decarbonising heavy industry, such as steel, as well as investment into the transportation system and retrofitting buildings to make them more energy efficient.
What are the recommendations to close the infrastructure gap?
This is significant but still insufficient and, as this report reveals, this is only 53% of the investment required to reach net zero. Emissions are still expected to rise by a further 30% by 2050 under current policies, breaching the 1.5°C carbon budget within the next eight years, and the 2°C carbon budget before 2050. 1 2 3 4
What commitments has the GLF made to drive progress?
Five recommendations were submitted to the FIDIC GLF for consideration to close this gap and commitments made on each:
1. Establish a new grading scale to rate the sustainability of infrastructure projects worldwide.
2. Define a clear pathway to achieve net zero in each country and prioritise projects where maximum emission reductions can be achieved.
3. Establish a global repository of successful project case studies to share learning and help accelerate project initiation worldwide.
4. Create a global funding platform to match funding opportunities for infrastructure projects in emerging economies – and build confidence and capacity in their governance.
5. Champion a sustainable financing ecosystem to influence policymakers and attract more private investors to accelerate project delivery.
By advocating and acting now, the engineering and wider infrastructure community can play a crucial role in defining a clear investible pipeline of the most climate-impactful projects, with inbuilt resilience, and helping policy makers match-make investors and rapidly accelerate project initiation.
This report includes commitments made by the GLF to help ensure genuine change based on these recommendations happens.
What is the gap in infrastructure funding required to achieve net zero?

Climate change is the defining challenge of our time. Sustainable infrastructure will be critical in the race to decarbonise but currently lacks the necessary funding.
Global greenhouse gas emissions have grown significantly since the second half of the 20th century with an accelerated rise from 1990 following the industrialisation of a number of emerging economies. As emissions continue to rise, the physical impacts of climate change, such as extreme weather events, are becoming increasingly evident, and these impacts are unevenly felt across the globe.
As agreed in the United Nations Climate Change Conference (COP 21) in 2015, known as the Paris Agreement, global temperatures must be limited to well below 2°C above pre-industrial levels, and ideally limited to 1.5°C. This is because the IPCC indicates that crossing the 1.5°C threshold risks unleashing far more severe climate change impacts,
which would result in significant impacts on livelihoods, existing infrastructure and wider communities. However, current global emission reductions policies1 will not meet this target, and we are rapidly approaching the maximum allowable ‘carbon budget’2 that can keep the hope of 1.5°C alive.
Today, annual greenhouse gas emissions are estimated at over 50 billion tonnes per year (gigatons or Gt) globally – over 1,500 tonnes per second. In order to ensure we reach the IPCC target of 1.5°C by 2100, emissions must decline by 45% (relative to 2010 levels) by 2030, reaching net zero by 2050. If we remain on our current pathway, we will reach our carbon budget for 1.5°C within the next eight years, and our carbon budget for 2.0°C before 2050, drastically increasing the probability of irreversible climate change.
Over 50% of all global emissions are accounted for by five regions: the USA, China, India, EU27 and the UK, whereas the lowest 100 emitting countries contribute just 3% of total emissions.3 China is the world’s largest emitter of greenhouse gases following its exponential economic growth from the late 1990s and its reliance on coal to power its economy. China accounted for just under 30% of global manufacturing in 2019, of which a significant share relates to the manufacturing centres producing goods for export and imports to western countries. Therefore, a considerable proportion of China’s 13 Gt of greenhouse gas emissions have been driven by other regions across the world.
Although China makes up nearly 30% of total global annual emissions, when looking at emissions per capita, the USA ranks significantly higher. This trend is consistent across developed economies where emissions per capita can be up to 55 tonnes of CO2 per year4 in the top income decile. This is notably different in emerging economies – in China, emissions per capita are around nine tonnes and in India, they are just over two tonnes. As people in developing nations are lifted out of poverty, we will see an increase in energy, fuel consumption and emissions per capita.
** A gigaton represents one billion tons. CO2 represents around 75% of global greenhouse gas emissions. Other greenhouse gases (e.g. methane) are calculated on a CO2 equivalent basis (CO2e)
An increasing focus on reducing inequality is highlighted within the United Nations Sustainable Development Goals (SDGs). Goal 10 relates to reducing inequality within and among countries so that by 2030, income growth of the bottom 40% of the population is at a rate higher than the national average. Without intervention, as emerging economies begin
1. Current policies refer to the emissions trajectory implied by today’s implemented policies. This is a conservative benchmark that considers climate goals announced by governments, but does not take for granted that all economies will reach these goals where they require major reforms, i.e. it does not take into account the impact of announced policies which are yet to be implemented.
2. The carbon budget is the maximum amount of cumulative net global anthropogenic carbon dioxide (CO2) emissions that would result in limiting global warming to a given level with a given probability. The overarching goal of the Paris Agreement was to hold the increase in global average temperature to well below 2°C above pre-industrial levels and pursue efforts to limit the temperature increase to 1.5°C above pre-industrial levels. However, in recent years, world leaders have stressed the need to limit global warming to 1.5°C by the end of this century.
3. “World’s Top Emitters Interactive Chart”, World Resources Institute, www.wri.org
4.“The world’s top 1% of emitters produce over 1000 times more CO2 than the bottom 1%”, International Energy Agency, www.iea.org
to develop and living standards improve, emissions per capita are expected to increase as a result of increased energy and fuel consumption. This highlights a significant challenge for the global economy.
Historically, emissions have been intrinsically linked to economic growth across both advanced and emerging economies. Although emissions intensity5 is improving, there is still a clear link between growth in gross domestic product (GDP) and greenhouse gas emissions.
The transition to net zero will follow different paths across regions. The issues and challenges faced by individual countries will differ depending on their legacy infrastructure, and their ability to leverage different types of renewable energy and carbon capture or nature−based solutions. The focus in advanced economies will be around decarbonising existing infrastructure to reduce the currently high emissions intensity. Contrastingly, emerging economies must focus on effective low carbon growth that improves the lives of their citizens while also helping achieve net zero globally. That will depend on government-led incentives and substantial financial assistance and investment in new sustainable, low carbon infrastructure.
Sustainable infrastructure investment refers to the capital expenditure required to decarbonise the energy supply, transport systems, buildings and infrastructure and other fossil fuel-emitting sectors. It is central to a net zero global economy and achieving the world’s climate and development goals. As such, it will require a significant investment to transform energy systems, supply chains and infrastructure systems across the world. Under current decarbonisation policies, and in line with the International Energy Agency's (IEA) World Energy Outlook, sustainable infrastructure investment is estimated to remain at around USD 2 trillion per year from 2020 to 2050 with cumulative investment across the whole period to 2050 totalling around USD 75 trillion. Current global investment consists of USD 33.5 trillion of investment in advanced economies (including the USA, the EU27 and the UK) and USD 41.5 trillion in emerging economies (including China, India, and Africa amongst others). Our analysis has disaggregated the global investment figures to indicate investment by region and sector in Section 3 of this report.
The majority of this investment will be directed towards the development of new physical assets in the energy sector, such as grid infrastructure, renewable generation and battery storage.
Current policies unlock USD 75 trillion6 of sustainable infrastructure investment to enable the transition to net zero.5. Emissions intensity here refers to greenhouse gas emissions as a proportion of gross domestic product (GDP).
Major global markets have made commitments to decarbonise their economies to help achieve the 1.5°C target, with up to 1,521 sustainable energy projects announced in 2021 – more than 3.5 times the number of projects launched a decade ago. The majority of current policies are government-led commitments that aim to incentivise future private sector investment. These policies tackle decarbonisation across energy, transport and industrial sectors, including:
• The European Green Deal Investment Plan will mobilise at least USD 1 trillion for sustainable investments over the next 10 years.
• The UK National Infrastructure and Construction Pipeline could lead to USD 890 billion being spent on UK priority infrastructure projects over the next 10 years.
• The USA's Inflation Reduction Act has committed USD 400 billion in federal funding to deliver clean energy.
• The Government of Canada has launched a CAD 8 billion Net-Zero Accelerator Initiative to help large emitters reduce their emissions.
• China has prioritised fast, public charging infrastructure through local subsidies to support its expanding commercial electric vehicles (EVs) fleet.
• Under the Technology Investment Roadmap, the Australian government has committed to investing AUD 20 billion into low emissions technologies over the next decade, hoping to unlock AUD 80 billion of private and public investment.

Even if the investment plans stated within current government policies are all achieved, global emissions will still rise by 15 Gt CO2e by 2050, a 30% increase compared with today. At present, the projected investment in sustainable infrastructure between now and 2050 is only 53% of what is required to reach net zero. It is imperative that significant further action is taken to rapidly incentivise global investment into clean energy.
Current policies need to be rapidly revisited to reduce CO2 emissions as quickly as possible to achieve an orderly transition to net zero.
Reaching the 1.5°C target requires global emissions to fall to around 20 Gt per year by 20507. The current commitments and policies in place to decarbonise the global economy are not substantial enough to close this emissions gap.
There is a USD 64 trillion funding gap between current policies and the policies required to deliver net zero by 2050.
To achieve global net zero, up to USD 139 trillion of investment is required globally by 2050. The funding gap is estimated at around USD 64 trillion, and reaching net zero will require more than doubling annual spend on sustainable infrastructure, from around USD 2 trillion per year to USD 5 trillion per year within the next seven years.
Since 2020, countries have been submitting their national climate action plans, known as nationally determined contributions (NDCs). If implemented effectively, these NDCs could bridge a proportion of the current USD 64 trillion funding gap according to a recent United Nations Environment Programme (UNEP) Emissions Gap Report. However,
most of these commitments are yet to be translated into implementation plans, and the current policies in place are insufficient to reach the 2050 goals.
The IEA estimates that over 70% of investment into clean energy will need to come from private sources8. This will require governments and firms to provide incentives to investors across the globe to rapidly reallocate and increase capital investment away from fossil fuels into sustainable infrastructure. Today, just under USD 1 trillion is invested in fossil fuel industries each year across the globe and fossil fuel subsidies continue to rise. Analysis by the Organisation for Economic Co-operation and Development (OECD) and IEA shows that overall government support for fossil fuels in 51 countries worldwide rose up to USD 697 billion in 2021 from USD 362 billion in 20209
In a net zero scenario, this investment will need to be redirected towards sustainable infrastructure to decarbonise the energy supply.
A shift away from investment into coal, oil and gas and towards clean energy will free up around USD 0.7 trillion of annual investment towards the funding gap. On top of
this, there will be a degree of natural substitution away from carbon-intensive industries which will support the funding gap. The natural replacement of vehicles at the end of their useful life is an example of this, where firms will replace internal combustion engine (ICE) vehicles EVs for a small incremental cost.
There is a USD 7 trillion per year risk in delaying the low carbon transition.
An orderly transition to net zero assumes that investment in clean energy almost doubles within the next six years. Progress towards decarbonisation is improving, but such an extensive, transformational change currently seems challenging. Delaying the transition does not change our remaining carbon budget, it simply reduces the time we have to decarbonise and creates significant
investment challenges due the need to accelerate decarbonisation.
If we were to wait until 2030 to begin decarbonising, the implied emissions pathway shows that a rapid reduction in emissions is required to ensure that the same aggregate level of CO2 is emitted by 2050. Under a delayed transition, assuming the total investment required to reach net zero remains the same, the annual cost of the transition could grow to USD 7 trillion at its peak.
In addition to funding constraints, there are other constraints that could inhibit rapid transition in the event that it is delayed.
Aside from an increase in annual investment required under a delayed transition, deferring decarbonisation until post 2030 is also likely to result in political challenges, economic disruption, and supply chain issues.10
Rapid decarbonisation will include the need for more politically unpalatable policy decisions.
Carbon pricing policies are the most common solution to disincentivise fossil fuel investment, internalising the cost of emitting carbon. These will be higher under delayed transition.
Increasing taxes and other policies to reduce carbon emissions are likely to be politically unfavourable due to the costs associated with them, including the increased labour costs.
Rapid growth in some sectors of the economy and the rapid decline in others will bring significant economic disruption. The increased annual invesment needed may require governments to support the transition to a greater extent and may lead to increased public debt.
Continued investment in fossil fuels between now and 2030 will lead to an increased risk of assets being abandoned before they reach the end of their useful life, known as asset stranding.
Rapid decarbonisation will likely include the need for more politically unpalatable policy decisions. Governments will have to establish wide-ranging carbon pricing policies as these are the most common solution to disincentivise fossil fuel investment by internalising the cost of emitting carbon. These are likely to be higher and more volatile given the increased urgency to decarbonise under delayed transition. Worker ethics and increased labour supply costs in manufacturing industries may also impact investors’ appetite to shift investment away from carbon-intensive regions. All governments will have to consider the increased costs associated with moving manufacturing when determining policy changes.
Rapid growth in some sectors of the economy and the rapid decline in others will bring significant economic disruption. The increased annual investment needed may require governments to support the transition to a greater extent and may lead to increased public debt. Continued investment in fossil fuel industries between now and 2030 will lead to an increased risk of assets being abandoned
Rapid decarbonisation will require industries to adapt to new low carbon supply chains within a limited time frame.
Availability of minerals, raw materials and capital will be dependent on industries ability to cope with an exponential increase in demand, that may be impossible to meet and subsequently come at a short-term cost to businesses.
There is also likely to be skills shortages caused by the demand for skilled ethical labour in sustainable infrastructure technologies exceeding the supply.
before they are at the end of their useful life. The IPCC’s Sixth Assessment Report11 states that the world’s existing fossil fuel infrastructure, as already built and financed, could generate a further 850 Gt of emissions – 550 Gt greater than our carbon budget. Any further carbon-intensive infrastructure development would push us towards our maximum carbon budget and create more issues for investors.
An accelerated transition will also require industries to create and adapt to new low carbon supply chains within a limited time frame. Availability of minerals, raw materials and capital will be dependent on industries ability to cope with an exponential increase in demand and may come at a short-term cost to businesses. A rapid acceleration in clean energy could, on one hand lead to demand for skilled labour exceeding supply causing potential delays, disruption and cost increases. On the other hand, for those working in sectors negatively impacted by the rapid transition, there may be a sudden drop in demand for their skills, leading to an increased risk of unemployment.
10. These issues are not directly addressed further in this report and will need to be subject to further study. 11. “Climate Change 2022: Mitigation of Climate Change”, Intergovernmental Panel on Climate Change, IPCC Sixth Assessment Report, The Working Group III, https://www.ipcc.ch
What are the required changes in net zero sustainable infrastructure investment by region and sector?

The largest component of the total required infrastructure investment is in the global energy supply, which requires USD 86 trillion of total investment.
Electrification will be the largest structural shift in global energy supply and therefore makes up the largest component of total required investment to reach net zero − an estimated USD 86 trillion between now and 2050. The IEA anticipates that over 50% of the total final energy consumption will come from electricity by 2050, and this will require a shift in production of electricity towards renewable sources, such as wind, solar and
nuclear, as well as extensive investment in transmission and distribution grid infrastructure.
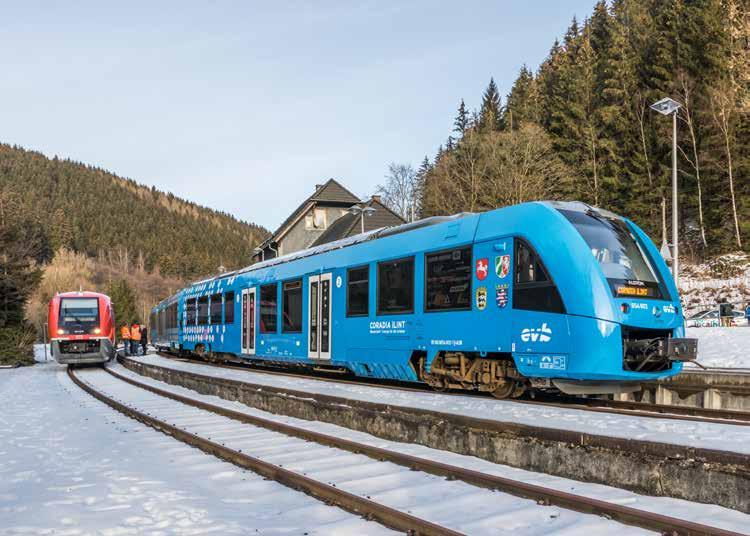
The remaining investment will be directed towards decarbonising heavy industry, such as steel, as well as investment into the transportation system and retrofitting buildings to make them more energy efficient. Between now and 2050, the investment mix will shift so that a greater proportion of total investment is directed towards transportation. This is due to the requirement to electrify global transport systems under net zero, and the subsequent infrastructure required to support EVs and charging infrastructure rollout, as well as battery storage technologies and clean aviation fuels.
Achieving the USD 5 trillion annual investment globally will require countries and regions to significantly increase their current spend.
To reach net zero by 2050, worldwide investment will need to dramatically increase. However, the size of this increase will vary by region. The largest proportion of investment will need to come from regions categorised in this report as “rest of the world”, including countries in Africa, South America and Asia, amongst others. The single largest
investment increase required by one region is China, with its annual investment by 2050 making up over 25% of the global total. Remaining regions, including the USA, EU27, UK and India will also require substantial increases in investment. In addition, it is essential to streamline the existing funding and better coordination is needed between federal and state authorities, especially in countries such as the USA where states have a high degree of autonomy over the disbursal of funds received from federal programmes.
The USA, EU27 and the UK will be required to invest up to 1.7 trillion per year to reach net zero.
Combined emissions from the USA, the EU27 and the UK make up just under 20% of total global emissions. Reaching net zero will require the USA to increase its annual investment from around USD 357 billion per year to up to USD 724 billion per year. Similarly, in the EU27 and the UK combined, annual investment is around USD 380 billion per year and will need to increase to USD 971 billion per year.
Within the EU27 and UK, the majority of investment will be directed towards the energy sector, with up to USD 1 trillion of annual investment required by 2050. Reaching net zero will require these regions to decarbonise their energy supplies through electrification and widespread investment into low-emission fuels such as hydrogen.
It is expected that in a net zero scenario, the majority of low-emission hydrogen will be produced through the electrolysis of water by renewable electricity or fossil fuels with carbon capture, utilisation and storage (CCUS). The cost of renewable energy sources has substantially decreased in recent years as solar and wind power have become
more commercially viable − the price of solar PV12 units has decreased by over 80% since 201013, and the cost of electricity from these units fell by 69%. The key challenge faced by renewable electricity providers is guaranteeing the security of energy to provide the base load14 required, as well as changing peak load15 demand throughout the day. Additionally, suppliers will face challenges around inter-day and daily balancing of electricity unless further funding is invested into increasing interconnection between regions to allow greater flow of supply.
There will also need to be a significant increase in investment to decarbonise the transport sector, with up to USD 248 billion of annual investment required by 2050 in the USA, the EU27 and UK combined. Decarbonising the transport sector relies on switching fuel supplies away from oil to electricity, specifically replacing ICE vehicles with EVs, as well as tackling carbon emissions from aviation and shipping through investment into low-emission fuels.
To shift demand away from ICE vehicles towards EVs, it is essential that public charging infrastructure is in place and investment into battery technology increases. Over the past decade, investment in battery technology has grown year on year due to a steady decline in costs led by innovation
in the sector. This investment will need to continually rise to match the demand for EVs and batteries in the net zero scenario. This will require investment and innovation throughout the supply chain, including improving battery plant capacity and developing less energy intensive lithium extraction processes.
A further USD 140 billion of annual investment into industry will be required between the three regions to stimulate a transfer away from fossil fuel intensive manufacturing into low-emissions industrial goods. Policies in the EU27 have already started to tackle the issue. Germany, for example, has committed to creating contracts for difference (CfDs) that help companies in steel, cement, lime, and ammonia industries access low-cost electricity from renewable sources in the medium term16
Within advanced countries such as the USA, throughout the EU27, and UK, investment will be needed to support the retrofitting of existing buildings to improve energy efficiency and provide new heating and cooling systems such as heat pumps and renewable heating infrastructure. The UK Climate Change Committee’s Sixth Carbon Budget estimates the additional investment in buildings renovations will need to amount to 0.4% of GDP by 203517
12. Solar Photovoltaics relate to the conversion of sunlight into electricity using semiconducting materials that exhibit the photovoltaic effect.

13. “Renewable Power Generation Costs in 2020”, International Renewable Energy Agency, www.irena.org
14. Base load refers to the minimum level of electricity demand required over a period of 24 hours needed to provide power to components that keep running at all times.
15. Peak load refers to the time of high energy demand. This is usually a spike over a shorter period than base load.
16. “Renewing prosperity in a climate-neutral way”, Immediate Climate Action Programme, Federal Ministry of Economic Affairs and Climate Action, www.bmwk.de
17. “Sixth Carbon Budget”, Climate Change Committee, www.theccc.org.uk
The USA, the EU27 and the UK need to unlock additional funding sources, streamline disbursal of those funds and refine their sustainable finance systems.
The US federal government needs to more than double its spending to cover the projected investment gap in sustainable infrastructure. This needs to be accomplished by a combination of issuing financial instruments and policy
interventions which can include, but are not limited to, additional taxation and adjusting carbon pricing mechanisms. Current government initiatives such as the Inflation Reduction Act (IRA) and Infrastructure Investment and Jobs Act (IIJA) are planned to provide significant funding for sustainable infrastructure projects. However, these are still insufficient to cover the investment gap required to meet the USA net zero target − projected to be a cumulative total of over USD 10 trillion between 2020 to 2050.
The USA should consider the following measures to reduce the sustainable infrastructure investment deficit:
1. Introduce policy interventions to improve attractiveness of sustainable infrastructure: Policy intervention to implement carbon pricing will help make sustainable infrastructure comparatively more attractive, and offer more incentives to investors. Mechanisms to deliver faster approvals of sustainable grants, loans and issuance of bonds to avoid cost escalations for sustainable infrastructure projects would facilitate this, as would the introduction of tax rebates and subsidies for small investors to participate in sustainability-linked bonds.
2. Expand scope of projects covered under federal grants: Sustainable infrastructure projects can be included in local-level programmes that are already
recipients of federal funding, such as transportation or disaster recovery projects. Local governments can improve their chances of obtaining access to more federal funding by designing sustainable infrastructure projects that maximise co-benefits for communities including improvements in air quality and public health, increased climate resilience, opportunities for community recreation and enhanced community aesthetics.18
3. Define criteria for disbursal of funds by green banks: In 2022, the US Congress approved a Greenhouse Gas Reduction Fund (GGRF) to provide USD 27 billion for green banks at state and local levels to finance projects focusing on clean energy and transportation. Greater clarity in the criteria for disbursal of these funds – such as project eligibility, qualification and financial or technical viability – will greatly assist in facilitating their rapid implementation.19
18. “How to Pay for Green Infrastructure: Funding and Financing”, Georgetown Climate Center, www.georgetownclimate.org
19. “Green Banks Poised for Billions in Climate Funds, Draw States Attention”, The Pew Charitable Trusts, www.pewtrusts.org
Major economies in the EU27 have enacted various pieces of legislation and policy initiatives to provide financing for sustainable infrastructure projects. Prominent programmes include the France Relance recovery plan, Germany’s Energy Efficiency Strategy for Buildings, and Italy’s National Recovery and Resilience Plan. But despite these initiatives, the projected cumulative gap in sustainable infrastructure financing from 2020 to 2050 is estimated to be in excess of USD 12 trillion.
The scale of the projected investment gap presents a huge challenge for governments in the EU27 and the UK and a fundamental shift in investment patterns is required if the gap is to be filled in its entirety over the stipulated time frame. These are short to medium term measures which, though unlikely to bridge the entire gap, will help to close it:
1. Raising levels of carbon pricing and fuel taxes: Current levels of carbon pricing in several EU27 countries are inadequate. For example, the current EU Emission Trading Scheme (ETS) does not cover several carbon-intensive economic sectors such as transport and heating. Therefore, there is a need to expand the envelope of taxes on high-carbon products entering EU27, as well as raising taxes on domestic products emitting highest carbon during production.
2. Greater transparency in taxonomy rules: The EU’s sustainable taxonomy rules can better define structural, interpretative and technical issues linked to sustainable
investment. Uniformly accepted and unambiguous sustainable taxonomy rules would provide clearer and more consistent international definitions and are likely to help attract more private capital.
3. Including climate indicators in economic models: Doing so can help mitigate the impact of rising interest rates on return on investment (ROI) of sustainable projects, while also bringing greater certainty to estimated project costs. Incorporation of climate-related statistical indicators would facilitate diversion of corporate bond holdings towards issuers who have performed better on climate related parameters.20
China and India will be required to invest a total of USD 1.5 trillion each year to reach net zero by 2050.
Current investment in sustainable infrastructure in India is around USD 78 billion per year and is forecast to increase to USD 111 billion per year – this needs to increase to up to USD 260 billion per year to achieve net zero. On a much larger scale, current sustainable infrastructure investment in China is around USD 545 billion per year and is only forecast to increase to USD 546 billion per year – this needs to more than double to around USD 1.3 trillion per year to achieve net zero.21
20. “ECB publishes new climate-related statistical indicators to narrow climate data gap”, European Central Bank, www.ecb.europa.eu 21. Emissions in India only represent a quarter of the emissions in China, and therefore the total investment required is significantly less than China. However, the annual increase required in India still represents a nearly 200% rise from today’s levels.
The total investment required by China and India to reach net zero is expected to be around USD 1.3 trillion per year by 2050, of which over USD 1 trillion will be directed towards the energy sector. China and India have both faced rapid carbon-intensive growth since 1990 and both regions rely heavily on fossil fuels, especially coal, for their energy supply. Under current policies, there are limited signs of this declining, with investment in coal-fired power stations still growing in both regions. For example, in China, around USD 33 billion of investment in the coal-power and steel sectors was approved in the first half of 2022. However, China and India are both rapidly scaling up renewable energies. According to the IEA, as a result of the 14th Five-Year Plan, China is expected to account for almost half of new global renewable power capacity additions over the 2022 to 2027 period22
Additionally, urbanisation of both China and India, as well as other emerging economies has led to an increase in the number of buildings and therefore built floor area, in these regions. Decarbonising these economies will require each square metre of floor space to become increasingly energy efficient, a target further stretched by rising global temperatures requiring more effective cooling solutions in both commercial and residential buildings.
Investment in industry is the second largest component of total investment required to reach net zero, with up to USD 195 billion required per year by 2050. The majority of this investment needs to be focused on decarbonising heavy industry like steel. Up to 70% of global steel is produced using coal, of which 53% is produced in China alone. Stimulating the steel industry to decarbonise will require regions to implement incentives to invest in carbon capture, utilisation and storage (CCUS) and eventually fossil fuel-free production technologies.
A large proportion of emissions derived from these regions results from demand caused by exports to advanced economies. Decarbonising export markets in both China and India will require a reduction in fossil fuels and, simultaneously, a reduction in the demand for imported goods. This can be implemented through government policies such as carbon border adjustment taxes, which will increase the price of imports and therefore influence consumer and firm business behaviour. Carbon border adjustment taxes such as the Carbon Border Adjustment Mechanism (CBAM) in EU27 will incentivise exporting countries to decarbonise supply chains to maintain demand from importers, whereas the alternative will lead consumers to switch to cleaner, domestic industrial producers.
China is taking significant measures to implement policy initiatives such as the Ecological Civilization Construction Plan and the Energy Development Strategy Action Plan (2014-2020) to unlock financing for sustainable infrastructure projects. However, current efforts are unlikely to be sufficient to cover the projected investment gap. These measures can help unlock additional funding and help incrementally bridge the projected financing gap in China:
1. Enhancing sustainable finance initiatives: There is a need to upscale recently launched initiatives such as the carbon trading market and sustainable finance pilot zones across the country to unlock funding and help bridge the projected investment gap23. These initiatives can also help to address issues such as asymmetric information and a lack of analytical tools for sustainable investment.
2. Improved disclosure framework: Capital market reforms, such as a more transparent disclosure framework comprising third-party verification and data transparency norms, can help ease the process of issuance and trading of green bonds. This helps the bond market grow.
3. Creating regulatory frameworks that open access to wider funding sources: Policymakers can introduce a performance measurement system linked to ROI for institutions investing in sustainable infrastructure projects. This would enable participation within the country and help to attract foreign capital.
India has committed to meet its net zero target by 2070. As part of its endeavour to achieve this, the country has announced several initiatives such as the Jal Jeevan Mission and Green Hydrogen mission. It is estimated that despite current efforts, the cumulative gap in sustainable infrastructure investment between 2020 and 2050 is estimated to be close to USD 3 trillion.
These measures could unlock additional funding:
1. Establish a taxonomy to define sustainable investments: Currently there is a lack of a sustainable finance taxonomy in India. Establishing an integrated domestic measurement, reporting, and verification (MRV) system can help bring much needed clarity regarding classification of sustainable investments and facilitate greater investment flow to the sector.
2. Greater incentives for the sovereign green bond (SGB) market: India launched its inaugural green bond in 2023 with a USD 2 billion issue for sustainable projects. It needs to further incentivise them for foreign investors to expand the market and bridge the financing gap for sustainable infrastructure.
3. Improved data collection: Sustainable finance tracking in India faces multiple issues related to the availability, quality, and robustness of investment data in both public and private sectors. Improving data collection system and tagging of sustainable finance data points would help reduce information asymmetry, identify investment opportunities and attract capital earmarked for sustainable investment.

The remaining regions across the world, including Indonesia, Africa and South America, are required to collectively invest around USD 1.7 trillion per year to reach net zero.
Emissions from the rest of the world need to reduce from 23 Gt in 2020 to nine Gt by 2050. This will require regions to invest up to USD 47 trillion between now and 2050 to reach net zero targets.
Emerging economies tend to be disproportionately at risk from the adverse impacts of climate change. This is largely because households often live in areas more exposed to climate risks, such as flooding, drought, or extreme weather events. Delivering inclusive net zero targets that benefit all of society will require global cooperation in a number of key areas, including funding, resourcing and technology developments and commitment pipelines.
COP 27 highlighted the need for a just energy transition to incentivise emerging economies to shift away from fossil fuels and accelerate the roll out of renewable energy. During COP 27, progress was made in terms of rich countries financing cleaner energy transitions for emerging economies as a way both to speed up current emissions reductions and help avoid new emissions as their economies grow.
South Africa has published details of a USD 84 billion investment plan to shift from coal to clean energy. The country also outlined details of the Just Energy Transition Partnership (JETP), a USD 8.5 billion plan backed by the UK, the USA, France and Germany among others, to finance the shift from coal towards sustainable energy. During COP 27, two further JETP funding deals were announced shifting Vietnam and Indonesia away from coal power.
Despite these increased pledges, there is still a significant funding gap that needs to be filled to reach net zero targets. Success will depend on governments and global institutions providing clear incentives and frameworks to stimulate demand-led investment globally.
Policy initiatives across the region, such as South Africa’s National Infrastructure Plan 2050 and the Kingdom of Saudi Arabia’s Saudi Green Initiative plan account for significant investment in sustainable infrastructure. However, additional measures are required to unlock funding if projected gaps until 2050 are to be covered.
Economies in the rest of the world, especially those in subSaharan Africa and Latin America, require significant external financial support from global institutions and advanced nations to help reduce the projected deficit in sustainable infrastructure financing. However, certain measures can be undertaken to ensure that progress is made on unlocking additional funds to the extent possible. These include:24
1. Expanding scope of grant programmes: These can focus on sectors with high ability to reduce carbon. Additionally, governments must also strive to ensure there is equity between grants, subsidy and loanbased initiatives, as well as adequate revenue-support mechanisms that aim to de-risk and incentivise private capital participation in sustainable infrastructure projects.
2. Increased government incentives: Direct policy intervention is required by means of providing preferable term loans, subsidies and co-financing of large-scale and high-risk sustainable infrastructure projects to encourage greater private sector participation by helping reduce risk for investors. This is especially significant in emerging nations which currently lack a mature private sector ecosystem.
3. Expanding investor base: The inclusion of global banks, investment funds, institutional investors such as insurance companies, impact investors and philanthropic capital can facilitate pooling of capital for sustainable infrastructure projects, thereby mitigating the risk factor and encouraging greater participation of other external private sector entities.
4. Developing and implementing an effective carbon pricing framework: Implementing an effective carbon pricing framework in emerging nations can help incentivise investors to channel more funds into sustainable infrastructure while helping countries maintain trade competitiveness and facilitate clean energy transition, owing to the implementation of measures such as EU’s CBAM.25
5. Undertaking measures to address an inadequate climate information: An ambiguous climate information architecture with inadequate climate related data, unclear disclosure standards, taxonomies and other alignment approaches disincentivises investors from channelling funds into climate-beneficial projects. It is imperative to establish standards for climate finance reporting and disclosure that can help increase investor confidence and facilitate influx of additional funds for sustainable infrastructure projects.
6. Leveraging innovative financial instruments: Companies in emerging markets tend to have lower ESG ratings than their developed-market-domiciled industry peers. To reduce the risk exposure to private capital from low ESG scores of domestic companies, innovative financial instruments such as bonds backed by multilateral development banks can be issued, encouraging greater private sector participation and unlocking additional finance for sustainable infrastructure projects.

What are the recommendations to close the infrastructure gap?
Closing the sustainable infrastructure gap to hit net zero requires both the rapid unlocking of significant extra funding and accelerating the most impactful projects.
The global funding gap of USD 64 trillion in sustainable infrastructure to reach net zero needs to be rapidly closed. The engineering and wider infrastructure community can play a crucial role in defining a clear investible pipeline of the
most climate-impactful projects with inbuilt resilience to help policymakers match-make investors and rapidly accelerate project initiation.
We suggest five key actions globally that can contribute to both the rapid unlocking of significant extra funding and accelerating the most impactful projects, thereby contributing to closing the sustainable infrastructure gap required to hit net zero targets.
Define clearer pathways to net zero within each country that recognise technological and sector constraints and provide a pipeline of certified and investible projects that are commercially feasible.
Create a global platform to match funding opportunities to the right investors. Help enable emerging nations to have access to funds from multilateral institutions, investors and foundations.
Establish a new industry standard for the open sharing of embedded carbon data and define a new methodology for the grading of infrastructure project sustainability across the lifecycle, similar to energy efficiency ratings for consumer products.
Create a global repository of successful project case studies that can accelerate project initiation by sharing lessons learnt and clear data-driven benchmarks.
Champion a sustainable financing ecosystem that helps influence policymakers by attracting more private investors, providing better pricing incentives, leveraging innovative financial instruments, and easing transnational capital controls.
Recommendation 1: Establish a new grading system to rate the sustainability of infrastructure projects worldwide.
Establishing a new industry standard for the open sharing of embedded carbon data throughout the project lifecycle could facilitate the definition of a new methodology for grading the sustainability of infrastructure projects. Similar to how energy efficiency ratings are used on many consumer products.
Adoption of such a rating scale could drive all to minimise embedded carbon by helping to proliferate some of the most easily replicable practices for sustainable construction. This will help to bring about an uptick in the quality of implementation of sustainable infrastructure projects.
Some of the key application areas where the benefits of common engineering stands could accrue include:
• A common methodology for grading projects based on their application of industry best practice for minimising embodied carbon in design and construction, and maximising nature-based solutions, should be considered by client and engineering organisations worldwide.
• Such an approach will need to be consistently updated as more sustainable infrastructure projects are initiated and completed globally and the lessons learned and shared.
• Advances in technology and AI may allow engineers to design, deliver and manage increasingly complex tasks more quickly and efficiently. Use of unmanned aerial vehicles (commonly known as drones) have provided contractors the ability to scan and review jobsites faster and in a more efficient manner.
• Codifying learning on how to maximise the quality of outputs and safely deploying increased technology during manufacturing and construction processes can include sector and industry best practice.
• Advice on managing resulting impacts on labour practices should also be set out to provide engineering organisations and investors upfront guidance on potential concerns that government and industry bodies may have.
• Legal standards covering a variety of common issues that organisations are likely to face could aid in drafting key contracts and contract terms, leading to faster procurement of suppliers to deliver the most crucial projects.
• Legal issues covered could range from procurement models, contractual standard terms, country specific compliance, financing arrangements and labour disputes amongst others.
• In particular, standard forms of contract should include provision for the open sharing of embedded carbon data.
Recommendation 2: Define a clear pathway to achieve net zero in each country and prioritise projects where maximum emission reductions can be achieved.
To define such pathways, each country needs to individually assess and determine an achievable future net zero energy mix for 2050, with a national investment ambition to deliver it. Projects which are considered the most deliverable and commercially feasible and provide maximum emission reduction pre-2030 should be initiated immediately.
The pathway to deliver the remainder will need to address how to unlock technological and sector-wide challenges, together with constraints in supply chain, materials and worker skills, which vary by region, as well as the flexibility to account for competing short-term objectives such as energy security.
Commercially independent bodies such as academic institutions – in partnership with engineering firms – can help present research in areas related to sustainable infrastructure to help articulate key benefits publicly. These may be better received by governments as opposed to formal lobbying avenues that the private sector may pursue.
Currently, advanced economies are better placed to undertake hi-tech and capital-intensive sustainable infrastructure projects. However, ultimately all regions will need to increasingly mature their net zero path towards higher-tech capabilities in line with their evolving capabilities. Advanced nations will need to support emerging nations in doing this by sharing lessons learnt to help subsequently accelerate their own journey.
Pre
Expansion of transmission grids to improve efficiency
Pre 2030 priority
Implementation of projects using low-tech solutions such as sponge infrastructure and green roofs
Explore small modular reactor technology and energy storage
2030-2050 priority
Hi-tech solutions such as electrolytic hydrogen, advanced batteries and direct air capture
Application of biofuels in aviation
Large scale solar and wind energy farms to replace coal based power plants
2030-2050 priority
Focus on decarbonising hydrocarbon-based energy mix via gas, CCUS, etc.
Focus on sector application for H2 (hard to abate industry)
Enhancing usage of low carbon construction material in projects
2030-2050 priority
Proliferation of solar and wind energy projects, post subsidy
Strengthen the ‘backbone’ of the transmission grid as an enabler
Going forward, regions are anticipated to increasingly mature their net zero pathway towards higher-tech solutions in line with their evolving capabilities.
Initiation of sustainable infrastructure projects is held up by a variety of issues, particularly supply chain constraints, delays in licensing and permitting, prolonged public consultations and changes in project and political leaderships. Some projects tend to factor in these initiation delays early in the project lifecycle and race ahead for timely delivery.
Cross-organisational collaboration is required to develop a global repository that shares successful project case studies, good practice lessons that can be drawn from them, and how they can be applied to other projects.
One of the core objectives of this repository will be to define key accelerants that can surpass the initiation delays. The repository will be compounded with clear data-driven benchmarks and training materials acting as learning guides for practitioners.
Overleaf is an illustrative map of the typical delay and roadblocks with the corresponding accelerants to fast-track the initiation of time critical projects.
Typical delay source
Procuring the supply chain
Licensing and permitting approvals
Protracted public consultation process
Changing leadership and political priorities
Limited pan-industry collaboration on learning
Accelerants
Tactical and planned procurements for efficient deployments of integrated supply chains
Data-driven benchmarks for licensing and permitting approvals to drive faster decisions
Early stage public and stake-holder consultation to identify and clear objections early
Active leadership and consistent cross-party political commitment across the lifecycle
Regional centres of excellence to share best practice such as on procurement activities
Recommendation 4: Create a global funding platform to match funding opportunities for infrastructure projects in emerging economies –and build confidence and capacity in their governance.
Advanced nations have yet to provide the USD 100 billion of annual assistance to emerging economies agreed at the 2015 Paris Agreement. In November 2022, the COP27 reached a breakthrough agreement to provide “loss and damage” funding for vulnerable countries facing climate disasters.
Advanced nations will have a dual role − increasing their domestic spending on sustainable infrastructure while also helping enable emerging nations have access to funds to invest in their sustainable infrastructure. Creating collaborative partnerships amongst nations, donor agencies, multilateral development banks, and philanthropic organisations through global and transparent communication is key to improving investor confidence to effectively address climate inequity.
The creation of a transnational funding platform would promote transparency and foster international collaboration where emerging countries can showcase their certified and investible sustainable projects. This would create a databank for advanced countries to support projects that are in their area of expertise.
The platform can also enable funding through donor agencies, such as multilateral development banks, and philanthropic organisations like those that create more funds via donor initiatives such as the Scaling Climate Action by
Examples
The New York authorities bundled CHPE and Cleanpath projects simultaneously to achieve economies of scale and reduce cost in deploying HVDC technology
Smart permitting data-driven dashboard by the USA ensuring transparency in approvals and public outreach
EU’s Ten-Year Network Development Plan (TYNDP) 2020 delayed by 17% due to lack of public consultations
Timely project delivery of Barakah nuclear power plant was achieved under dedicated leadership with high quality and safety standards
European Green Hydrogen Acceleration Center (EGHAC) established to accelerate the development of green hydrogen in EU27 by 2025.
Lowering Emissions (SCALE) World Bank programme that facilitates easier access to finance carbon reducing projects in developing countries.
Advanced nations can enter into bilateral and multilateral agreements with nations to facilitate transfer of funds and technological know-how as well for sustainable infrastructure projects. Technology transfer can happen through imports, licensing or foreign direct investments (FDIs). Emerging economies can incentivise the process of FDIs pertaining to sustainable infrastructure to attract more foreign capital and resources.
The significant sustainable funding gap of USD 64 trillion cannot be bridged by the public sector alone. According to IEA modelling estimates, about 70% of this gap will need to be fulfilled through private capital, and the remaining 30% through public sector funding. One enabler would be the creation of an effective sustainable financing ecosystem that allows both the public and private sector to work in a collaborative manner.
The sustainable financing ecosystem needs to deliver policy interventions that pull more private investment towards sustainable infrastructure through subsidies and grants: for example, scaling down fossil fuel subsidies. It will also push away from carbon-intensive infrastructure through taxations and carbon pricing while matchmaking investors to the right projects supported by clearly defined taxonomy and KPIs for measuring success and easier capital flow mechanisms.
Establishing an effective sustainable financing ecosystem will also allow private sector organisations to deploy investment efficiently and address shifting market demands while minimising disruption.
An effective sustainable financing ecosystem that can stimulate involvement from policymakers and private sector will require four key levers:
1. Clearer definition of sustainable projects to attract more private capital: Governments should issue uniformly accepted taxonomy to provide clearer and more consistent international definition of sustainable projects. For example, projects focused on increasing share of renewable energy or providing low-carbon transport. Sustainable projects that clearly apply and refer to taxonomy guidelines or a carbon balance sheet are likely to be more appealing for private investors as they will improve the chances of attracting funding.
2. Direct market intervention to make investment in sustainable infrastructure more attractive: Direct policy intervention is needed to increase carbon pricing and embolden tariffs like CBAM, which can be unlocked faster for transnational transactions. Also, there is a need for mechanisms that enable faster approvals of sustainable finance grants and loans, and issuance of bonds, to avoid cost escalations for sustainable infrastructure projects. Governments should introduce a tax rebate or subsidy for small investors to participate in sustainability-linked bonds.
3. Disincentivise demand for unsustainable products whilst minimising disruption: Governments must focus on policy interventions alongside technological advancements
to facilitate significant shifts in consumer behaviour –a significant reduction in plastic usage for example. Through a phased policy intervention from government, private sector stakeholders can proactively plan ahead so that they are prepared to address shifting consumer behaviour with appropriate and high-quality products to minimize any disruption. For cross-border consumer goods, tariffs such as CABM can incentivise exporting countries to decarbonise supply chains to maintain demand from importers, where alternative could lead consumers to switch to domestic, cleaner industrial producers. Hence, government policies will also need to be designed to effectively achieve net zero targets within the required timeframes while minimising disruption to consumers.
4. Create regulatory frameworks that open access to wider funding sources and leverage innovative instruments: Policymakers should introduce data architecture and performance measurement systems linked to ROI for institutions investing in sustainable infrastructure projects such as carbon balance sheet. Governments also need to create regulatory frameworks to open accessibility to pension funds, impact funding and ETS. Along with this, they should explore more innovative funding options helping to reduce the risk factor in sustainable infrastructure projects and overcome challenges related to poor ESG scores, especially in emerging markets.
Attract investments towards sustainable infrastructure through subsidies and grants Discourage investments towards carbon-intensive infrastructure via taxation and carbon pricing nancing ecosystemWhat commitments has the GLF made to drive progress?

As GLF members, representing the global engineering infrastructure community worldwide, it is incumbent upon us to make commitments of our own that will help take the recommendations in this report forward.
Therefore, we undertake to do the following and challenge others to do the same:
Commitment 1: We will create a think tank to define a new sustainability rating standard.
We will create a new think tank to define a new sustainability rating standard. We will identify the open data inputs required from the consulting engineering industry and our colleagues in the contracting industry to inform a new calculation methodology for embedded carbon and the grading thresholds within the new sustainability rating standard. We will define how this will interface with existing digital tools. We will identify pilot projects we can use for initial launch and champion them as the “quick wins”. We will recommend a way forward on updating clauses within our FIDIC contracts through our pre-existing net zero taskforce. The clauses will aim to make provision for the open sharing of embedded carbon data in our next update of FIDIC standard contracts.
We call upon our clients and other governing organisations to match our commitment to open-data sharing to apply this new approach to all new infrastructure projects worldwide.
Commitment 2: We will extend an invitation to governments worldwide to help them turn their net zero policy ambition into a clear pathway plan.
We will invite governments worldwide to partner with our GLF and offer the help of our member associations to help them turn their policy ambitions into a clear pathway plan. The aim of this will be to identify practical policies and, through their members, identify the sustainable infrastructure projects where maximum emission reductions can be achieved that are most commercially feasible. We will offer to share lessons from those that have done well in this so far and help them accelerate their implementation plans. We will explore opportunities to partner with research and academic institutions to do this, as well as our colleagues in the contracting industry.
We call upon both academic institutions, our contracting colleagues and the wider infrastructure community to join with us and partner in helping to provide integrated advice to governments and policymakers at upcoming global forums to help accelerate delivery of the most impactful projects pre-2030.
We will help identify examples of successful project case studies from across the globe. These will include successful projects and the utilisation of techniques such as nature positive solutions. These case studies will be published in a wide-reaching public forum together with the approaches and innovations used that delivered fast initiation. The repository will be two-way and allow firms or governments to share any innovation or experimentation they implemented. Conclusions will be drawn for each project on lessons learned and playbook approaches that can be applied widely. Projects will also be categorised based on the countries they have been implemented in.
We call upon member engineering firms, consultants, academic institutions and the wider infrastructure community to engage with FIDIC to share examples projects that they will define as successful. We will engage with existing initiatives, such as OECD Blue Dot, to explore how the design and content of such a repository could maximise its usefulness.
Commitment 4: We will work with multilateral development banks (MDBs), governments and international organisations to help certify investible projects and build confidence in their governance structure.
We will invite MDBs, governments and international organisations to sit at the same table with FIDIC, for example, at events such as COP28, to help identify and showcase sustainable infrastructure opportunities in emerging economies that transnational funding platforms could support. We will engage with governments to help develop ESG certification for projects that can promote investor confidence and link into existing transnational funding platforms and mechanisms. We will also help develop their understanding of PPP models, the contracts that support them and identify what, if any, changes in the legislative framework may be required alongside it.
We call upon MDBs, governments and international organisations to engage with us at major global climate change events. In advance of attending these events, we would welcome a collaborative approach to agreeing key strategic points to make so that we can show a united front in tacking climate change issues and develop the right governance models for sustainable infrastructure project delivery that inspire confidence.
Commitment 5: We will work with policymakers and financial institutions to help identify the regulatory and policy levers that would facilitate investment in the most impactful sustainable infrastructure projects using a carbon balance sheet approach.

We will champion a sustainable financing ecosystem not just to influence policymakers, but the entire value chain of governments, financial institutions, engineering community and consultants. To assist our private sector stakeholders, we will explore the development of a new carbon balance sheet approach to help certify investible projects by measuring green ROI across the lifecycle of the project alongside the
economic return. We will also help governments assess regulatory and policy approaches: identifying “pulls” on subsidies/grants and “pushes” with taxes/carbon pricing that would most likely optimise the direction of investment. We will also help to influence governments to maintain focus on sustainable infrastructure investment during these times of political and economic turmoil by proactive engagement and bridging the gap between them and engineering firms.
We call upon the infrastructure engineering community, financial institutions and consultants to join forces with us to help embed green ROI into investment decisions and influence policymakers to create a sustainable financing ecosystem that applies across the whole project lifecycle.
To bridge the significant global infrastructure funding gap, but more importantly, the significant funding gap to meet net zero, as highlighted in this report, the infrastructure community has a major role to play, and all its members must work together.
This will include major collaborative projects such as creating a globally recognised grading scale to rate the sustainability of infrastructure projects and defining clear pathways to net zero in each country with the national investment ambition to deliver it – prioritising the most commercially feasible projects where maximum emission reductions can be achieved first. Such projects will therefore need to be given a greater degree of priority to ensure we hit an early trajectory to net zero.
It will also involve building a global repository of successful project case studies to accelerate project initiation, reducing climate inequity through collaboration amongst nations to transfer funds to emerging economies, and championing a sustainable financing ecosystem.
This will not be easy – not least because of the numerous obstacles to achieving net zero that currently exist and those that may well arise in the future. Advanced nations will have to balance funding their own decarbonisation transition with providing support for emerging nations. The latter, meanwhile, must navigate a path of rapid economic growth that isn’t reliant on fossil fuels, become more open to capital flows and create greater transparency while mitigating associated risks for international investors. All nations must seek to achieve these goals, while protecting and improving the well-being of communities through new ways of engagement.
However, the risks of failing to take decisive action now far outweigh the challenges of achieving net zero. The engineering community prides itself on coming up with
solutions for tough problems. We have no doubt that it can excel in helping solve what might be the toughest yet.
The net zero infrastructure of tomorrow is being built today. There is limited scope for second chances: we must act now.
FIDIC and EY would like to thank the following for their insights and contribution to the publication of this report.
FIDIC GLF Advisory Board representatives on "Future Scenarios" think tank:
Jim Johnson, Arup | Fidel Saenz de Ormijana, Ferrovial | Malani Padayachee−Saman, MPAMOT
FIDIC Board, including Anthony Barry.
FIDIC GLF Advisory Board, including Dr Nelson Ogunshakin, Sara Lipscombe and Graham Pontin.
FIDIC Secretariat.
FIDIC Global Leadership Forum Summit 2023 attendees.
FIDIC would like to give a very special thanks to all the delegates from its member associations who attended the inaugural Global Leadership Forum in Geneva on 27−28 April 2023, without whose support and engagement this report wouldn’t be possible.
3TI Progetti AECOM
AEO group
Arcadis
Artelia
Asplan Viak
Atkins − member of the SNC − Lavalin Group
Aurecon
B-Act Quantum Vinatage
Basler & Hofmann AG
Bentley Systems
Buro Happold
CDM Smith, Inc
EBRD
EFCG
Eptisa
Genève Aéroport
GOPA Consulting Group
HDR
IMEG Corp
Intercontinental Consultants & Technocrats Pvt Ltd
JPMorgan Securities LLC
Morrison Hershfield Group Inc.
Mott MacDonald
Pinsent Masons
POWER Engineers Incorporated
Ramboll
Schneider Electric
Solar Impulse Foundation
University of Cambridge
VHB
World Business Council for Sustainable Development
WSP
Neal Argent
Natasha Cambell
Matt Corkery
Andy Edge
Will Harris
Akanksha Jain
Chris Lewis
Dominic Mahony
Rob McNabb
Sooraj Mittal
Jonathan Morris
Emily Park
Paul Rees Jones
Karan Saksena
Gurdeep Singh
Mandeep Singh

Throughout this report, we have estimated the required global green energy investment to achieve net zero by 2050 by sector and region.
We used EY’s proprietary computable global equilibrium model, EYGEM, to quantify the investment required under two scenarios: (1) a net zero transition, and (2) a counterfactual scenario assuming only current policies are implemented. We also applied our modelling results to a third, delayed transition scenario to show an illustrative example pathway.
EYGEM is EY’s in-house, state of the art “computable general equilibrium” model. The model is a large scale, dynamic, multi-region, multi-sector model of the global economy based on a substantial body of accepted economic theory. The model solves year-onyear over a specified timeframe providing a rich and realistic representation of how changes in one part of the economy impact others through its supply chain and trade linkages. EYGEM represents the national accounts of over 141 countries and 65 sectors.
The model provides relationships between economic activity and greenhouse gas emissions, which are reflected in the model on a CO2 equivalent (CO2e) basis, allowing for detailed analysis of the impacts of various economic and policy changes across a pre-determined time horizon on the output of greenhouse gas emissions.
Given the equilibrium nature of EYGEM, a certain number of independent and dependent variables are required in order to solve to a new equilibrium. Inputs to the model are specified as shocks to relevant variables.
Rather than a forecasting model, EYGEM is a scenario− based model which aims to compare a number of scenarios against a defined reference case (representing the maintaining of the status quo within the economy).
Set against this scenario is a counterfactual scenario, which demonstrates the impacts of a market change, such as a different path of CO2e emissions. Results from the model are analysed in terms of the difference in the counterfactual scenario versus the reference case.
We have used the Shared Socioeconomic Pathways (SSPs) used by the IPCC26 to form the basis of our analysis. For both our current policies and net zero scenarios we used the SSPs “middle of the road” scenario, where the world follows a path in which socioeconomic trends do not shift markedly from historical patterns.
We have also used the IEA's World Economic Outlook to provide figures for the global investment into clean energy required under two scenarios; Stated Policies (STEPS) representing the baseline scenario, and Net Zero 2050 (NZE) representing our net zero scenario.
Using EYGEM we have modelled our reference case using RCP2-6.027 and our counterfactual scenario using RCP2-1.9, combined with the IEA’s global investment figures to provide disaggregated investment figures across the regions and sectors in the economy.
Within EYGEM we are able to model the impacts of market and policy change on individual countries or defined regions. In order to balance the complexity and run time of the model with ensuring accurate trade links we specify a number of key countries and aggregate the remaining regions. We defined specific regions for the USA, the UK, China, and India, aggregating the remaining countries into regions, including the EU27 and “rest of world” in order to enable global trade flows within the mode.
26. Shared Socioeconomic Pathways (SSPs) are scenarios of projected socioeconomic global changes up to 2100.
27. Representative concentration pathways (RCPs) relate to a given greenhouse gas concentration trajectory adopted by the IPCC.
This report has been prepared by Ernst & Young LLP in accordance with an engagement agreement for professional services with FIDIC and is published by FIDIC as part of its Global Leadership Forum 2023. Ernst & Young LLP’s obligations to FIDIC are governed by that engagement agreement. This disclaimer applies to all other parties. This report has been prepared for general informational purposes only and is not intended to be relied upon as accounting, tax, or other professional advice. Refer to your advisors for specific advice.
The findings, analysis, methodology, interpretations, conclusions and recommendations expressed in the report are a result of a collaborative and consultative process facilitated by Ernst & Young LLP and FIDIC’s Global Leadership Forum, but those do not necessarily represent the views of Ernst & Young LLP, its members, employees or partners, nor of FIDIC, its members, employees, partners or other stakeholders nor of the entirety of the members of the Global Leadership Forum. Ernst & Young LLP and FIDIC accept no responsibility to update this report in light of subsequent events or for any other reason.
This report does not constitute a recommendation or endorsement by Ernst & Young LLP or FIDIC or its Global Leadership Forum to invest in, sell or otherwise use any of the markets or companies referred to in it. To the fullest extent permitted by law, FIDIC and Ernst & Young LLP and its members, employees, agents, members of FIDIC’s Global Leadership Forum do not accept or assume any responsibility or liability in respect of this report, or decisions based on it, to any reader of the report. Should such readers choose to rely on this report, then they do so at their own risk.
Copyright FIDIC and Ernst & Young LLP © 2023All rights reserved. No part of this report may be reproduced, translated, adapted, copied, transferred, broadcasted, stored in a retrieval system or transmitted in any form or by any means-electronic, mechanical, photocopying or otherwise − without the prior express permission of FIDIC and Ernst & Young LLP in writing.
Published by the International Federation of Consulting Engineers (FIDIC) World Trade Center II PO Box 311
1215 Geneva 15 Switzerland
Phone: +41 22 568 0500 email: fidic@fidic.org
Website: www.fidic.org