BY JEN ALLEN
KEY MARKET METRICS
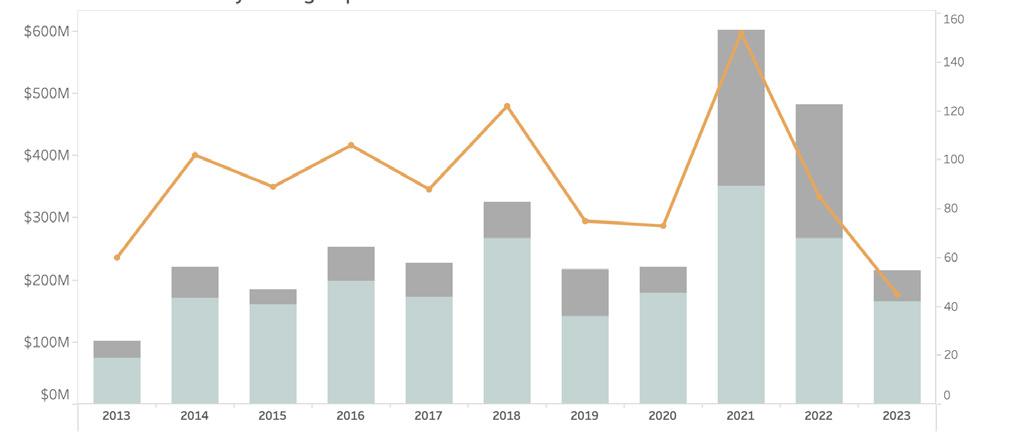
Four months into the year, the Nantucket real estate market appears to be returning to ‘normalcy’ after the peak period of 20202022. April transactions continued at a modest trajectory compared to the previous two years and were more comparable to the prepandemic era, though with a distinct difference in the average sale price. Monthly April transactions tallied 16 sales totaling $50 million, bringing year-to-date figures to 61 property transfers totaling $215 million. On a cumulative basis, this reflects a respective decline of 53 percent and 54 percent from the same period in 2022. Sales volume continued to be restrained by low inventory and though inventory figures are rising, much of the inventory is less turnkey for the many buyers who want immediate use of an updated property. For the turnkey properties that do hit the market, transactions continue to happen at a rapid pace. Here are Fisher’s April Market Insights...

REAL ESTATE ACTIVITY
MONTHLY SALES HIGHLIGHTS

(508) 228–4407 21 MAIN STREET, NANTUCKET, MASSACHUSETTS 1
NANTUCKET
Market Insights
REAL ESTATE
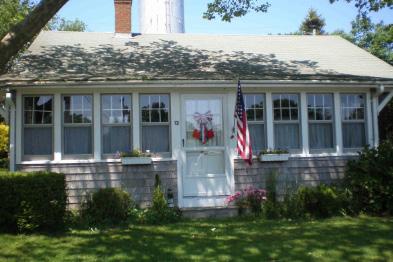
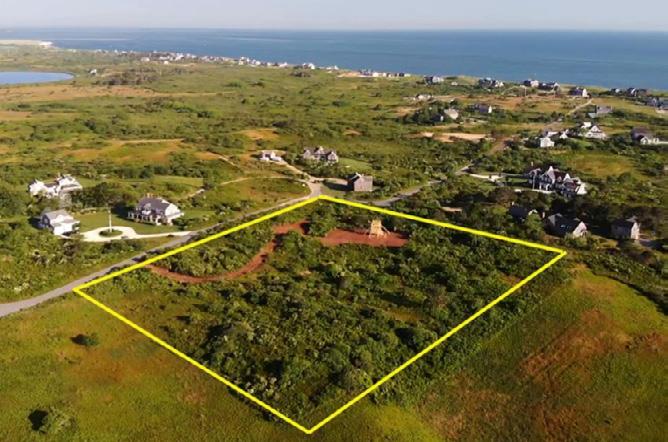
$6,150,000 26 DOUGLAS WAY OFF MARKET SALE $5,200,000 12 ELLENS WAY PRIOR SALE $3.08M MAY ‘19 $925,000 12 W. SANKATY ROAD PRIVATE SALE HIGHEST LAND SALE PROPERTY RESALE
FISHER’S APRIL ‘23 REVIEW
ALL PROPERTY TYPES 2023 2022 % CHANGE YOY 5-YEAR AVG. Transactions 68 133 -49% f 124 Dollar Volume ($ in 000s) $218,104 $482,247 -55% f $348,081 Months on Market 2.9 3.1 -6% f 5.3 Sale Price to Last Ask 98% 97% 1 d 95% Active Listings 116 91 27% d 228 Projected Absorption 3.6 1.7 110% d 6 New Monthly Contracts 15 28 -46% f 21 Dollar Volume # of Transactions
THROUGH APRIL 2013 - 2023
NANTUCKET
LOWEST HOME SALE Dollar Volume per Quarter Q2YTD Q1 # of Transactions
Market Insights BY
JEN ALLEN
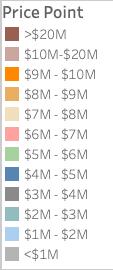
SFH SALES BY PRICE POINT
VOLUME DOWN BUT VALUES REMAIN ELEVATED
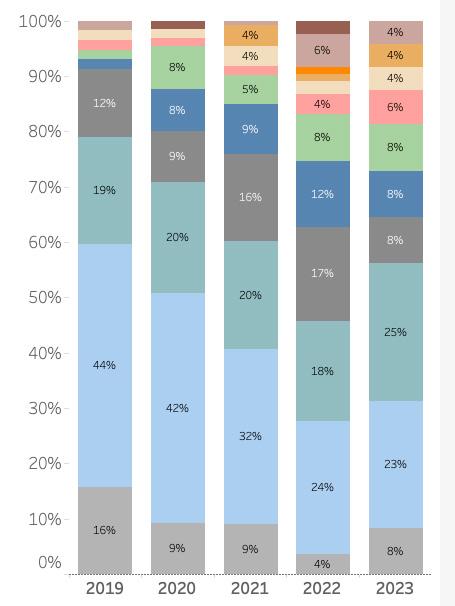
• While overall transaction volume for single-family homes is down precipitously from previous years, the average home sale price remained elevated at $3.7 million compared to the five-year average of $3.3 million through April 30, 2023. Property values continued to be buoyed by limited supply and strong demand, which has eliminated availability of homes for sale under $1 million (there were none listed for sale in April). Additionally, higher-end property sales represent a greater percentage of the overall total.
• This chart illustrates the significant shift in sales by price point over the last five years where homes under $2M (light blue and grey shades) have shrunk from representing 60 percent of transaction volume to 31 percent thus far in 2023. Meanwhile the percentage of sales above $5M (lime green and above) have represented a larger percentage of sales. Interestingly, the availability of homes in above $5M is higher than in 2022 so we will see how this additional inventory may or may not impact value.
PROPERTY INVENTORY (ALL TYPES)

PROPERTY LISTINGS RECOVERING FROM HISTORIC LOWS
• This inventory chart shows the tale of two markets: pre-2020 & 2020-2022. The tale of 2023 market is still being written and it will be very interesting to see how available inventory levels change over the next three to six months as this will be a significant factor for determining the path of property values.
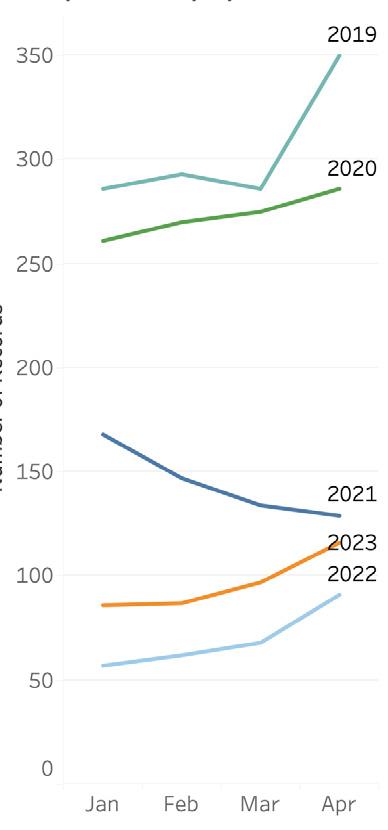
• If April is an indicator of things to come, inventory levels may not shift all that dramatically. During the month of April 2023, there were 34 new properties publicly listed compared to the 45 properties listed in April of 2022.
CONTRACT ACTIVITY STEADY PURCHASE ACTIVITY
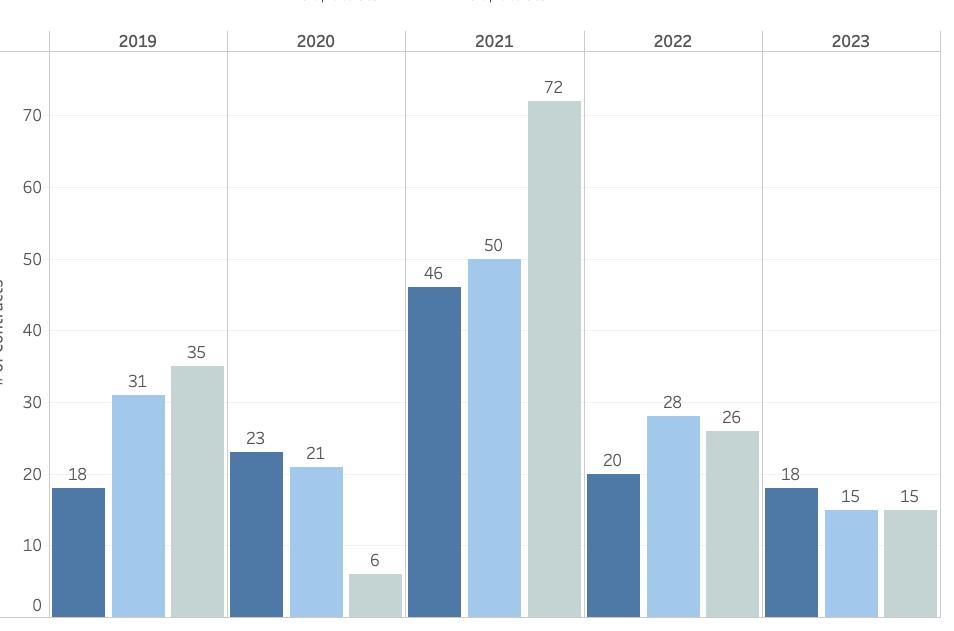
• Of the 45 new properties that came to market during April, five properties went to contract quickly. There were 10 other Offers to Purchase and Purchase & Sale Contracts (excluding duplicates) on properties that were previously listed bringing publicly marked contracts to 15 properties for the month of April. This is the same number as last month but well below the peak of 72 contracts in April of 2021 and still well below the pre-pandemic pace of 35 when there was significantly more inventory.
• Of the contracts that were publicly recorded during April, all were for properties listed for less than $6 million. Forty percent of the contracts were for properties last listed between $1 million and $2 million, with the balance occurring across price points below $4 million. There was no ultra-high-end activity (at least formally on the books, there is one rumored to be under contract but not yet publicly marked) through April, whereas by now 2022 there were three sales in this upper end of the market.
(508) 228–4407 21 MAIN STREET,
MASSACHUSETTS 2 2
NANTUCKET,
# of Records # of Contracts February April March 2019 2020 2021 2022 2023 Inventory Year:


