San Bernardino County Real Estate Market Report | December 2024

Page 1

DECEMBER 2024


San Bernardino County Market Update

DECEMBER 2024

2,586

935

$585,000

42

Homes for Sale

Sold Homes

Median Sale Price

Days on Market

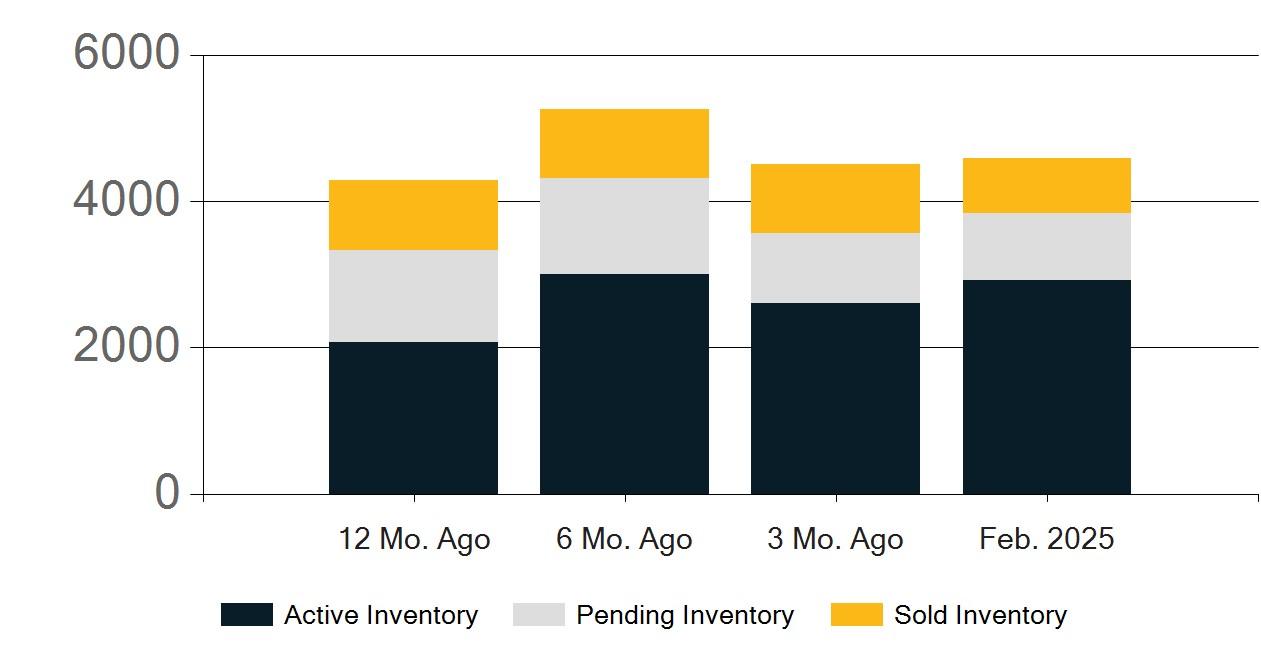
Active

Pending

Sold

Median Sale Price

Days on Market

Dec. 2024

2,586

760

935

$585,000

42

3 Mo. Ago

3,022

1,298

1,004

$585,000

34

6 Mo. Ago

2,872

1,368

1,023

$565,000

31

12 Mo. Ago

1,985

1,129

721

$525,000

37

Listing Inventory

Days on Market

Median Sale Price

All reports presented within this document are based on data supplied by the CARETS (CLAW, CRISNet MLS, DAMLS, CRMLS, i-TechMLS, and/or VCRDS) or their MLSs. Neither the Associations nor their MLSs guarantee or are in anyway responsible for their accuracy. Data maintained by the Associations or their MLSs may not reflect all real estate activities in the market. Information deemed reliable but not guaranteed.


Adelanto

Montclair

Apple Valley

Needles

Barstow

Ontario

Big Bear

Rancho Cucamonga

Chino

Redlands

Chino Hills

Rialto

Colton

San Bernardino

Fontana

Upland

Grand Terrace

Victorville

Hesperia

Yucaipa

Highland

Yucca Valley

Loma Linda


Adelanto Market Update

DECEMBER 2024

78

18

$387,583

43

Homes for Sale

Sold Homes

Average Sale Price

Days on Market

Active

Pending

Sold

Average Sale Price

Days on Market

Dec. 2024

78

20

18

$387,583

43

3 Mo. Ago

75

24

15

$409,150

28

6 Mo. Ago

61

29

18

$405,116

22

12 Mo. Ago

53

26

22

$393,814

40

Listing Inventory

Days on Market

Average Sale Price

All reports presented within this document are based on data supplied by the CARETS (CLAW, CRISNet MLS, DAMLS, CRMLS, i-TechMLS, and/or VCRDS) or their MLSs. Neither the Associations nor their MLSs guarantee or are in anyway responsible for their accuracy. Data maintained by the Associations or their MLSs may not reflect all real estate activities in the market. Information deemed reliable but not guaranteed.


Apple Valley Market Update

DECEMBER 2024

275

76

$467,541

40

Homes for Sale

Sold Homes

Average Sale Price

Days on Market

Active

Pending

Sold

Average Sale Price

Days on Market

Dec. 2024

275

64

76

$467,541

40

3 Mo. Ago

325

94

77

$452,499

38

6 Mo. Ago

254

135

71

$443,554

39

12 Mo. Ago

175

98

77

$440,069

45

Listing Inventory

Days on Market

Average Sale Price

All reports presented within this document are based on data supplied by the CARETS (CLAW, CRISNet MLS, DAMLS, CRMLS, i-TechMLS, and/or VCRDS) or their MLSs. Neither the Associations nor their MLSs guarantee or are in anyway responsible for their accuracy. Data maintained by the Associations or their MLSs may not reflect all real estate activities in the market. Information deemed reliable but not guaranteed.


Barstow Market Update

DECEMBER 2024

93

22

$303,518

56

Homes for Sale

Sold Homes

Average Sale Price

Days on Market

Active

Pending

Sold

Average Sale Price

Days on Market

Dec. 2024

93

21

22

$303,518

56

3 Mo. Ago

111

29

20

$291,478

42

6 Mo. Ago

100

33

26

$298,800

53

12 Mo. Ago

71

35

12

$251,333

31

Listing Inventory

Days on Market

Average Sale Price

All reports presented within this document are based on data supplied by the CARETS (CLAW, CRISNet MLS, DAMLS, CRMLS, i-TechMLS, and/or VCRDS) or their MLSs. Neither the Associations nor their MLSs guarantee or are in anyway responsible for their accuracy. Data maintained by the Associations or their MLSs may not reflect all real estate activities in the market. Information deemed reliable but not guaranteed.


Big Bear Market Update

DECEMBER 2024

61

9

$549,444

77

Homes for Sale

Sold Homes

Average Sale Price

Days on Market

Active

Pending

Sold

Average Sale Price

Days on Market

Dec. 2024

61

3

9

$549,444

77

3 Mo. Ago

76

7

10

$575,500

130

6 Mo. Ago

130

8

10

$706,644

123

12 Mo. Ago

64

9

9

$705,222

87

Listing Inventory

Days on Market

Average Sale Price

All reports presented within this document are based on data supplied by the CARETS (CLAW, CRISNet MLS, DAMLS, CRMLS, i-TechMLS, and/or VCRDS) or their MLSs. Neither the Associations nor their MLSs guarantee or are in anyway responsible for their accuracy. Data maintained by the Associations or their MLSs may not reflect all real estate activities in the market. Information deemed reliable but not guaranteed.


Chino Market Update

DECEMBER 2024

64

22

$721,314

17

Homes for Sale

Sold Homes

Average Sale Price

Days on Market

Active

Pending

Sold

Average Sale Price

Days on Market

Dec. 2024

64

21

22

$721,314

17

3 Mo. Ago

73

40

48

$850,377

22

6 Mo. Ago

81

49

32

$755,178

17

12 Mo. Ago

33

31

27

$781,196

26

Listing Inventory

Days on Market

Average Sale Price

All reports presented within this document are based on data supplied by the CARETS (CLAW, CRISNet MLS, DAMLS, CRMLS, i-TechMLS, and/or VCRDS) or their MLSs. Neither the Associations nor their MLSs guarantee or are in anyway responsible for their accuracy. Data maintained by the Associations or their MLSs may not reflect all real estate activities in the market. Information deemed reliable but not guaranteed.


Chino Hills Market Update

DECEMBER 2024

55

48

$1,206,611

39

Homes for Sale

Sold Homes

Average Sale Price

Days on Market

Active

Pending

Sold

Average Sale Price

Days on Market

Dec. 2024

55

21

48

$1,206,611

39

3 Mo. Ago

97

45

42

$1,078,021

27

6 Mo. Ago

78

41

43

$1,176,342

22

12 Mo. Ago

46

33

25

$1,086,147

30

Listing Inventory

Days on Market

Average Sale Price

All reports presented within this document are based on data supplied by the CARETS (CLAW, CRISNet MLS, DAMLS, CRMLS, i-TechMLS, and/or VCRDS) or their MLSs. Neither the Associations nor their MLSs guarantee or are in anyway responsible for their accuracy. Data maintained by the Associations or their MLSs may not reflect all real estate activities in the market. Information deemed reliable but not guaranteed.


Colton Market Update

DECEMBER 2024

33

14

$579,179

43

Homes for Sale

Sold Homes

Average Sale Price

Days on Market

Active

Pending

Sold

Average Sale Price

Days on Market

Dec. 2024

33

10

14

$579,179

43

3 Mo. Ago

33

28

25

$571,704

18

6 Mo. Ago

39

34

15

$567,187

17

12 Mo. Ago

27

19

9

$512,778

40

Listing Inventory

Days on Market

Average Sale Price

All reports presented within this document are based on data supplied by the CARETS (CLAW, CRISNet MLS, DAMLS, CRMLS, i-TechMLS, and/or VCRDS) or their MLSs. Neither the Associations nor their MLSs guarantee or are in anyway responsible for their accuracy. Data maintained by the Associations or their MLSs may not reflect all real estate activities in the market. Information deemed reliable but not guaranteed.


Fontana Market Update

DECEMBER 2024

173

75

$671,662

33

Homes for Sale

Sold Homes

Average Sale Price

Days on Market

Active

Pending

Sold

Average Sale Price

Days on Market

Dec. 2024

173

78

75

$671,662

33

3 Mo. Ago

207

121

93

$672,816

32

6 Mo. Ago

204

116

77

$676,473

22

12 Mo. Ago

140

103

61

$654,478

21

Listing Inventory

Days on Market

Average Sale Price

All reports presented within this document are based on data supplied by the CARETS (CLAW, CRISNet MLS, DAMLS, CRMLS, i-TechMLS, and/or VCRDS) or their MLSs. Neither the Associations nor their MLSs guarantee or are in anyway responsible for their accuracy. Data maintained by the Associations or their MLSs may not reflect all real estate activities in the market. Information deemed reliable but not guaranteed.


Grand Terrace Market Update

DECEMBER 2024

12

6

$614,000

18

Homes for Sale

Sold Homes

Average Sale Price

Days on Market

Active

Pending

Sold

Average Sale Price

Days on Market

Dec. 2024

12

3

6

$614,000

18

3 Mo. Ago

13

5

8

$616,238

37

6 Mo. Ago

12

0

10

$627,540

39

12 Mo. Ago

5

5

8

$585,625

72

Listing Inventory

Days on Market

Average Sale Price

All reports presented within this document are based on data supplied by the CARETS (CLAW, CRISNet MLS, DAMLS, CRMLS, i-TechMLS, and/or VCRDS) or their MLSs. Neither the Associations nor their MLSs guarantee or are in anyway responsible for their accuracy. Data maintained by the Associations or their MLSs may not reflect all real estate activities in the market. Information deemed reliable but not guaranteed.


Hesperia Market Update

DECEMBER 2024

225

68

$474,141

46

Homes for Sale

Sold Homes

Average Sale Price

Days on Market

Active

Pending

Sold

Average Sale Price

Days on Market

Dec. 2024

225

55

68

$474,141

46

3 Mo. Ago

255

93

65

$456,279

37

6 Mo. Ago

227

119

83

$477,685

33

12 Mo. Ago

160

100

43

$481,954

65

Listing Inventory

Days on Market

Average Sale Price

All reports presented within this document are based on data supplied by the CARETS (CLAW, CRISNet MLS, DAMLS, CRMLS, i-TechMLS, and/or VCRDS) or their MLSs. Neither the Associations nor their MLSs guarantee or are in anyway responsible for their accuracy. Data maintained by the Associations or their MLSs may not reflect all real estate activities in the market. Information deemed reliable but not guaranteed.


Highland Market Update

DECEMBER 2024

74

27

$627,789

33

Homes for Sale

Sold Homes

Average Sale Price

Days on Market

Active

Pending

Sold

Average Sale Price

Days on Market

Dec. 2024

74

34

27

$627,789

33

3 Mo. Ago

92

36

29

$567,977

36

6 Mo. Ago

68

45

37

$610,992

29

12 Mo. Ago

54

30

27

$560,429

48

Listing Inventory

Days on Market

Average Sale Price

All reports presented within this document are based on data supplied by the CARETS (CLAW, CRISNet MLS, DAMLS, CRMLS, i-TechMLS, and/or VCRDS) or their MLSs. Neither the Associations nor their MLSs guarantee or are in anyway responsible for their accuracy. Data maintained by the Associations or their MLSs may not reflect all real estate activities in the market. Information deemed reliable but not guaranteed.


Loma Linda Market Update

DECEMBER 2024

15

6

$702,167

10

Homes for Sale

Sold Homes

Average Sale Price

Days on Market

Active

Pending

Sold

Average Sale Price

Days on Market

Dec. 2024

15

2

6

$702,167

10

3 Mo. Ago

14

7

12

$706,583

52

6 Mo. Ago

16

7

10

$748,400

34

12 Mo. Ago

15

10

5

$579,600

41

Listing Inventory

Days on Market

Average Sale Price

All reports presented within this document are based on data supplied by the CARETS (CLAW, CRISNet MLS, DAMLS, CRMLS, i-TechMLS, and/or VCRDS) or their MLSs. Neither the Associations nor their MLSs guarantee or are in anyway responsible for their accuracy. Data maintained by the Associations or their MLSs may not reflect all real estate activities in the market. Information deemed reliable but not guaranteed.


Montclair Market Update

DECEMBER 2024

9

7

$719,286

25

Homes for Sale

Sold Homes

Average Sale Price

Days on Market

Active

Pending

Sold

Average Sale Price

Days on Market

Dec. 2024

9

3

7

$719,286

25

3 Mo. Ago

13

18

10

$676,080

23

6 Mo. Ago

19

13

12

$685,750

22

12 Mo. Ago

9

12

11

$625,182

16

Listing Inventory

Days on Market

Average Sale Price

All reports presented within this document are based on data supplied by the CARETS (CLAW, CRISNet MLS, DAMLS, CRMLS, i-TechMLS, and/or VCRDS) or their MLSs. Neither the Associations nor their MLSs guarantee or are in anyway responsible for their accuracy. Data maintained by the Associations or their MLSs may not reflect all real estate activities in the market. Information deemed reliable but not guaranteed.


Needles Market Update

DECEMBER 2024

39

2

$1,455,000

3

Homes for Sale

Sold Homes

Average Sale Price

Days on Market

Active

Pending

Sold

Average Sale Price

Days on Market

Dec. 2024

39

0

2

$1,455,000

3

3 Mo. Ago

34

4

2

$166,000

128

6 Mo. Ago

26

4

4

$189,750

15

12 Mo. Ago

22

1

2

$78,000

21

Listing Inventory

Days on Market

Average Sale Price

All reports presented within this document are based on data supplied by the CARETS (CLAW, CRISNet MLS, DAMLS, CRMLS, i-TechMLS, and/or VCRDS) or their MLSs. Neither the Associations nor their MLSs guarantee or are in anyway responsible for their accuracy. Data maintained by the Associations or their MLSs may not reflect all real estate activities in the market. Information deemed reliable but not guaranteed.


Ontario Market Update

DECEMBER 2024

113

58

$755,529

35

Homes for Sale

Sold Homes

Average Sale Price

Days on Market

Active

Pending

Sold

Average Sale Price

Days on Market

Dec. 2024

113

67

58

$755,529

35

3 Mo. Ago

174

80

67

$705,677

21

6 Mo. Ago

136

79

57

$710,858

15

12 Mo. Ago

79

56

39

$698,005

34

Listing Inventory

Days on Market

Average Sale Price

All reports presented within this document are based on data supplied by the CARETS (CLAW, CRISNet MLS, DAMLS, CRMLS, i-TechMLS, and/or VCRDS) or their MLSs. Neither the Associations nor their MLSs guarantee or are in anyway responsible for their accuracy. Data maintained by the Associations or their MLSs may not reflect all real estate activities in the market. Information deemed reliable but not guaranteed.


Rancho Cucamonga Market Update

DECEMBER 2024

99

70

$989,927

24

Homes for Sale

Sold Homes

Average Sale Price

Days on Market

Active

Pending

Sold

Average Sale Price

Days on Market

Dec. 2024

99

53

70

$989,927

24

3 Mo. Ago

152

86

83

$921,335

33

6 Mo. Ago

165

78

72

$1,010,987

22

12 Mo. Ago

84

38

41

$849,217

36

Listing Inventory

Days on Market

Average Sale Price

All reports presented within this document are based on data supplied by the CARETS (CLAW, CRISNet MLS, DAMLS, CRMLS, i-TechMLS, and/or VCRDS) or their MLSs. Neither the Associations nor their MLSs guarantee or are in anyway responsible for their accuracy. Data maintained by the Associations or their MLSs may not reflect all real estate activities in the market. Information deemed reliable but not guaranteed.


Redlands Market Update

DECEMBER 2024

96

51

$691,445

38

Homes for Sale

Sold Homes

Average Sale Price

Days on Market

Active

Pending

Sold

Average Sale Price

Days on Market

Dec. 2024

96

22

51

$691,445

38

3 Mo. Ago

112

66

44

$793,692

41

6 Mo. Ago

114

55

46

$707,737

28

12 Mo. Ago

74

47

19

$703,095

19

Listing Inventory

Days on Market

Average Sale Price

All reports presented within this document are based on data supplied by the CARETS (CLAW, CRISNet MLS, DAMLS, CRMLS, i-TechMLS, and/or VCRDS) or their MLSs. Neither the Associations nor their MLSs guarantee or are in anyway responsible for their accuracy. Data maintained by the Associations or their MLSs may not reflect all real estate activities in the market. Information deemed reliable but not guaranteed.


Rialto Market Update

DECEMBER 2024

78

41

$598,137

43

Homes for Sale

Sold Homes

Average Sale Price

Days on Market

Active

Pending

Sold

Average Sale Price

Days on Market

Dec. 2024

78

32

41

$598,137

43

3 Mo. Ago

93

61

41

$618,295

25

6 Mo. Ago

62

51

50

$587,506

17

12 Mo. Ago

77

51

31

$579,783

16

Listing Inventory

Days on Market

Average Sale Price

All reports presented within this document are based on data supplied by the CARETS (CLAW, CRISNet MLS, DAMLS, CRMLS, i-TechMLS, and/or VCRDS) or their MLSs. Neither the Associations nor their MLSs guarantee or are in anyway responsible for their accuracy. Data maintained by the Associations or their MLSs may not reflect all real estate activities in the market. Information deemed reliable but not guaranteed.


San Bernardino Market Update

DECEMBER 2024

251

87

$514,723

39

Homes for Sale

Sold Homes

Average Sale Price

Days on Market

Active

Pending

Sold

Average Sale Price

Days on Market

Dec. 2024

251

84

87

$514,723

39

3 Mo. Ago

273

123

96

$550,672

28

6 Mo. Ago

235

139

107

$512,208

18

12 Mo. Ago

187

126

83

$487,690

26

Listing Inventory

Days on Market

Average Sale Price

All reports presented within this document are based on data supplied by the CARETS (CLAW, CRISNet MLS, DAMLS, CRMLS, i-TechMLS, and/or VCRDS) or their MLSs. Neither the Associations nor their MLSs guarantee or are in anyway responsible for their accuracy. Data maintained by the Associations or their MLSs may not reflect all real estate activities in the market. Information deemed reliable but not guaranteed.


Upland Market Update

DECEMBER 2024

59

51

$886,253

32

Homes for Sale

Sold Homes

Average Sale Price

Days on Market

Active

Pending

Sold

Average Sale Price

Days on Market

Dec. 2024

59

32

51

$886,253

32

3 Mo. Ago

71

51

41

$893,214

23

6 Mo. Ago

70

36

44

$904,553

19

12 Mo. Ago

47

35

25

$940,782

32

Listing Inventory

Days on Market

Average Sale Price

All reports presented within this document are based on data supplied by the CARETS (CLAW, CRISNet MLS, DAMLS, CRMLS, i-TechMLS, and/or VCRDS) or their MLSs. Neither the Associations nor their MLSs guarantee or are in anyway responsible for their accuracy. Data maintained by the Associations or their MLSs may not reflect all real estate activities in the market. Information deemed reliable but not guaranteed.


Victorville Market Update

DECEMBER 2024

337

101

$446,551

50

Homes for Sale

Sold Homes

Average Sale Price

Days on Market

Active

Pending

Sold

Average Sale Price

Days on Market

Dec. 2024

337

95

101

$446,551

50

3 Mo. Ago

361

173

108

$446,251

35

6 Mo. Ago

330

187

119

$449,664

23

12 Mo. Ago

304

165

98

$419,155

29

Listing Inventory

Days on Market

Average Sale Price

All reports presented within this document are based on data supplied by the CARETS (CLAW, CRISNet MLS, DAMLS, CRMLS, i-TechMLS, and/or VCRDS) or their MLSs. Neither the Associations nor their MLSs guarantee or are in anyway responsible for their accuracy. Data maintained by the Associations or their MLSs may not reflect all real estate activities in the market. Information deemed reliable but not guaranteed.


Yucaipa Market Update

DECEMBER 2024

99

36

$727,852

93

Homes for Sale

Sold Homes

Average Sale Price

Days on Market

Active

Pending

Sold

Average Sale Price

Days on Market

Dec. 2024

99

21

36

$727,852

93

3 Mo. Ago

97

54

31

$595,492

37

6 Mo. Ago

111

49

40

$648,003

58

12 Mo. Ago

68

42

23

$639,760

46

Listing Inventory

Days on Market

Average Sale Price

All reports presented within this document are based on data supplied by the CARETS (CLAW, CRISNet MLS, DAMLS, CRMLS, i-TechMLS, and/or VCRDS) or their MLSs. Neither the Associations nor their MLSs guarantee or are in anyway responsible for their accuracy. Data maintained by the Associations or their MLSs may not reflect all real estate activities in the market. Information deemed reliable but not guaranteed.


Yucca Valley Market Update

DECEMBER 2024

248

40

$362,831

81

Homes for Sale

Sold Homes

Average Sale Price

Days on Market

Active

Pending

Sold

Average Sale Price

Days on Market

Dec. 2024

248

19

40

$362,831

81

3 Mo. Ago

271

53

37

$391,546

55

6 Mo. Ago

334

61

39

$469,180

53

12 Mo. Ago

191

57

24

$423,660

64

Listing Inventory

Days on Market

Average Sale Price

All reports presented within this document are based on data supplied by the CARETS (CLAW, CRISNet MLS, DAMLS, CRMLS, i-TechMLS, and/or VCRDS) or their MLSs. Neither the Associations nor their MLSs guarantee or are in anyway responsible for their accuracy. Data maintained by the Associations or their MLSs may not reflect all real estate activities in the market. Information deemed reliable but not guaranteed.


Turn static files into dynamic content formats.

Create a flipbook
Issuu converts static files into: digital portfolios, online yearbooks, online catalogs, digital photo albums and more. Sign up and create your flipbook.