Edited by:
Eva Pérez García
Amparo Mestre Alcover
Lorena Sáez Carramolino
Jorge Miguel Lara López
Fundación VALENCIAPORT
Sede APV - Fase III
Avda. Muelle del Turia, s/n - 46024 Valencia (Spain)
www.fundacion.valenciaport.com
ISBN: 978-84-940351-5-9

Edited by:
Eva Pérez García
Amparo Mestre Alcover
Lorena Sáez Carramolino
Jorge Miguel Lara López
Fundación VALENCIAPORT
Sede APV - Fase III
Avda. Muelle del Turia, s/n - 46024 Valencia (Spain)
www.fundacion.valenciaport.com
ISBN: 978-84-940351-5-9
Graphic design by:
tallerdeIDEASyCOMUNICACIÓN
P.I. Camí de la Mar
C/ Calderers 40 (antes calle nº3)
46120 Alboraya (Valencia)
Tel. 96 330 18 32
Fax 96 330 18 35
www.grupodiario.com
All rights reserved. No part of this publication may be reproduced, distributed, or transmitted in any form or by any means, including photocopying, recording, or other electronic or mechanical methods, without the prior written permission of the publisher, except in the case of brief quotations embodied in critical reviews and certain other noncommercial uses permitted by copyright law.
“The sole responsibility of this publication lies with the authors. The European Union, sponsors and stakeholders who have collaborated with the authors are not responsible for any use that may be made of the information contained therein.”
This report has been elaborated carefully but the information contained will continually be expanded and updated due to the nature of this industry. The authors assume no liability for the accuracy or completeness of the contents. The authors do not assume any liability for direct, indirect, material or immaterial damages that may arise from the use of the information provided on this publication. The use of the report is at the user’s own personal risk. The authors expressly reserve the right to modifications, amendments, updates of information or to the temporary or final discontinuation of this publication without any prior notice. The information in this report is non-binding and intended for general information purposes only. It is not a substitute for professional financial, engineering or other specialist advice. Users should not act upon this information without first seeking appropriate professional advice.
Rafael Aznar Garrigues CHAIRMAN OF THE PORT AUTHORITY OF VALENCIA
As Chairman of the Port Authority of Valencia and Fundación Valenciaport, it has been an honour to participate in the European Union (EU) co-funded project “CO2 and ship transport emission abatement by LNG” (the COSTA Action). I would like to thank the Italian Ministry of Infrastructure and Transport for coordinating this eye-opening project, the EU’s Trans-European Network for Transport (TEN-T) Programme for their co-financing of this Action and, extensively, for all their efforts in the improvement of the efficiency and sustainability of the European Transport System.
So far, most projects and activity on liquefied natural gas (LNG) as an alternative marine fuel have been focused in Northern Europe, particularly in the Baltic countries, with many of these projects having been boosted by a strong government and EU support. However, it has been highlighted in the COSTA Action that there is a huge potential for this sector in the Mediterranean and us, transport infrastructure managers, sea carriers and policy-makers should start to define the best strategy to comply with environmental regulation and then taking the necessary steps to develop the designed course of action.
Changes in international environmental regulations pose several challenges for the shipping and port sectors and we simply cannot afford the cost of inaction as not doing anything would have serious repercussions on the European transport sustainability and would affect significantly the competitiveness of the shipping industry. The time to deal with existing problems and uncertainty and start planning strategically is now.
In the Port of Valencia, we are following the developments in this field with great interest and our port cluster is initiating actions to prepare for the future. Terminal operators, LNG suppliers, engineering companies and sea carriers are beginning to work together. There have been some promising results that have already been obtained in the field of energy efficiency at container terminals using LNG for port equipment and we hope to continue with more successful pilots and projects in the coming months.
Timeliness and relevance of the results published in this report present a notable contribution to the state-of-the-art knowledge in this field in the Mediterranean and I hope this publication will help to shorten the initial learning curve for many members of our shipping and port communities.
Finally, I would like to thank the team of analysts in Fundación Valenciaport who have dedicated their time and effort to produce this work. We hope this report will contribute to stimulate discussion and ultimately help to advance the competitiveness of the European shipping and shipbuilding industries. Last but not least, I hope that you will find this publication both interesting and helpful.

Within the next few years, stricter sulphur, nitrogen and carbon dioxide emission limits from ships will be enforced both locally (already in SECA zones and from 2020 in the rest of the EU) and worldwide (from 2025). Simultaneously, the European Commission is stimulating the use of alternative fuels in the transport sector. Directive 2014/94/EU requires the development in each Member State of the Union, in the period 20172025, of a network of infrastructures allowing the use of natural gas, hydrogen, electricity and other sources of power for transport.
We, the Transport Administrations of EU and non EU Countries, have a common challenge ahead of us: Making maritime transport more environmentally friendly without compromising its economic competitiveness. In order to comply with the incumbent regulatory regime, three solutions are available:
• To use low sulphur content fuels such as Marine Gas Oil (MGO) in combination with Selective Catalytic Reducers (SCR) (for new vessels) to limit NOx emissions. However, this solution involves a significant increase in the operational cost of maritime transport. In the period 2020-2025, such costs will only apply to a limited part of the Mediterranean (the EU one) and Atlantic Seas, hence a significant risk exists of distorting competition in these areas until 2025.
• To use traditional heavy fuel oil (HFO) in combination with Exhaust Gas Cleaning Systems – EGCS (e.g. Scrubbers) to limit SOx emissions and Selective Catalytic Reducers – SCR to limit NOx emissions. This solution requires a greater amount of fuel consumption and requires a network of “reception facilities” for scrubbers’ residues (dangerous wastes). However, no such facility is currently available.
• To use alternative fuels such as Liquefied Natural Gas (LNG). This is, from an economic point of view, the most appealing solution (this is already used in the Baltic area). However, it requires a network of LNG refueling stations in the area. It is also noted that this type of network is one of the aims of the previously mentioned Directive 2014/94/UE.
The current situation requires the preparation of solutions to prevent damage in the EU’s shipping economy due to the double regime in the Mediterranean in 2020-2025. However, too many factors are still unknown, preventing an immediate deployment of these solutions.
As part of a comprehensive green shipping pre-deployment strategy, in my capacity of Director General for Maritime Transport and Ports, I wholeheartedly supported the establishment of the COSTA Action as a think tank to provide me and my colleagues in other countries with the elements to shape our strategy for the years 2015-2030.
I am therefore proud to introduce this technical report, which summarises a major piece of work carried out within the COSTA Action. Thanks to this work, we have been able to identify the major factors influencing the costs (hence the likelihood of success) of using LNG as a marine fuel and to estimate them as opposed to the costs of the other possible solutions. This work is so important and useful that I totally supported the idea of Fundación Valenciaport to make this report publicly available. It will be instrumental to the decisions that, in less than 18 months, I and other Directors General for Maritime Transport in Europe will have to take concerning, as requested by Directive 2014/94/EU:
• Which, where and by when alternative fuel infrastructures will be located in each EU Country
• Who and how (e.g. national law and/or guidelines) will be in charge of giving authorisations (so called “permitting”) to operate alternative fuel infrastructures.
No matter how many other pre-deployment studies and pilot refueling infrastructures will be developed in the next few years, this book will be a “bestseller” within my General Directorate and I believe, in many other Public Administrations across Europe.
While acknowledging the whole COSTA Action team for 30 months of excellent work, I would like to specially thank the authors of this publication for their dedication.
Feasibility of LNG as a Fuel for the Mediterranean SSS Fleet: Profitability, Facts and Figures

Forthcoming implementation of international and European environmental regulations, namely Marpol Annex VI and Directive 2012/33/EU, will force ship owners to assess technologies that can allow them to comply with regulation whilst helping them to improve their position in an increasingly competitive market.
Given the European economy’s fragile condition, prevailing uncertainty about its future and about the future evolution of key factors affecting the outcome of the ship owners’ decisions, making the right choice among the multiple feasible technologies available becomes a considerable challenge.
For the past two years, the undersigned team of analysts have worked together in a study leading towards the publication of this report. This analysis has been the Fundación Valenciaport’s contribution to the European Union (EU) co-funded project “CO2 and ship transport emission abatement by LNG” (the COSTA Action). The COSTA project has been coordinated by the Italian Ministry of Infrastructure and Transport and co-financed by the EU’s Trans-European Network for Transport (TEN-T) Programme under the Motorways of the Sea Call 2011.

Our objective has been to analyse which technology would give the best results for the ship owner to comply with environmental regulations concerning emissions from a financial point of view. This has been done for those vessels that are particularly affected by this regulation, that is, each of the 658 vessels deployed in short-sea shipping (SSS) lines calling at core ports in the Mediterranean and Black Sea EU countries and Portugal. Additionally, a cost-benefit analysis including externalities has been conducted.
As a result of this study, different scenarios on technology uptake towards 2030 for the Southern European SSS fleet have been defined. Needless to say, there is no certainty of how many of the driving factors will behave in the next 15 years. The results published in this report are not definitive predictions of the Mediterranean shipping sector in 2030. Instead, our main findings are intended to stimulate discussions about available options for the industry. By examining the entire SSS fleet operating in the Mediterranean, Black Sea and Portuguese core ports, we hope to portray a general picture of the most convenient technological options for different kinds of vessels. In addition, we hope to draw attention to the factors explaining most of the uncertainty over future results and provide useful information for both ship owners and policy-makers who may be evaluating policies to foster the adoption of the technologies that are most environmentally friendly and contribute the most to the competitiveness of the shipping and shipbuilding sectors in Europe.
Financial feasibility and cost-benefit analyses for the conversion of each vessel deployed in shortsea services in the studied area have been validated with the collaboration of prominent industrial companies. We would like to thank experts working for MAN Diesel & Turbo, Caterpillar, Wärtsilä, Ros Roca Indox Cryo Energy, S.L., Boluda Corporación Marítima, RINA and Bureau Veritas for the information provided and for their help validating the results on the investment required for each ship in the SSS fleet to install scrubbers, be retrofitted to LNG dual fuel or be substituted by a newly built vessel of similar characteristics and operating with LNG dual fuel engines, tanks and all the
necessary installations for this newbuilding to be LNG-compatible. Their support has also been crucial to check the operational costs of the ship for each pair of alternative options (the options compared have been: installing scrubbers, retrofitting to LNG dual fuel, newbuilding with HFO engines plus scrubbers, newbuilding with MGO engines (no scrubbers) and newbuilding with LNG engines and other LNG-related installations).
We share this report openly and free of charge to enhance the understanding of some of the challenges the shipping sector is facing, to encourage comprehension of the driving factors that affect the future competitiveness of short-sea shipping in the South of Europe and grasp the potential consequences that a “do nothing” scenario would bring in terms of modal backshift and increase in the use of road transport for intra-European trade flows. We hope you find this report useful and informative; and that it helps to stimulate discussion and thinking of the challenges, solutions and potential incentives to be put in place to favour the adoption of the technological options that will foster the competitiveness of the European shipping and shipbuilding industries. We sincerely hope you will enjoy reading the following pages.
Feasibility of LNG as a Fuel for the Mediterranean SSS Fleet: Profitability, Facts and Figures

2.1
2.1.1
Scope: conceptual framework and geographical area

The first input to the model was the creation of a database featuring information about all the Short Sea Shipping (SSS) regular lines that called at any core port in Europe having a Mediterranean coastline, as well as the characteristics of the ships used on these routes. In addition, the geographical area was extended to include countries such as Portugal that are of special interest within the COSTA project. The timeframe used for the database spanned the first six months of 2013 and included all lines that were active at the end of this period.
The criteria used to define SSS were in concordance with the definition of SSS provided by the European Short Sea Network, which states that Short Sea Shipping is defined as the movement of cargo and passengers by sea between ports situated in geographical Europe or between those ports and ports situated in non-European countries which have a coastline on the enclosed seas bordering Europe.
The abovementioned group of countries is intrinsically related to the area of activity of the COSTA project. The main focus in this project is the Mediterranean, where action towards the reduction of polluting emissions from ships and the use of alternative energy sources has not been developed as much as in other areas of Europe.
In addition, the study was restricted to the fleet of ships used on regular lines in a particular area, given that the investment envisaged in the proposed scenario is more likely to take place in regular line operations as these are more stable services. Specifically, countries and core ports included in the model are:
• Bulgaria: Bourgas
• Cyprus: Limassol
• Slovenia: Koper
• Spain: Algeciras, Barcelona, Bilbao, Cartagena, Gijón, A Coruña, Las Palmas, Palma de Mallorca, Seville, Tarragona and Valencia
• France: Ports on the Mediterranean coast, Fos-sur-Mer and Marseilles
• Greece: Igoumenitsa, Patras, Thessaloniki and Piraeus
• Italy: Ancona, Bari, Genoa, Gioia Tauro, Naples, La Spezia, Livorno, Palermo, Ravenna, Taranto, Trieste, and Venice
• Malta: Valletta and Marsaxlokk
• Portugal: Leixoes, Lisbon and Sines
• Romania: Constantza

The lines that connect the following ports were also included as partners or stakeholders in the COSTA project:


• Spain’s connections to the Canary Islands and the Balearic Islands, and inter-island traffic from the core ports of Las Palmas and Palma de Mallorca, respectively.


• Spain’s connections to the territories of Ceuta and Melilla.

• Portugal’s connections to Madeira and the Azores, and inter-island traffic from their major ports.
Furthermore, taking services originating from a core port as a geographical criterion is perfectly in line with the Directive 2014/94/EU of the European Parliament and of the Council on the deployment of alternative fuels infrastructure, which sets out minimum requirements for the building-up of alternative fuels infrastructure. In terms of maritime transport, Member States shall ensure, by means of their national policy frameworks, that an appropriate number of refuelling points for LNG are put in place at maritime ports, to enable LNG seagoing ships to circulate throughout the entire TEN-T Core Network by 31 December 2025.
The use of core ports as a selection criterion for the lines guarantees that data are representative and describe the current situation in the Mediterranean, as long as the network of core ports accounts for the majority of transport flows. This was checked by comparing the information available in the Fundación Valenciaport’s LinePort database, which contains data about the regular SSS services operating out of all Spanish ports, with the information obtained through the COSTA project. The result showed that 75% of Spanish SSS supply is included in this study.
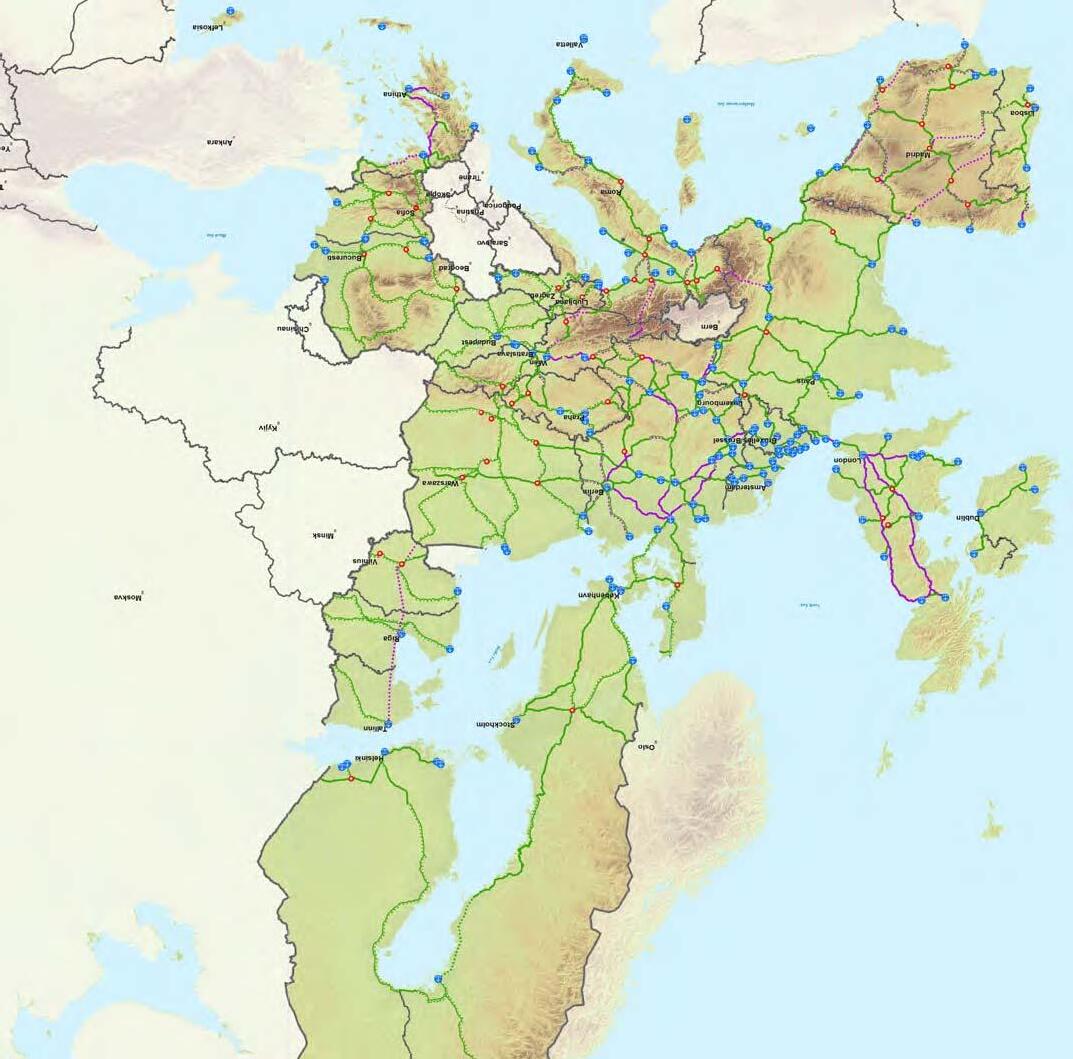
The core ports in European countries which have a Mediterranean coastline, along with Portugal, which is a partner in the COSTA project, are shown in the figure, based on the geographical scope of the database.
Croatia became a member of the European Union on 1st July 2013. However, this incorporation was outside the timeframe established for this project and as a result, Croatia was not included in the database. However, these countries which come under the SSS definition, are partially included in the study because the lines of the 10 countries featured in the study call at their ports. These countries are:
• 12 Atlantic coast countries: Germany, Belgium, Denmark, Finland, France (Atlantic), the Netherlands, Ireland, Morocco, Poland, the United Kingdom, Russia and Sweden.
• 15 Mediterranean and Black Sea countries: Albania, Algeria, Croatia, Egypt, Georgia, Israel, Lebanon, Libya, Morocco, Montenegro, Russia, Syria, Tunisia, Turkey, and Ukraine.
Four areas of study have been identified on the basis of this geographical division and are referred to in the presentation of results further on. The division is based on representative routes for each particular shipping service. The areas defined in the database are:
• The Atlantic area
• The Western Mediterranean Sea
• The Eastern Mediterranean & Black Sea
• The Mixed area: Those routes operating in more than one area
Feasibility of LNG as a Fuel for the Mediterranean SSS Fleet: Profitability, Facts and Figures
Finally, the database includes a specific focus on Motorways of the Sea services (MoS) that use the MoS corridors specified in the Trans-European Transport Network, in which the countries that come under the COSTA project are included: the Western Europe, the South-West Europe and South-East Europe Motorways of the Sea.
• Western MoS: SSS services established in the Western European corridor connecting the ports on Spain’s Atlantic coastline with the North Sea and the Irish Sea, with the Port of Hamburg as the motorway’s eastern boundary.
• South-West Europe MoS: SSS services established in the South-West European corridor connecting ports along the Spanish Mediterranean coastline to the Mediterranean coast of France, Italy and Malta.
• South-East Europe MoS: SSS services established in the South-West European corridor connecting ports on the Adriatic Sea to the Ionian Sea and the Eastern Mediterranean, including Cyprus.
The criteria used to define MoS services were as follows:
• Minimum frequency: 1 departure per week
• Maximum number of port calls: 3
In short, through the creation of this database, the Fundación Valenciaport is providing the Mediterranean ports and logistics community with comprehensive quality information on SSS services. This database enables users to tackle decisionmaking processes in their respective fields of work from a more informed standpoint. This tool is therefore extremely useful for transport policy-makers in Europe, since it provides them with not only a detailed picture of SSS services at any given time, but also with information about service developments over time. As a result, while current information enables the identification of critical SSS areas for government actions to focus on at any given time, the trends revealed by these services will enable policy-makers to assess the relative effectiveness of the different measures set or to be set in motion.
The database not only lists the lines in operation at each of the ports under study but it also provides highly detailed information about their characteristics, and data about regular services and vessel characteristics. Before defining the fields of information, it must be noted that multiple data sources were consulted to complete all the inputs required to run the model, giving the database considerable added value as a unique, highly detailed tool.
The following fields of information have been included in the database:
• Regular lines: Stable SSS services, in terms of frequency, route and transit times.
• Type of lines: The type of lines has been decided on the basis of the cargo transported by each service and the characteristics of the vessels used. According to these criteria, lines have been classified as car carrier, container, Pax, Ro-ro and Ro-pax services.
• Shipping company: Company or companies operating regular lines.
• Route: Most representative pattern of the line’s movements during the period under study. When changes took place in a line over the period, the latest route that has represented a regular pattern have been chosen.
• Geographical area: Three different areas according to the line’s route have been defined, i.e. Atlantic area, Western Mediterranean, or Eastern Mediterranean & Black Sea.
• Number of calls: Number of ports where the ship calls during a turnaround voyage.
• Distance: The number of nautical miles covered in each turnaround voyage. To calculate distance, complete rotations have been used, that is, the port of origin has been considered as the last stop so as to create a closed circle.
• Port: Ports where the service calls.
• Frequency: The number of voyages per week of said line. For seasonal lines, frequency has been weighted to obtain an approximate annual average.
• Seasonality: Regular lines that operate throughout the year as well as those that operate seasonally, that is, during a period of less than a year, have been included in this field.
• Number of voyages per year: The result of multiplying the frequency by the number of weeks in the year (52).
• Average ship: Vessel selected for its characteristics as the most representative of those used in the short-sea service.
• Ships: All the ships deployed in the short-sea service taking line frequency and transit times into account.
• Types of vessel: Lines were categorised based on the cargo transported by a particular service and the characteristics of the ships used. Thus, the lines studied were classified as follows:
- Car carrier:
- Container ship:
- General cargo
- Passenger ship:
- Ro-pax (Roll on/Roll off passenger):
- Ro-ro (Roll on/Roll off):
• Type of vessel according to engine: High-Speed Crafts are defined according to SOLAS Chapter 10, Reg 1.3, as vessels which are capable of sailing at a maximum speed, in meters per second (m/s), equal to or exceeding:
v=3.7* ∇0.1667
Where:
∇= volume of displacement in cubic meters corresponding to the design waterline.
• Type of vessel: According to the classification of the vessel.
• Year of construction: Year of build.
• Deadweight Tonnage (DWT): The weight in tonnes of cargo, stores, fuel, passengers, and crew carried by the ship when loaded to her maximum summer loadline.
the engine (expressed in kWh), that is, g/kWh. An intrinsic variable of all kinds of engines, SFC depends on many factors such as engine power, age, and the engine cycle (2 or 4 stroke).
Considering that the displacement is unknown, it has been estimated using the following approximation:
• Gross Tonnage (GT): Gross and net tonnages (GT and NT) are defined in the 1969 International Convention on Tonnage Measurement of Ships, which was adopted by the International Maritime Organisation in 1969, and came into force in July 1982. These measurements replaced Gross and Net Register Tonnage (GRT and NRT). Gross Tonnage (GT) is a unitless function calculated from the moulded volume of all enclosed spaces of the ship.
Although in some studies a reference value is used for this variable, in this case, the SFC was identified according to the information that appears in the engine data sheet, provided by the engine manufacturer of each vessel. The SFC of an engine differs according to the kind of fuel used. SFC is usually expressed in terms of a reference marine fuel (marine diesel oil) whose low calorific value is 42,700 kJ/kg, which is in accordance with ISO standard 3046-1:2002. SFC varies when using a fuel with a different calorific value.
Comparing both values: ∇1<∇. For ships complying with the statement (*), it has been checked that their Classification Society Certificate has the mark HSC (High Speed Craft) using the official website www.equasis.org.
• Lane metres: For Ro-ro and Ro-pax vessels. The total maximum linear lane length, the maximum width of loadable cargo and the maximum deck head clearance between adjacent fixed or movable decks are displayed. The number and type of ramps and doors (number, position, length, width and safe working load) are displayed, where known.
• Capacity in TEUs: The number of containers and reefer containers the vessel is designed to carry in primary or alternative stowage.
• Passenger capacity, besides crew: Number of people the vessel is designed to carry.
• Car capacity in the case of car carriers: Number of cars the vessel is designed to carry.
• Engine power in kW: Total power installed in the vessel (including all engines).
• Speed in knots: Service speed registered in sea trials.
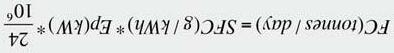
• Fuel consumption (tonnes/day): In this study, this is considered a key variable that represents the amount of fuel used by a ship, expressed in tonnes per day of navigation. In studying this variable, two methods were used to determine consumption. The first method has looked at the consumption register provided by the SeaWeb database. The second method has been used to calculate consumption using the following formula for the complete database:
where:
FC is the ship’s fuel consumption in tonnes/day. SFC is the specific fuel consumption of the engine in g/kWh.
Ep is engine power in kW. The constant is a unit correcting factor.
The variables related to these vessels are: 1
• Name of ship: Current name of the vessel, associated with the IMO number.
• IMO number: Unique identifier for ships, introduced under the SOLAS convention.
• Strokes: Indicator referred to the engine cycle (2 or 4 strokes).
• Specific Fuel Consumption (SFC): Term used to describe the degree of energy efficiency of an engine in relation to its output power. SFC can be expressed in different ways; in this text, SFC is expressed as the mass of fuel consumed (expressed in g) per unit of energy produced by
The methodological criteria followed to determine fuel consumption gave priority to our own calculations, in the light of the scarcity of the information on this variable in the Seaweb database and the differences in the data supplied.
Collecting and validating information about regular lines and the fleets operated for their inclusion in the database has been a complex task because of the lack of uniform and comprehensive information. Data about the different aspects of SSS is available from different sources, but this information is often incomplete and outdated. In this context, the need to create a database including consistent, coherent and exhaustive information validated with sea carriers and classification societies has been clear.
Information collection has been divided into different stages. First, the lines have been identified and then, the information required for the model has been completed and validated.
Lines have been identified by analysing each port and its shortsea services individually. The following search procedure has been followed:
1. Searches for links related to the ports under study.
- Online information from the managing port authorities, and searches for information about the port’s regular lines. In some cases, the information about regular lines provided by the port authorities is almost non-existent. This meant other alternatives need to be used. These are shown below.
- Information about permits granted by terminals to the traffic under study, and an analysis of the terminal websites in each case. In some cases, these websites have provided information about the ships that called at certain terminals, and thus enabled the search for information a posteriori to complete the database model.
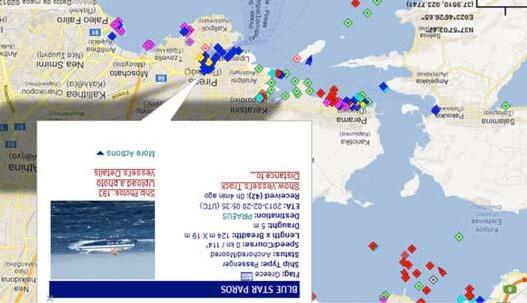
2. Port to port monitoring of vessel movements for six months in 2013 using AIS information. AIS is a compulsory standard for all vessels that are part of the SOLAS Convention.
3. Searches for information on specialised ferry and container ship websites.
4. Identification of ships, sea carriers and ship owners. Ships were allocated to specific services by monitoring their movements and contrasting this information with port authorities and sea carriers.
5. Identification of the sea carrier and download or request of the updated line schedules.
- This information has then been processed in the database, and saved for each sea carrier.
- When lines are shared by multiple sea carriers, the information has been downloaded for all the companies, and the most complete and reliable source has then been chosen.
The AIS, a dissemination system for ships, operates within the maritime VHF bandwidth with the help of a transponder and can provide more than 4,500 reports per minute, updating them up to every two seconds.
The AIS on ships uses Self-Organizing Time Division Multiple Access (SOTDMA) or Carrier-Sense Time Division Multiple Access (CSTDMA) radio sets.
The AIS was adopted by the IMO (International Maritime Organisation) in 2002 with an implementation calendar based on vessel characteristics beginning on December 31st, 2004. Since 2007, the AIS standard is compulsory for ships that are part of the SOLAS Convention and fulfil any of the following characteristics:
• Ships with GT greater than 500.
• International voyage ships with GT greater than 300.
• All passenger ships, irrespective of size.
The main idea behind the AIS is to prevent ships from colliding and to assist the Port Authorities in monitoring maritime traffic. The on-board transponders are fitted with a GPS (Global Positioning System) receptor that collects data about the position, course and speed of the vessel as also other static information like the name of the ship, its dimensions or details about its route.
The received information is updated in real time and is thus immediately available on the map. Base stations fitted with receptors collect information from each of the ships and feed it into more generic information systems. Currently, there are a number of websites that compile and share this information while maintaining a high level of reliability.
Source: http://www.marinetraffic.com
The second stage in creating the database has involved identifying the ships’ characteristics and calculating the distances of the different turnaround voyages. Information on all ships operating on identified regular lines has been collected. It has been assumed that these ships could also be used on other services, thus, the most up-to-date ships in terms of number and characteristics have been included.
The following information has been collected for the identified ships:
• Name of the ship
• IMO number
• Type of cargo
• Year of construction
• Deadweight Tonnage (DWT)
• Gross Tonnage (GT)
• Lane metres: For Ro-ro and Ro-pax
• Capacity in TEUs: Container and mixed ships
• Passenger capacity, besides crew
• Car capacity in the case of car carriers
• Engine power in kW
• Service speed in knots
• Strokes
• Specific fuel consumption
The above mentioned information has been sourced from websites like IHS Fairplay and information provided by the different organisations that certify the studied ships (Classification Societies). The information on mechanical aspects has been checked with that obtained in the engine data sheet provided by the engine manufacturer.
When calculating distance, a complete turnaround voyage has been considered, i.e. from one core port until the vessel returned to the same port. In the case of figure-of-eight routes, the complete distance from port to port has been considered. Different tools and information from specialised websites for nautical distances have also been used. For example, much of the information about the distances between the Greek islands has been obtained from information provided on the websites of port authorities and sea carriers.
The main tool used has been the application World Shipping Encyclopedia by Fairplay that calculates the distance between ports. This has been complemented by other tools that calculate distances in nautical miles.
Both series of data have been included in the definitive database, in which the characteristics of every ship associated with each regular line can be consulted. In the case of multiple ships operating on a service, the line information contains as many rows as there are ships operating, and the characteristics and distance of the rotation covered by each ship have also been included.
Information validation and standardisation
The large number of ports under study and the vast amount of information and variables to be considered in the database has resulted in an exhaustive monitoring process of the information which has been essential in terms of possible changes and further processing. To this end, the information has been validated and standardised through regular reviews during the six-month data collection period, in parallel to the search for information.
Validations have been carried out by different analysts, and the information has been reviewed up to four times, carrying out a case-by-case discussion of any regular line that presented any deviation in terms of information or validation, within the model created for this study. As the information has been obtained from several sources, cross-check procedures have been defined during the whole period.
Finally, all the information collected regarding all of the core ports has been processed in accordance to standard procedures, to avoid the duplication of information. Some regular lines overlapped in different parts of the transport chain because of their rotation at core ports in the EU. This duplicity has been eliminated at a later stage.
2.2.1
• Euro-dollar conversion rate (€/$): According to data published by the Boletín Estadístico del Banco de España, the average euro-dollar exchange rate in 2013 was 1.3281.
• Number of weeks per year: All the calculations were carried out based on a 52-week year.
• Discount rate: 12%.
2.2.2
As mentioned in the previous section, fuel consumption is one of the key variables in the model, and has been calculated according to the formula described before, which includes the following considerations.
• As a general hypothesis, it has been assumed that conventional vessels are fuelled by HFO while High-Speed Crafts (HSC) are propelled by MDO
• Low calorific value (kJ/kg): The total amount of heat that results from the complete combustion of one volume unit of fuel, excluding the amount of latent heat generated in water steam during combustion, as this does not change state and is released as steam. This value is important for industrial uses, such as ovens and turbines, because the combustion gases are emitted at high temperatures and water steam does not condense. In this study, four types of fuel with different low calorific values are considered.
- Marine Diesel Oil (42,700 kJ/kg)
- Heavy Fuel Oil (40,600 kJ/kg)
- Marine Gas Oil (42,800 kJ/kg)
- Liquefied Natural Gas (49,200 kJ/kg)
Low calorific value is an important value as it enables the Specific Fuel Consumption of all relevant fuels to be calculated through the Specific Fuel Consumption of reference fuel provided in the database and hence, the estimation of the daily fuel consumption of those fuels (HFO, MGO and LNG) per vessel.
• Speed correction factor: An 85% correction in the service speed published in the Fairplay database has been established based on common practises in the shipping industry.
• Engine power correction factor: An 85% correction in the engine power was defined, based on the assumption that vessels do not employ their total power during the whole voyage.
• Fuel prices (average 2013): Average prices of HFO, MDO and MGO in 2013 have been calculated to include them in the model, according to information provided by the BunkerIndex database. Concerning MGO and HFO, the average price in the Mediterranean has been selected, while in the case of MDO, this corresponds to North European ports due to the lack of information for the Mediterranean area.
• Average price of LNG ($/MMBtu): An average price of 10$/MMBtu has been used in the database. An increase of 15% to the final price has been added in order to include the logistics cost of LNG bunkering.
In order to estimate the greenhouse gas (GHG) emissions of the SSS fleet in the Mediterranean, fuel emission factors based on fuel consumption has been used. Reference values are based on the IMO (2009) Second IMO GHG Study, which compiled information in line with recognized standards (IPCC, UNECE/EMEP CORINAIR).
• PercentagereductioninCO2 when using LNG: A 25% reduction in CO2 emissions has been assumed when using LNG.
• PercentagereductioninSOx when using LNG: A 95% reduction in SO2 emissions has been estimated when using LNG.
• PercentagereductioninNOx when using LNG: An 85% reduction in NOx emissions has been assumed when using LNG. The following table summarises the hypotheses adopted in terms of emission reductions when using LNG as marine fuel.
Table 3: Hypotheses related to percentage reductions in environmental emissions when using LNG
Source: Fundación Valenciaport, 2014 based on literature review
Feasibility of LNG as a Fuel for the Mediterranean SSS Fleet: Profitability, Facts and Figures
• Price of CO2 (€/tonne) in 2013: according to data published by SENDECO2, a stock exchange for CO2 emission allowances, the average price of CO2 in 2013 was €4.455 per tonne. The graph shows the variability of this price, and the average price in 2013.
• Price of CO2 (€/tonne) in 2020: according to the literature review, a price of 23.5 (€/t) in 2020 has been taken as a point of reference.
• Price of NOx and SOx (€/tonne) in 2013: to estimate NOx and SOx prices, the evolution of American emission markets has been analysed, as in Europe there is only a trading scheme for CO2 emissions. It has been assumed that the same relationship between emission prices in the USA, could be employed in the European market; this proportion was calculated and applied to European CO2 prices. The results are shown in the table:
• Price of NOx and SOx (€/tonne) in 2020: the uncertainty over the economic value of SOx and NOx has led us to adopt a conservative approach and maintain constant prices.
• Price of PMx: due to the lack of relevant information on this matter, the economic value of PMx has not been considered.
This section aims to obtain an estimation of the cost of the installation required to power the fleet currently sailing in the Mediterranean with LNG. Both refurbishment of existing vessels and new builds have been considered.
As LNG is not the sole solution available to comply with the emissions limits fixed by Marpol Annex VI and Directive 2012/33/ EU, the installation of exhaust gas treatment systems, such as scrubbers, has also been analysed.
The final objective is to present a feasibility analysis of each solution to answer questions regarding the potential investments and possible benefits of using these technologies. For this reason, the study estimates the cost of implementing LNG and scrubbers when applied to different type of vessels, sized according to engine power.
Most of the existing fleet currently sailing on Short Sea Shipping lines in the Mediterranean Sea can be divided into different types of ships:
• Car carrier (CC)
• Container ship (CONT-SHIP)
• General cargo (GC)

• Passenger ship (PAX)
• RO-PAX
• RO-RO
In order to gain a clearer understanding of the problem, the fleet operating in the Mediterranean Sea during the first six months of 2013 has been classified by type of vessel.
Each type of vessel has been sized according to the commercial engine power ranges available on the market. Catalogues provided by Caterpillar, Man Diesel & Turbo and Wärtsilä have been used to establish these ranges. In general, each type of vessel complied with a commercial series of marine engines. The main advantage of this is that we have been able to assign a constant value in €/kW to the engine price.
There are two critical parameters in terms of LNG installation. The first, engine power, has been mentioned above, whilst the second is autonomy, which is also crucial when it comes to defining the installation, as there is a direct relationship between autonomy and LNG storage tank capacity. It is advisable that the future operability of the vessel is not compromised as a result of insufficient tank capacity that could prevent the ship from sailing on longer routes. This capacity has been estimated considering the route the vessel operated on from January to June 2013, and also taking into account the longest distance covered by this type of vessel during this period of time.
For instance, passenger vessels refer to ships whose primary function is to move passengers on short-sea voyages. As a rule, a representative vessel is approximately 40 m long, and operates on short routes, such as in the Gibraltar Strait, between islands, or connecting the mainland with islands (e.g. Greek Islands, Balearic Islands). Daily round distances range between 130-180 nautical miles (nm), with an average speed of 21 knots. These vessels are fitted with two high-speed engines, which can supply 4,000 kW of total power. This group includes a total of 27 ships, in which the line Naples-Ischia-Naples (180 nm per day), operated by a ship fitted with two high-speed engines of 2,000 kW each, epitomizes this type of vessel.
An in-depth analysis of car carriers shows that they can be divided into three different categories:
Table 5: Segmentation of car carrier vessels
Source: Fundación Valenciaport, 2014
The CC1 group includes nine car carriers which are equipped with one medium-speed engine of between 3,700-9,000 kW. The CC2 group is made up of 29 ships, fitted with low-speed engines, while there are seven car carriers in the CC3 group, with medium-speed engines. At this point, it should be highlighted that 69% of car carriers operating in the Mediterranean run on one low-speed engine between 11,000-13,000 kW.
Secondly, roll on-roll off vessels are designed to carry wheeled cargo, such as cars, trucks, and trailers that are driven on and off these vessels on their own wheels. Following the same process as the one set out above, the complete picture of Ro-ro vessels navigating in the Mediterranean can be summarised as:
15 vessels, powered by medium-speed engines, come under the RO-RO1 classification; 16 ships, fitted with low-speed engines, are included in RO-RO 2, and 56% of the Ro-ro vessel fleet, i.e. 40 vessels, equipped with two medium-speed engines, come under RO-RO 3.
Table 6: Segmentation of Ro-ro vessels
Source: Fundación Valenciaport, 2014
Additionally, the acronym RO-PAX (Roll-on/Roll-off passenger) describes a Ro-ro vessel built for freight vehicle transport along with passenger accommodation. Technically, this encompasses all ferries with both a roll-on/roll-off car decks and passengercarrying capacities, but in practice, ships with facilities for more than 500 passengers are often referred to as cruise ferries. Ro-pax vessels have different engine power capacities; as a consequence, these vessels have been categorised into six types:
According to the IMO SOLAS regulation, passenger vessels have to be fitted with at least two engines. In order to reach commercial speeds, these ships install medium-speed engines, with the exception of High-Speed Craft (HSC), which require high-speed engines to reach operational speeds. The main difference between medium and high-speed engines is that the latter run at variable rpm, reaching higher power/engine weight ratios. High-Speed Craft are propelled by water jets. To supply the vessel with enough power and manoeuvrability, at least four engines must be fitted. Conventional Ro-pax vessels up to 25,000 kW are equipped with two engines. More powerful vessels have four engines which are all equal power.
As per the classification set out above, 34 RO-PAX 1A, 16 RO-PAX 1B, 54 RO-PAX 2, 22 RO-PAX 3, 10 RO-PAX 4A and 23 RO-PAX 4B are in operation in the Mediterranean.
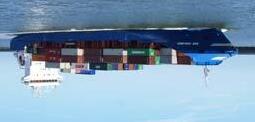
To conclude the segmentation of the fleet, container ships are the most common means of commercial intermodal freight transport and now carry most seagoing non-bulk cargo. In the first six months of 2013, container vessels made up 45% of the fleet operating on SSS services in the Mediterranean Sea. In accordance with total engine power, container ships have been divided into seven major categories, being CONT-SHIP 3 and CONT-SHIP 2 the most common segments used in the Mediterranean SSS lines.
Table 8: Segmentation of container ship vessels Source: Fundación Valenciaport, 2014
Regarding general cargo vessels, and although seven of them operated in the Mediterranean during the first six months of 2013, from the point of view of this study, their main characteristics were strikingly similar. General cargo vessels are equipped with one medium-speed engine of between 3,700-6,000 kW. In addition, routes covered round distances of between 1,000 nm to 3,900 nm. Therefore, a vessel designated as GC1, with 5,400 Kw of power, operating on the route “Bremen - Antwerp - Harwich - Leixoes - Oran - Mostaganem - Cartagena – Bremen” has been taken as a reference with all the critical parameters in account.
Taking into account the segmentation of the vessels defined previously, the existing fleet operating in the Mediterranean is represented in the following graph:
Graph 3: SSS Fleet distribution per type of vessel Source: Fundación Valenciaport, 2014
Feasibility of LNG as a Fuel for the Mediterranean SSS Fleet: Profitability, Facts and Figures
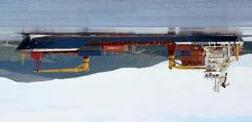
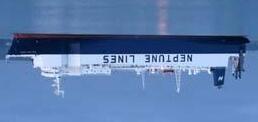
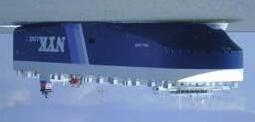
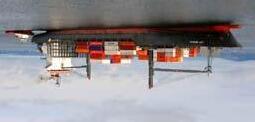
Furthermore, in each vessel segment it is possible to define a “representative vessel” which fits with the average characteristics of the vessels included in each category, not only in terms of technical issues but also according to service related aspects. The representative vessels have been summarised in the following table.
Table 9: Summary of the segmentations of the fleet Source: Fundación Valenciaport, 2014
Representative vessel example: NEPTUNE PLOES
Representative vessel example: CORAL LEADER
Representative vessel example: GRANDE ELLADE
Representative vessel example: WEC MAJORELLE
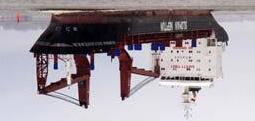
Representative vessel example: WMS HARLINGEN
Representative vessel example: WARNOW BELUGA
Representative vessel example: KONRAD SCHULTE
Feasibility of LNG as a Fuel for the Mediterranean SSS Fleet: Profitability, Facts and Figures
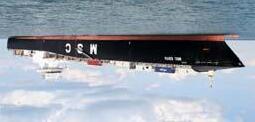
Representative vessel example: MSC EDITH
Representative vessel example: MSC MIRA
Representative vessel example: SEAGO ANTWERP
Representative vessel example: SLOMAN DISCOVERER
Representative vessel example: ACAPULCO JET
Representative vessel example: PASSIO PER FORMENTERA
Representative vessel example: PUGLIA
Representative vessel example: SCANDOLA
Feasibility of LNG as a Fuel for the Mediterranean SSS Fleet: Profitability, Facts and Figures

Representative vessel example: BLUE STAR DELOS
Representative vessel example: IKARUS PALACE
Representative vessel example: CRUISE OLYMPIA
Representative vessel example: FEDERICO GARCIA LORCA
Representative vessel example: AKNOUL
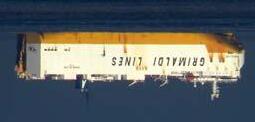
Representative vessel example: EUROCARGO VALENCIA
Representative vessel example: HATCHE
Feasibility of LNG as a Fuel for the Mediterranean SSS Fleet: Profitability, Facts and Figures
From the perspective of LNG and scrubber retrofitting, RO-RO 3 vessels are similar to RO-PAX 2, to a certain extent in that both are equipped with similar power. The SSS fleet is mainly made up of container feeder ships and Ro-ro/Ro-pax vessels with similar engine power, which represented 65% of the total SSS fleet. When CC2 and PAX 1 type of vessels are added, this group accounts for 75% of the SSS fleet operating in the Mediterranean. In fact, a detailed study of the fleet reveals that most of the ships have less than 25,000 kW of engine power, which infers that efforts should concentrate on this segment.
Compliance with Marpol Annex VI and Directive 2012/33/EU can be achieved by using different technologies available on the market:
• Fuelling by MGO
• Fuelling by LNG
• Installing scrubbers
• Among others
As of 2020, ship operators that trade in European territorial seas and exclusive economic zones will be required to burn fuel which has less than 0.5% of sulphur content. A ship operator may meet this requirement by burning high-sulphur fuel at sea, and then switching to low-sulphur fuel within these areas. Other ship operators may choose to reduce operational efforts by converting their vessels so that they always run on low-sulphur fuel oil, or utilise natural gas, which has almost no sulphur content.
This study has analysed costs for key technologies when applied to different types of vessels which are considered to be representative of the Mediterranean fleet. Costs have been calculated for each type of vessel, based on the information supplied by the main engine manufacturers, such as Wärtsilä, MAN Diesel & Turbo, and Caterpillar, as well as the cryogenic tank manufacturer, Ros Roca Indox Cryo Energy S.L. The costs of scrubber installation and operation have been estimated
according to the information provided by equipment suppliers. Scrubbering operational costs are available on Aalborg Industries self-certified data. Boiler units have not been considered in this survey, and specific fuel oil consumption has been based on current knowledge.
This study aims to answer questions regarding the cost/benefit ratio of using such technologies, and constitutes a general approach to the problem. In general, ships which may choose to engage in these technologies will have to pass a technical survey, ensuring that the technology can be integrated with ship arrangements, stability and operations.
In addition, it is necessary to highlight that the regulatory framework is defined by the IMO Interim Guidelines for gas as ship fuel (Resolution MSC. 285(86)), which contain the state-ofthe-art on safety concepts. Classification Societies have issued
their own rules, based on the IMO resolution mentioned above, and on their broad experience in both shipbuilding and LNG tanker operations. The IMO subcommittee on BLG has approved the International Gas as Fuel Code (IGF), which is scheduled to come into force in 2017. In parallel, ISO TC 67 is preparing standards for LNG bunkering. However, most systems are still close to their prototype development phase, and therefore involve technical risks.
Operating a ship on LNG is not a new technology; LNG tankers use the boil-off from the LNG tank as fuel. The technology exists, but making an existing ship run on LNG as a fuel requires a retrofit of the main engine, or the installation of a new engine, as well as the installation of a fuel system on board. As ships have to comply with tight schedules, the main engine option was chosen, according to the following criteria:
• Retrofit: Installation of the immediately superior main engine (in terms of power) available on the market.
Apart from changing the main engines, LNG conversions require other major changes, such as:
• LNG/Inner gas system
• Auxiliary systems
• LNG storage tanks
• Fuel supply systems. ATEX electrical installation
• Tank foundations
Moreover, piping and equipment in existing vessels has to be removed. In addition, the vessel will be taken off hire for approximately 40 days.
• New build: Engine power given by design speed.
For medium-speed engines, the installation of new engines seems to be the best option, as the difference in price is not significant, and removed engines can be sold in the second market.
Engine retrofitting is financially feasible for four-stroke engines and only for electronic two-stroke engines. Mechanical engines will need to be converted in two stages: in a first stage, an electronic fuel injection system will be installed and in a second phase, the engine will be converted to a dual-fuel engine.
For new builds, auxiliary engine power is taken as 20% of the main engine power. It has been assumed that auxiliary engines of existing vessels will still run on LSFO/MGO. A first rough estimate of the potential savings has dissuaded us from going straight on to retrofitting them to run on LNG in the model.
The LNG tank volume chosen aims to give the vessel sufficient autonomy to avoid increasing exposure to volatile fuel prices. The LNG system includes tanks, a bunker station, gas preparation, a gas line, automation, electrical system compliance with ATEX regulations, double-wall pipes, etc. This study has chosen type C tanks for all types of vessels following the recommendations of the IGF code.
Tanks generally imply lost cargo capacity, roughly estimated at 3%. Other operational costs remain constant in terms of operations run on IFO. Even though crew costs are higher, these are compensated by reductions in maintenance costs, mainly because times between overhauls are extended.
Alfa Laval Aalborg has designed a hybrid scrubber that works both in open and closed loops, and uses water (seawater or freshwater) to wash out the sulphur from the exhaust gases. The scrubber only works in the main engine. Early estimates reveal that is more profitable to operate auxiliary engines with MGO/ LSFO than to invest in scrubbers.
The conversion to the scrubber solution requires some important changes:
• New funnel layout
• Scrubber
• Installation of scrubber auxiliary machinery
•
• Steel work
The acquisition costs of scrubbing technologies have been broken down into equipment, engineering/certification, and installation / commissioning for each of the vessels.
Technically, each engine should have a single scrubber system installed on its exhaust pipe. Although the best solution from a technical point of view would be to have a single scrubber for each different engine, it is not feasible to install four scrubbers on four engines in a ship due to operational and financial reasons. So, following operational and financial criteria, it has been assumed that two scrubbers will be installed on four engines.
Installation and commissioning has been assumed to be 50% of the equipment cost. Engineering and certification has also been estimated as 7% of the equipment cost. Maintenance and repair expenses have been assumed to be 4% of the equipment cost on an annual basis.
Consumables and parasitic loads as a result of the scrubber were converted to a percentage of fuel consumption. Burning residual fuel requires significant heating, purifying, and waste management efforts that require energy, maintenance and operational efforts. Typically, the tanks and combustion fuel lines are heated by waste heat-generated steam, meaning that energy costs are relatively low. A correction factor is applied to account for the difference in heating value of distillate on a weight basis, as compared to residual fuel. On the other hand, distillate is lighter, and therefore requires larger storage volumes, and is more important for piping work and mechanical systems. This volume difference results in a diesel engine loss. A 5% increase in fuel consumption is assumed to be a sum of the aforementioned losses.
Sludge residue quantities and equipment energy consumption have been gathered from self-certified data sheets provided by equipment suppliers. Marpol VI residue collection prices are around €185 per tonne according to rates published by some Spanish port authorities. Moreover, the piping and equipment in existing vessels has to be removed. In addition, the vessel will be taken off hire for approximately 20 days.
Feasibility of LNG as a Fuel for the Mediterranean SSS Fleet: Profitability, Facts and Figures
Investments for each type of vessel are provided in terms of € /kW. Three separate cases have been studied. Retrofitting investment represents the total investment required to propel existing ships using LNG as fuel, whereas newbuild investment refers to additional costs for LNG installation compared with a traditional diesel installation. On the other hand, scrubbers investments include two components: new build investment refers to the complete scrubber and auxiliary equipment installation as mentioned above while the annual expenses are referred to the maintenance and waste management costs of the scrubbers.
2.3.3
Cost estimates
The following graphs provide an overall picture of the investments by type of vessel required to comply with environmental regulations, establishing a comparison between the different solutions.
Graph 9: Comparative costs for container ships
Source:
This section explains the methodology used to calculate the indicators included in this publication. The indicators have been defined from different geographic points of view, which coincide with the presentation structure.
These groups of indicators are:
• Global indicators: The whole area of study
• Indicators per area: Atlantic area, Western Mediterranean, Eastern Mediterranean & Black Sea, and mixed area (routes that connect more than one area)
• Indicators per country
• Indicators per port
• Indicators per Motorways of the Sea (MoS)
The indicators have been calculated for an entire calendar year based on the in-depth analysis of a six month period and additional research carried out. Considering that not all the lines included in this database have been active during the entire period in question, calculations have been based on the period of activity of each line and scaled up to a year. For example, a line has been in service from January to March but has ceased to operate thereafter. The average indicators for this line have been calculated on the basis of the total number of voyages and by calculating a weekly frequency for the line.
• Total number of ports: Sum of the core ports and the ports added to the database (overseas areas and SSS connections).
• Number of core ports: Number of ports selected by the TEN-T as key ports in the Mediterranean. Only those that are within the studied area of the project have been included.
• Number of ports with direct connections: Total number of ports of destination connected with other ports without any intermediate calls.
• Average number of ports connected per line: Average number of calls for the total number of lines, considering all the stopovers on the line.
• Number of ports of destination: Total number of ports where all the lines stopped.
• Number of lines: The lines included in the database during the study period.
• Number of shared lines per sea carrier: Total number of lines operated by more than one sea carrier.
• Number of shared lines per country: Total number of lines that have operated in more than one country and included in the study.
• Number of seasonal lines: Total number of lines that have operated for a period of less than a year.
• Number of sea carriers: Total number of sea carriers providing services during the period under consideration.
• Number of sea carriers per line: Average number of sea carriers operating per line.
• Average frequency (weekly departures): Average frequency of all the lines, calculated on the basis of the number of departures per week during their period of activity.
• Total lines per cargo type: Total number of lines active during the study period, organised according to cargo type. The total of this classification coincides with the total number of lines.
• Number of stops: Number of ports called at per line.
• Total lines per country and cargo type: Total number of lines active in the study period, organised by country, grouped together according to cargo type. The total of this classification is different from the total number of lines, as one line has been counted in every country in which it has a port of call.
• Total lines per port and cargo type: Total number of lines active in the study period, organised by the core port of loading. The total of this classification is different from the total number of lines because one line has been counted for each core and each additional port in which it had a port of call.
• Average engine power according to cargo type: Average engine power of the ships operating on each line, according to cargo type, expressed in kW.
• Average age of ships according to cargo type: Average age of ships operating on each line, expressed in years. The year 2013 has been used to determine average ages, based on the ship’s year of construction.
• Total number of ships per age range: Total number of ships per age range, according to year of construction.
• Consumption in tonnes/day per cargo type: Average consumption of ships per cargo type in tonnes per day of navigation.
• Number of ships per country and cargo type: Total number of ships per country, organised by cargo type. The total of this classification is different from the total number of ships as a line is counted in every country in which it has a port of call.
• Total GT capacity per country and cargo type: Total capacity offered per country according to cargo type. The total of this classification could be different from the general total.
• Total DWT capacity per country and cargo type: Derived from total GT capacity per country according to cargo type.
• TEU capacity per country: Total capacity of container transport supplied by country expressed in TEUs.
• Lane metre capacity per country: Total capacity of Ro-ro and Ro-pax transport supplied by country expressed in linear metres.
• Number of ships: Total number of ships used in rotation for the total number of lines active in the study period.
• Total GT capacity: Total GT per line and per type of traffic, scaled up to a year.
• Total DWT capacity: Total DWT vessel capacity per line and per type of traffic.
• Total TEU capacity: Total number of TEUs that can be transported by the container ship lines under study.
• Total lane metres capacity: Total number of linear metres offered by wheeled cargo lines (Ro-ro and Ro-pax).
• Total passenger capacity: Total number of passengers carried by passenger lines.
• Total car capacity: Total number of cars that can be transported by car carrier lines.
• Average DWT capacity of ship per cargo type: Average DWT vessel capacity per cargo type.
• Average speed according to cargo type: Average maximum speed of the ships operating on each line, according to cargo type, expressed in knots.
• Passenger capacity per country: Total capacity of passenger transport supplied by country expressed in number of passengers.
• Car capacity per country: Total capacity of car carrier tranport supplied by country expressed in number of cars.
• Average age of ships per country: Average age of ships, organised by country.
• Number of ships per port and cargo type: Total number of ships operating in each port, organised by cargo type.
• GT capacity per port and cargo type: Total capacity of each port according to cargo type. The total of this classification could be different from the general total.
• DWT capacity per port and cargo type: Derived from total DWT capacity per port, according to cargo type.
• Average age of ships per port: Average age of ships, organised by port.
The following indicators have been calculated for each shipping line:
• Average specific fuel consumption of the ship in grams per kiloWatt/hour (SFC, kWh): As explained in the previous stage in terms of the ships used to provide each service, information published by the Fairplay database about the average daily consumption of each ship has been used. However, this information is available across the board and therefore, theoretical formulae have been used first to calculate specific consumption in kilowatts/hour, and then, to obtain fuel consumption in tonnes per day for ships, when information was not available from Fairplay. As stated in the hypotheses section, the SFC of each ship has been based on the engine data sheet for each vessel.
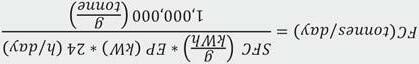
• Ship consumption in tonnes per day (FC,t/day): On the basis of the specific consumption (SFC) estimated earlier, the number of tonnes of fuel used per day by each of the lines has been calculated, based on engine power (EP) as shown below:
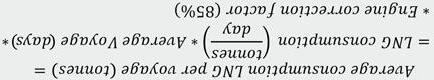
• Hypothetical LNG fuel consumption per voyage (tonnes):
These indicators have been calculated for those fuels used in the model, that is, HFO, MGO, MDO and LNG.
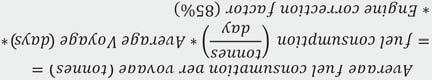
• Average number of days per voyage (days): The average distance covered in each voyage (D) in nautical miles, and the average speed of each service (v) in knots, has been estimated using both parameters and taking into account an average speed reduction factor of 85%. Only sailing times have been used to estimate fuel consumption, as time spent in ports has not been considered relevant for the purpose of the model.
• Average fuel consumption per voyage (tonnes):
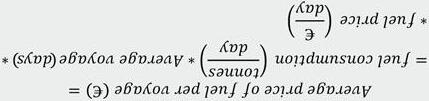
• Average current price of fuel per voyage (€): The average price of fuel per voyage has been estimated using the formula below, using the average daily cost of bunkering and the calculation for the average number of days per voyage:
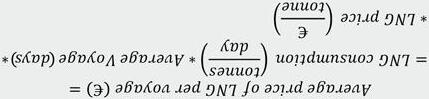
• Average price LNG per voyage (€): The average price of LNG per voyage has been estimated using the following formula, using the average daily cost of bunkering and the calculation for the average number of days per voyage:
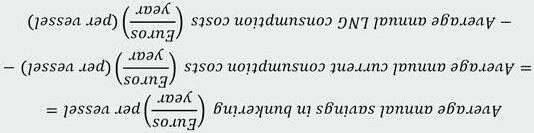
• Average savings in bunkering per voyage in Euro (€): Once the cost of traditional fuels (HFO and MDO) and the forecast cost per voyage for the line when using LNG have been calculated, the savings resulting from the change in fuel has been estimated:
• Annual savings in bunkering (€): To calculate the total annual savings in bunkering for each of the ships used in each service, we have calculated the number of voyages carried out by the line for each service, as well as the number of vessels required to cover each service. The formulae to obtain these values are as follows:
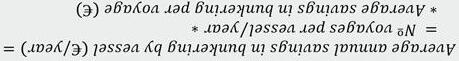
Therefore,
The next step in creating the model involved assigning a value to the environmental emissions (CO2, SOx and NOx) produced by the use of fuel:
• Total CO2 emissions (tonnes/day): In line with the IMO report mentioned above, total CO2 emissions produced by the use of fossil fuels in maritime transport have been obtained by multiplying fuel consumption in tonnes per day, by a factor of 3.13 or 3.19 (depending on the type of fuel), as indicated in the hypotheses section:
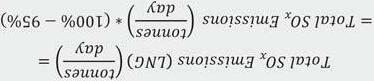
• Total SOx emissions (LNG) (tonnes/day): Total SOx emissions when using LNG have been calculated on the basis of the emissions calculated for traditional maritime fuels, applying a reduction factor of 95%:
• Total SOx emissions (tonnes/day): SOx emissions from the combustion process have been calculated as follows, taking into account the different emission factors for each main fuel.
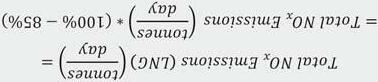
• Total NOx emissions (LNG) (tonnes/day): Similarly, a reduction factor of 85% has been applied to NOx gas emission estimates:
• Total NOx emissions (tonnes/day): As explained above, the NOx emission factor has been estimated at 0.056 (tonnes per tonne of fuel), which resulted in:
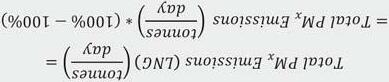
• Total PMx emissions (LNG) (tonnes/day): Similarly, a reduction factor of 100% has been applied to PMx emission estimates:
• Total PMx emissions (tonnes/day): PMx emissions from the combustion process have been calculated as follows, taking into account the different emission factors for each main fuel.
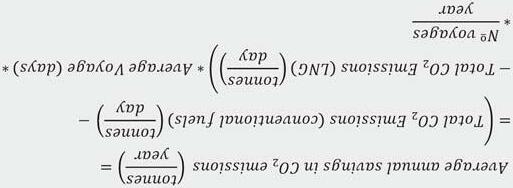
• Average annual savings in CO2 emissions (tonnes/year): Once CO2 emissions for each type of fuel and for each line have been calculated in tonnes per day, the average savings in CO2 emissions per year as a result of a change in fuel have been calculated by multiplying the average savings in tonnes per day, by the average number of days per voyage, and by the total number of voyages carried out by a line in a year:
Thereafter, the same environmental parameters calculated for fuel have been also calculated for LNG use.
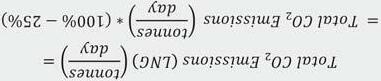
• Total CO2 emissions (LNG) (tonnes/day): CO2 emissions produced when using LNG have been estimated as being 25% lower than those produced when using current maritime fuels. On the basis of the value calculated in the previous step, emissions for LNG have been easily calculated as follows:

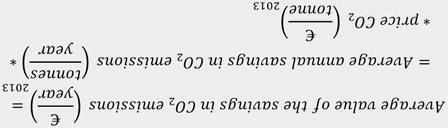
• Average value of savings due to reduction of CO2 emissions for the year 2013 (Euros/ year): Once the average annual reduction in total CO2 emissions in tonnes per year has been calculated and using the price quoted on the CO2 emissions trading market as a reference, the total savings in CO2 from using LNG instead of conventional fuels has been estimated.
As mentioned above, the average price of CO2 for 2013 has been € 4.55 per tonne, which results in:
• Average annual savings in bunkering per vessel (Euros/year): Based on the above, the annual savings in bunkering per vessel from using LNG instead of conventional fuels have been calculated:
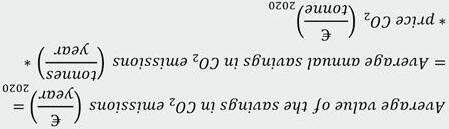
• Average value of savings due to the reduction of CO2 emissions for the year 2020 (Euros/ year): To calculate the savings in this scenario, estimations of future CO2 prices in 2020 have been used , taking the price of CO2 in 2020 as € 23.50 per tonne:
The same analytical approach used in the sections that study the services and fleet has been employed to obtain all these indicators by different levels of aggregation: geographical area, country, shipping line, cargo type or traffic, etc.
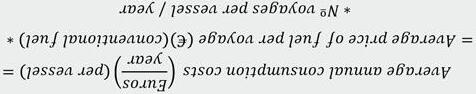
• Annual conventional fuel consumption costs per vessel (Euros/year): The average annual fuel consumption cost for each of the said vessels has been calculated using the value of annual fuel consumption per voyage and the number of voyages carried out by each vessel, based on the following formula:
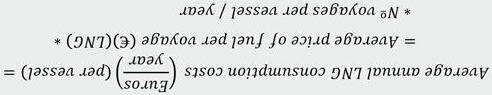
• Annual LNG consumption costs (Euros/year): Annual LNG consumption costs have been obtained in the same way:
• Cash flow: Difference between incoming flows and outflows in the period.
• Net Present Value (NPV): The present value of the cash flows generated by an investment project.
• Internal Rate of Return (IRR): Rate of interest where NPV=0.
• Payback: Period necessary to recover the investment associated with the project.
• Total investment per line: Sum of money required to adapt the fleet assigned to the line to run on LNG.
The NPV has been calculated by discounting the difference between costs and benefits cash flows back to the present and indicates how much the investor’s wealth has increased after recovering their initial investment, that is similar to an extra amount on top of the minimum return such investments are expected to render. The minimum required return on the investment is implicit in the discount rate, which represents the cost of capital, or opportunity cost of relinquishing the return on alternatives involving the same level of risk.
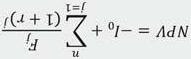
NPV is calculated using the following formula:
It is worth recalling that the discount rate is one of the parameters involved in calculating NPV. Therefore, if NPV is positive, the result reveals the extra return for investors in relation to what they expected to obtain from an alternative project. If NPV is zero, investors record the same return they expected to receive from undertaking an alternative project. And finally, if NPV is negative, the amount estimated would reveal the difference between the alternative project and the result of the project being evaluated; that is, the result is the amount that investors would no longer receive unless they opted for the alternative, which does not necessarily mean that the project would make a loss.
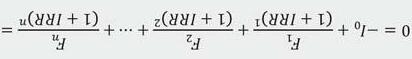
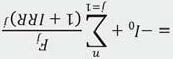
The second indicator used is the IRR, which is defined as the discount rate that produces a zero NPV. Mathematically speaking, the IRR is calculated on the basis of the following expression:
As mentioned above, the final objective of the model is to present a suitable and feasible situation for the 2020 and 2030 horizons, in terms of the fuel consumption pattern for Mediterranean SSS regular lines and the relevance of the use of LNG as a fuel for vessels in this framework. To achieve this, a scenario approach has been followed. The definition of the scenarios is analysed in section six.
Where Fj is flow of net cash flows (inflows – outflows) for t = j; Io is the investment in t = 0; r is the discount rate and n is the time horizon or lifespan of the project (20 years in our study).
NPV is one of the most commonly used measures to decide whether or not to go ahead with a project. A project is profitable for an investor if NPV is greater than zero. Therefore, the decision making rule is as follows:
NPV > 0 Profitable Project (go-ahead recommended)
NPV < 0 NON Profitable Project (should be rejected)
NPV = 0 Going ahead with the project would yield the same return as the alternative that has been used to calculate the opportunity cost.
Where Fj is flow of net benefits in t = j; Io is investment in t = 0 and n is the time horizon or lifespan of the project. The IRR is frequently used to evaluate projects. The decision making rule would be to give the go-ahead to a project if the IRR is higher than the opportunity cost of the investor (discount rate), but not to set the project in motion when the IRR is lower than the discount rate. Generally speaking, the IRR and the NPV lead to the same decision:
• If NPV is positive, the IRR is higher than the discount rate and the investors are recommended to implement the initiative under study.
• If NPV is zero, the IRR is exactly the same as the discount rate and the investors would receive the same return as from an alternative project.
• If NPV is negative, the IRR is lower than the discount rate required by the investors. Therefore, the project is less profitable for the investor than the alternative, which leads to a recommendation not to undertake the initiative.
Feasibility of LNG as a Fuel for the Mediterranean SSS Fleet: Profitability, Facts and Figures
3 ANALYSIS OF THE SUPPLY OF SHORT SEA SHIPPING SERVICES IN THE MEDITERRANEAN

The coming into force of international regulation on maritime transport emissions poses a challenge to the shipping sector, as this industry needs to take into account these new emission restrictions when creating their present and future strategic decisions concerning their fleet and services. These new constraints will be particularly relevant after the year 2020 for sea carriers deploying their vessels in short-sea services in the Mediterranean, as well as for ocean carriers whose ships spend most of their time in ECAs.
In these cases an in-depth analysis of the configuration and characteristics of services currently on offer and fleet deployed at present is vital as the fleet is relatively young with the year 2020 fast approaching. Most shipowners have to decide whether they should substitute some vessels and order newbuildings in the short term or to retrofit their vessels or to install scrubbers on them in the mid-term.
Although the rationale for carrying out this analysis is clear from the private point of view, this study is even more necessary from an institutional perspective. Public efforts guiding the shipping sector towards the most profitable solutions from a socio-economic viewpoint will need to go hand in hand with private initiatives. This course of action is only being possible after a comprehensive and consistent diagnosis of the current situation. Therefore, understanding the configuration of Short Sea Shipping (SSS) services in the Mediterranean has been the first step taken to achieve the general objective of this analysis: assessing the feasibility of the Med SSS fleet to run on LNG.
The results of an in-depth analysis of the Med SSS supply are provided in this section for the following types of traffic:
According to the information included in the database for the reference period, the supply of SSS consists of 395 regular lines. These lines connect an average of 4 ports per voyage, and are provided by a total of 139 sea carriers. Out of the 395 lines, 72 are joint services. The 395 SSS lines connect 34 countries and 289 ports. On average, each line is operated by 1.3 sea carriers.
The following figure shows the importance of container traffic, with 162 regular lines, closely followed by 137 services deploying Ro–pax vessels. A total of 45 lines are used for Ro-ro freight, 30 for passengers, and 21 lines deploy car carriers. Passenger services are the most frequently operated services, with an average of 20.9 departures per week, followed by Ro-pax lines, with an average frequency of 7.8 weekly departures.
Seasonality affects 17% of the lines. Voyages are more common in the summer months than during the rest of the year, mainly due to the increase in frequency in passengers and Ro-pax lines.
The analysis of the supply of SSS has been performed based on the data included in the MED Short-Sea Lines Database compiled by Fundación Valenciaport. For further information about the database, see the methodology section (Database: scope, specification of variables and information collection process). The indicators shown next include all the services active during 2013.
Feasibility of LNG as a Fuel for the Mediterranean SSS Fleet:Profitability, Facts and Figures 3 ANALYSIS OF THE SUPPLY OF SHORT SEA SHIPPING
The situation of the supply of SSS services in the areas included in the database: the Atlantic, Western Med, Eastern Med and Black Sea and the mixed area is described and compared in this sub-section.
The first feature worth highlighting is the concentration of lines in the Western Mediterranean: the supply of SSS services in the Western Mediterranean area (135 lines) is much higher than the supply in the other areas under study. However, the connectivity of ports in the Eastern Mediterranean and Black Sea is the best in terms of the number of ports of destination (126 in total).
As far as shipping specialisation is concerned, the Atlantic ports specialize in container cargo whilst the Mediterranean ports are clearly dominant in Ro-pax services. The high frequency of lines operating in the Western Mediterranean area is due to the Ro-pax lines linking ports such as Algeciras-Ceuta in Spain or Naples and Ischia in Italy. Finally, the high rate of seasonal services operating in the Eastern Mediterranean area is notable, a fact that is due to its relevance as a tourist area.
The supply of SSS services has also been analysed by country and the following figures in this sub-section are considered the most important in terms of supply capacity amongst the countries included in the study.
Graph 10 displays information about the number of SSS services which have been grouped according to the type of freight (car carrier, container, Pax, Ro-ro or Ro-pax). It must be taken into account that the sum of lines represented here does not coincide with the total mentioned previously (395), as the same service has been counted every time it calls into a different country. Italy is the country with the largest number of lines (158), closely followed by Spain (118 services), and Greece (108 services).
Italy, Spain and Greece also rank highly in terms of the total number of calls of SSS vessels at their ports.
Finally, a country profile providing detailed information about the supply of the SSS services has been created for all the countries included in the database, compiling the most relevant indicators mentioned above.
Italy is the country that provides the highest number of SSS services. Specifically, the 12 Italian core ports are served by 158 lines, operated by 67 sea carriers, followed closely by Spain (118 lines). However, despite having a lower number of services lines, Greece is the country that connects the largest number of ports, 162 ports of destination in total.
According to type of freight, Italy leads the table in Ro-pax (55 lines), Ro-ro (23 lines) and passenger services (15), Spain ranks higher in container services (61 lines), and Greece in car carrier connections (14). Furthermore, the connections available at Italian ports are more frequent due to the high number of Ro-pax and passenger services offered.
Additionally, the country profiles contain information about the map of connections of each country grouped by type of freight, that is, the ranking of countries of destination for each particular traffic.
CAR CARRIER CONTAINER PAX RO-PAX RO-RO
Source:
Source:
3 ANALYSIS OF THE SUPPLY OF SHORT SEA SHIPPING SERVICES IN THE MEDITERRANEAN
Feasibility of LNG as a Fuel for the Mediterranean SSS Fleet:Profitability, Facts and Figures
Figure 11: Characteristics of SSS services in Italy
(2014) based on the MED Short-Sea Lines database
Feasibility of LNG as a Fuel for the Mediterranean SSS Fleet:Profitability, Facts and Figures
3 ANALYSIS OF THE SUPPLY OF SHORT SEA SHIPPING SERVICES IN THE MEDITERRANEAN
FRANCEMALTASLOVENIACYPRUSROMANIABULGARIA
Ranking by country of destination according to the number of SSS services
Source:
Figure 12: Characteristics of SSS services in Spain
(2014) based on the MED Short-Sea Lines database
Feasibility of LNG as a Fuel for the Mediterranean SSS Fleet:Profitability, Facts and Figures
3 ANALYSIS OF THE SUPPLY OF SHORT SEA SHIPPING SERVICES IN THE MEDITERRANEAN
SPAIN GREECE PORTUGAL FRANCEMALTASLOVENIACYPRUSROMANIABULGARIA
Source:
Figure 13: Characteristics of SSS services in Greece
(2014) based on the MED
Lines database
Feasibility of LNG as a Fuel for the Mediterranean SSS Fleet:Profitability, Facts and Figures
3 ANALYSIS OF THE SUPPLY OF SHORT SEA SHIPPING SERVICES IN THE MEDITERRANEAN
PORTUGAL FRANCEMALTASLOVENIACYPRUSROMANIABULGARIA
Source:
Feasibility of LNG as a Fuel for the Mediterranean SSS Fleet:Profitability, Facts and Figures
3 ANALYSIS OF THE SUPPLY OF SHORT SEA SHIPPING SERVICES IN THE MEDITERRANEAN
SPAINGREECE PORTUGAL FRANCE MALTASLOVENIACYPRUSROMANIABULGARIA
Figure 15: Characteristics of SSS services in France
(2014) based on the MED Short-Sea Lines database
Feasibility of LNG as a Fuel for the Mediterranean SSS Fleet:Profitability, Facts and Figures 3
OF THE SUPPLY OF SHORT SEA SHIPPING SERVICES IN THE MEDITERRANEAN
PORTUGAL FRANCE MALTA SLOVENIACYPRUSROMANIABULGARIA
Source:
Figure 16: Characteristics of SSS services in Malta
(2014) based on the
Lines database
Feasibility of LNG as a Fuel for the Mediterranean SSS Fleet:Profitability, Facts and Figures
3 ANALYSIS OF THE SUPPLY OF SHORT SEA SHIPPING SERVICES IN THE MEDITERRANEAN
PORTUGAL FRANCEMALTA SLOVENIA CYPRUSROMANIABULGARIA
Figure 17: Characteristics of SSS services in Slovenia
Source: Fundación
(2014) based on the MED Short-Sea Lines database
Feasibility of LNG as a Fuel for the Mediterranean SSS Fleet:Profitability, Facts and Figures
3 ANALYSIS OF THE SUPPLY OF SHORT SEA SHIPPING SERVICES IN THE MEDITERRANEAN
Figure 18: Characteristics of SSS services in Cyprus
Source: Fundación Valenciaport (2014) based on the MED Short-Sea Lines database
Feasibility of LNG as a Fuel for the Mediterranean SSS Fleet:Profitability, Facts and Figures
3 ANALYSIS OF THE SUPPLY OF SHORT SEA SHIPPING SERVICES IN THE MEDITERRANEAN
Figure 19: Characteristics of SSS services in Romania
Source: Fundación Valenciaport (2014) based on the MED Short-Sea Lines database
Feasibility of LNG as a Fuel for the Mediterranean SSS Fleet:Profitability, Facts and Figures
3 ANALYSIS OF THE SUPPLY OF SHORT SEA SHIPPING SERVICES IN THE MEDITERRANEAN
Figure 20: Characteristics of SSS services in Bulgaria
Source: Fundación Valenciaport (2014) based on the MED Short-Sea Lines database
The number of lines available from core ports have been classified by type of freight with the results being shown in the Graph 11. As mentioned before, it must be taken into account that the sum of lines represented here does not coincide with the total (395), as the same service has been counted every time it calls at a different core port. The port of Piraeus (Greece) has the greatest number of lines (90), followed by Barcelona (Spain) with 41 services. Container services represent a large share of the total number of services for most ports.
PIRAEUS
BARCELONA
VALENCIA
GENOA
NAPLES
MARSEILLE
LIVORNO
MARSAXLOKK
ALGECIRAS
LAS PALMAS
VENICE
LISBON
ANCONA
LEIXOES
GIOIA TAURO
KOPER
LIMASSOL
RAVENNA
TRIESTE
VALLETTA
PALERMO
IGOUMENITSA
CONSTANTZA
LA SPEZIA
THESSALONIKI
BILBAO
FOS
BARI
PATRAS
PALMA
GIJÓN
SINES
TARRAGONA
BOURGAS
CARTAGENA
SEVILLE
TARANTO
A CORUNA
Feasibility of LNG as a Fuel for the Mediterranean SSS Fleet:Profitability, Facts and Figures 3 ANALYSIS OF THE SUPPLY OF SHORT SEA SHIPPING SERVICES IN THE MEDITERRANEAN
02468101214
05101520253035
CAR CARRIER CONTAINER PAX RO-PAX RO-RO
Graph 12: Top five core ports in terms of SSS services by type of freight Source: Fundación Valenciaport (2014) based on the MED Short-Sea Lines database
The top five core ports according to number of SSS services and broken down by type of traffic are ranked in Graph 12. According to the information gathered, the Port of Piraeus offered the largest number of SSS services for container, car carrier, and Ro-pax services, whilst the Italian ports of Naples and Genoa stand out from the rest in terms of passenger and Ro-ro services respectively.