8 minute read
Prohaska, and Larry Li
FWRJ Low-Cost Operating Modifications and Supplemental Carbon Automation to Achieve a Future Nitrogen Permit at a Florida Municipal Facility
Victoria Reuvers and Mahsa Mehrdad
Advertisement
Awastewater treatment plant, located in Florida, has a daily average flow of 6.5 mil gal per day (mgd). The facility was issued a new permit by the Florida Department of Environmental Protection reducing the future plant effluent nitrate and nitrite (NOx) concentration to 10 mg N/L or below.
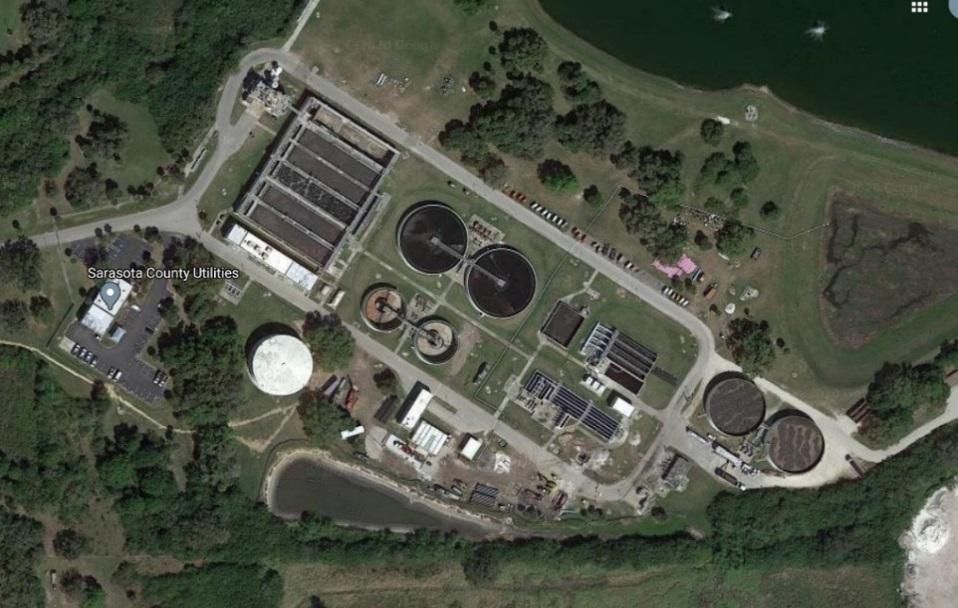
Originally, the facility was comprised of six suspended-growth trains (600,000 gal each) running in parallel. Figure 1 shows the layout of the facility. Each train includes a small anoxic zone, followed by an aeration basin. To avoid expensive penalties and/or a full plant upgrade, the facility decided to make minor and low-cost modifications to the existing process. These modifications include expanding the anoxic zone, implementing an internal recycle (IR), and adding a supplemental carbon source.
A pilot study was performed on one of the six trains to verify that these modifications would allow the facility to achieve the future effluent requirements. The primary objectives of the study were to: S Demonstrate stable operation, while achieving a plant NOx concentration below 10 mg N/L. S Identify key operating criteria, such as dissolved oxygen (DO) concentration in aeration basins, IR flow rate, and carbon source addition. S Fine-tune the automated carbon addition to reduce overall chemical costs and periods of overdosing. S Identify site-specific considerations for implementation of the full plant operation.
Before the pilot study commenced, a process performance model using a Biowin® simulator was calibrated based on the facility’s historical data. The process simulator model was originally run with methanol built in for the carbon source.
Victoria Reuvers is program manager and Mahsa Mehrdad is senior process and applications engineer with Environmental Operating Solutions Inc. in Bourne, Mass.
A review of safety factors and costs was used to determine that an alternative nonhazardous, nonflammable, and glycerol-based carbon source product called MicroC® 2000 would be used.
The simulation predicted that, with an IR rate of 300 percent of the influent train flow and 280 gal per day (gpd) of MicroC addition, effluent nitrate concentration would decrease from 10 mg/L to approximately 6.7 mg/L with four of the six trains in operation.
Pilot Project
The pilot project was executed between May and November 2020. Process modifications were performed on Aeration Tank No. 6 as the evaluation train. The existing anoxic zone was expanded to three times the original size using a membrane baffle system, slightly reducing the volume of the aeration basin. High-volume, low-head pumps were located at the discharge end of the train to provide a return rate between 100 and 300 percent of the average influent flow. Two HACH Nitratax probes were installed in the train to collect real-time NOx concentration data, which are utilized by the automated control strategy.
An external carbon source was supplemented via two pumps at different locations. Pump No. 1 was feeding MicroC to the anoxic zone of the Aeration Tank No. 6 to enhance denitrification using a Nitrack® controller, and Pump No. 2 was a manual MicroC pump, feeding a set rate of 96 gal into the common headworks. There were four trains online during the first months of the evaluation; thus, roughly 24 gal were assumed to enter the evaluation Train No. 6.
Data Collection
The nitrogen removal performance of the train was evaluated by collecting data from upstream and downstream of the anoxic zone. The first method of data collection was through real-time monitoring by two HACH Nitratax probes. The first probe was located at the end of the anoxic basin, and the second at the end of the aeration basin. The second method used was collecting grab samples from similar locations in Aeration Tank No. 6 as the evaluation train and Aeration Tank No. 5 as the control train. These grab samples were analyzed by the facility using the same methods for each sample and collecting the samples at the same time of the day at the identical location.
Control Strategy
A Nitrack controller was deployed to optimize the carbon dosage into the anoxic basin. The control strategy is a unique combination of a feedforward and feedback control algorithm in order to optimize the carbon feed to a specific site. Feedforward control actively adjusts the process conditions to changes in influent conditions, called disturbances, but does not adjust manipulated variables based on system performance. Conversely, feedback control actively adjusts manipulated variables based on system performance, but can have difficulty adjusting to disturbances in influent flow conditions.
The combination of a feedforward with a feedback control algorithm ensures that the effluent nitrate limit is achieved with continuous adjustment based on changing influent conditions. The facility influent flow, return activated sludge (RAS) flow, and Nitratax probes data were received and used by the controller to estimate the amount of required carbon in the anoxic zone.
Results and Discussion
The trial started in mid-May of 2020 by a MicroC addition into evaluation Train No. 6. Figures 2a and 2b depict the Aeration Tank No. 6 performance and the supplemental chemical addition. The evaluation trial was divided into two periods. The first period, depicted in Figure 2a, was from May 18 through September 1, when the process was unstable due to significantly varied influent loading, process upsets, and instrumentation issues, which are described further. In the second period of operation, from September to November, the process performance became steady and consistent, as shown in Figure 2b. Table 1 includes the detailed results of the evaluation trial at different stages of operation. Continued on page 44
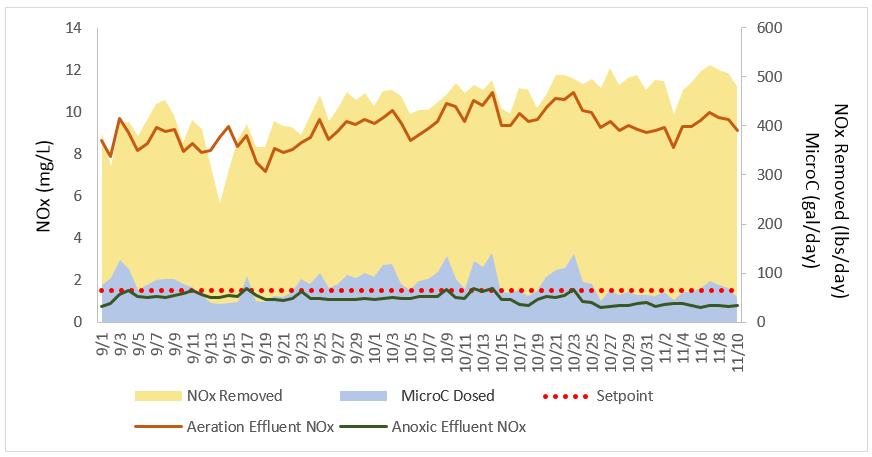
Figure 2. Nitrogen removal performance and supplemental carbon addition in Aeration Tank No. 6. Shown is (top [a]) period of operation from May to September 2020, and (below [b]) after the evaluation period, from September to November 2020.
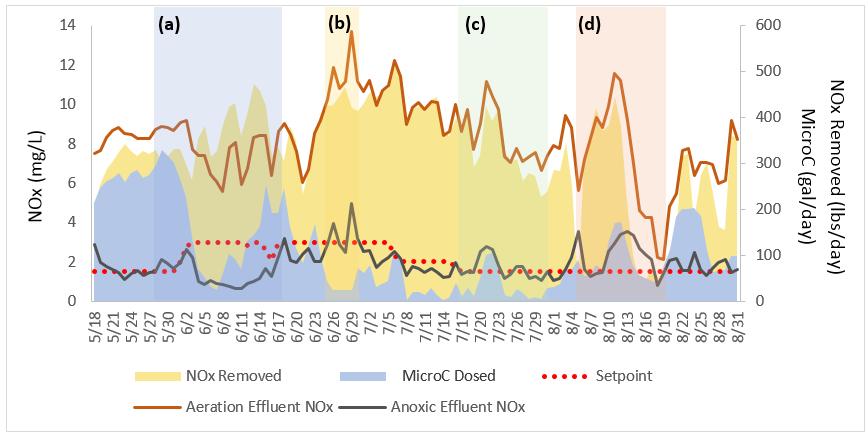
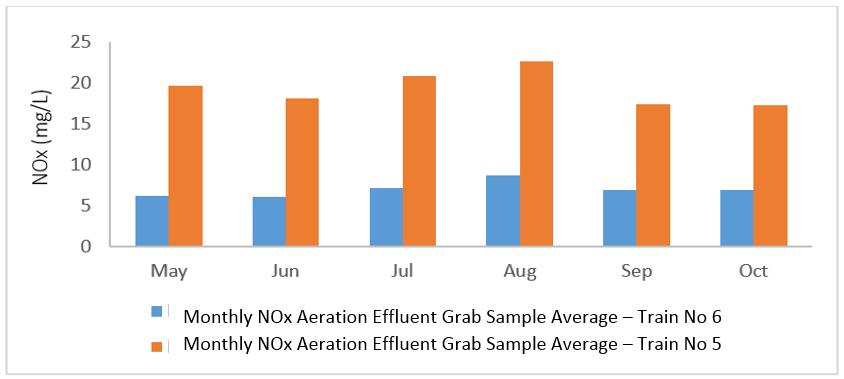
Figure 3. Comparison of the Grab NOx samples from the aeration effluent of Evaluation Train No. 6 and Train No. 5.
Continued from page 43
The average monthly grab sample results for aeration effluent NOx-N in both Train No. 6 and Train No. 5 are shown in Figure 3. Throughout the trial, the aeration effluent NOx-N concentration of Tank No. 6 remained less than the nitrogen limit of 10 mg N/L. The average effluent NOx-N concentration in Aeration Tank No. 6, with MicroC addition, was 6.7 mg N/L compared to 20.2 mg N/L in the Aeration Tank No.5 as the control train. The minor process modifications with the external
Figure 4. Ammonia and NOx-N concentrations at the aeration effluent of Train No. 6.
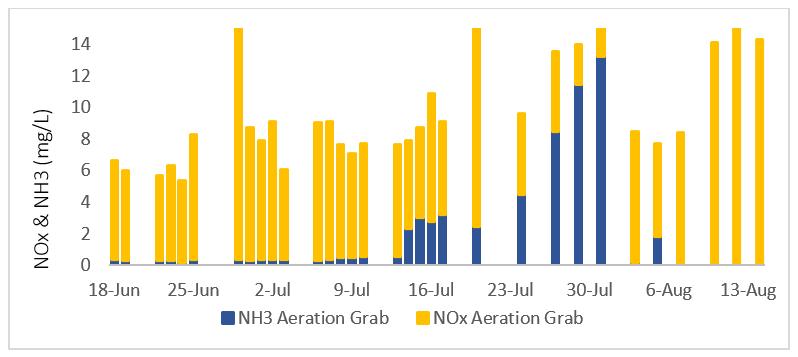
Figure 5. Nitrogen removal loading and cost of the carbon source per day in Aeration Tank No. 6.
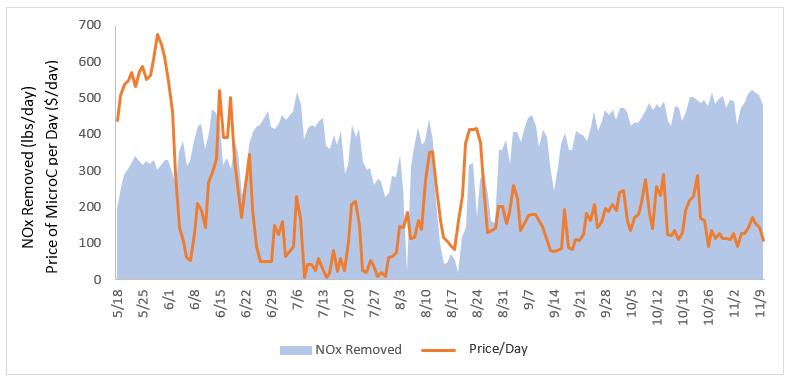
Table 1. Summary of the process performance during the evaluation trial.
Start Date End Date GRAB NOx Aeration Effluent in Tank 6, mg N/L GRAB NOx Anoxic Effluent in Tank 6, mg N/L GRAB NOx Aeration Effluent in Tank 5, mg N/L PROBE NOx Aeration Effluent in Tank 6, mg N/L PROBE NOx Anoxic Effluent in Tank 6, mg N/L NOx Removed, lb N/day Set Point MicroC Dosed, gpd gal MicroC/ lb NOx-N removed Price MicroC $/day Pre-Trial
18-May 27-May 6.2 0.69 19.62 8.3 1.7 300 1.5 264 0.8 540
a 27-May 17-Jun 5.4 0.31 16 7.8 1.4 350 2.5 170 0.4 350
b 25-Jun 30-Jun 11.9 1.32 19.73 11.5 3.4 430 3.0 36 0.2 75
c 16-Jul 1-Aug 6.7 0.59 22.31 8.4 1.7 325 1.5 33 0.1 70
d
4-Aug 20-Aug 10.5 5.65 25.11 7.0 2.3 210 1.5 87 0.6 180
Post-Trial
1-Sep 12-Nov 7.02 0.5 17.28 9.2 1.1 440 1.5 78 0.1 160 carbon addition improved the nitrogen removal performance by 67 percent.
After Evaluation
The results confirmed that the process modifications and the addition of the carbon source were capable of reducing the effluent NOx of Aeration Tank No. 6 to below 10 mg N/L, as shown in Figure 2b. Once the process remained stable, without any instrumentation or process upsets, the Nitrack anoxic set point of 1.5 mg N/L was met consistently with the calibrated automation system. On September 1, the facility reduced the number of online trains from four to three, consequently increasing the flow and nitrogen loading to each train. As a result, the influent train flow increased from 1.71 to 2.28 mgd, subsequently decreasing the IR ratio since the pump capacity was at 5.5 mgd. With a 55 percent increase in influent flow, the IR ratio decreased by 23 percent (3.14Q to 2.42Q). Figure 2b illustrates that the anoxic effluent NOx-N set point was consistently met, with an average concentration of 1.17 mg N/L.
Troubleshooting
Fine-Tuning and Optimization
The MicroC feed to the anoxic basin was optimized using the Nitrack controller and two Nitratax probes located at the end of the aeration basin and the end of the anoxic zone. The combination of feedforward and feedback control was modified, and some additional sitespecific variables were altered until periods of overdosing and underdosing were minimized and the optimal carbon dose was achieved. Section (a) in Figure 2a shows the period of operation (between May 27 and June 21) when the controller modifications were implemented. Figure 2a shows that the MicroC utilization decreased significantly from 0.8-gal MicroC/lb NOx-N removed to 0.3-gal MicroC/lb NOx-N, while similar NOx removal was achieved.
Dosing
The MicroC dosage into Train No. 6 halted for a short period of time due to some issues at the facility. Pump No. 1, which fed the anoxic zone and was being controlled by the Nitrack, was turned off between June 25 and July 1, resulting in the effluent NOx of both the anoxic and aerobic basins to spike, as seen in section (b) in Figure 2a. Manual Pump No. 2 was turned off early in July through July 31; thus, the additional 24 gal of MicroC into Train No. 6 were not received.
Nitrification
On July 5, the plant accidentally wasted


