10 minute read
Model-Predictive Ammonia Control Saves Energy and Improves Water Quality
Alex Ekster
The wastewater industry is trying to address the water-energy nexus in an integrated and proactive way. Advanced automation of the activated sludge process is one of the methods to reduce carbon footprint and improve water quality at the same time. This article describes machine learning and model-predictive control methods used to upgrade an automatic control system installed at the 12-mil-gal-per-day (mgd) City of Chico wastewater treatment plant (WWTP).
Advertisement
Methods and Materials
Plant Description
The WWTP is located in Northern California. The plant treats a mix of municipal and industrial wastes. The nitrification activated sludge system consists of three parallel aeration tanks, each designed as a two-pass system (Figure 1).
Each tank consists of two anaerobic compartments located up front (zones 1 and 2), one small swing compartment (zone 3), and an aerobic compartment that is divided into four zones; two of them (zones 4 and 5) in pass 1, and two (zones 6 and 7) in pass 2. Air to each zone is provided by a corresponding air grid.
Description of Control Elements
Each aertion drop leg is equipped with a manual butterfly valve. While the manufacturer’s characteristics for all of these valves are the same, the installed characteristics are quite different (see an example in Figure 2).
In 2016, manual butterfly control valves (15 altogether) were automated with EPI2 electrical actuators (Emerson-Keystone; St. Louis, Mo.). In 2018, due to frequent actuator failures and issues with vendor’s customer service, many EPI2 actuators were replaced with those from another manufacturer (Limitorque; Lynchburg, Va.).
In 2016, each drop leg (15 altogether) was equipped with thermal flowmeters (Kurz; Monterey, Calif.). These meters are characterized by a small-time delay (0.25 seconds constant) and good repeatability (0.13 percent of a full scale). Some of the flowmeters are equipped with pressure sensors.
The same year each aerobic zone and each swing zone (15 altogether) was equipped with LDO dissolved oxygen (DO) meters (HACH; Loveland, Colo.). Later, self-cleaning features were added to 100 percent of the DO meters.
Ammo:lyserTM meters (s::can Measuring Systems LLC; North Attleboro, Mass.) were selected for measuring ammonia and installed at 75 percent length of the aeration tanks (zone 6).
Total suspended solids (TSS) meters (Cerlic Environmental Control; Atlanta, Ga.) were installed in each aeration tank and on the return activated sludge line.
All the meters and actuators were procured using the plant’s operations budget and installed by plant staff. The staff also connected all control loop elements to the plant supervisory control and data acquisition (SCADA) system using wireless technology (Phoenix Contact; (Middletown, Pa.).
Description of the Model-Predictive Control Machine Learning Systems Utilized
The WWTP uses two model-predictive control machine learning (MPCML) systems (Ekster and Associates; Boca Raton, Fla.): one system (SRTmasterTM) is controlling the sludge age and another one (DO/NmasterTM) the air flow. Due to the complexity of MPCML calculations, both systems are installed on Windows servers. The servers communicate with plant SCADA open platform communications (OPC) protocol.
Description of the SRTmaster
The SRTmaster (Figure 3) consists of suspended solids meters, a controller, a waste flow meter, and a flow control element (a control valve or a pump with variable frequency drive).
Information from the suspended solid meters is sent to the controller; the controller then compares the operational criteria, such as mixed liquor TSS or the calculated real-time sludge age, with the target value, calculates the necessary adjustment to the sludge waste flow, and sends a signal to the control element.
The SRTmaster control algorithm consists of the following algorithm blocks: data verification, calculations, and a safeguard (Figure 4).
A data verification block filters out erroneous input data and determines a meter drift. A TSS signal filter algorithm utilizes a proprietary pattern recognition method that’s based on nonparametric statistics, autocorrelation, and other machine learning techniques. Nonparametric statistics are used instead of traditional statistical models because TSS data are not normally distributed.
An activated sludge model is used for detecting TSS meter drift and alerting operators about the necessity to recalibrate TSS meters.
The data verification block also detects problems with waste flow control by analyzing in real-time the performance of a waste flow controller. If a problem with either flow meters or any other waste flow control elements (pump, valve, etc.) is identified, the program sends an alert to the operators.
Finally, a data verification block automatically alerts operators when either sludge inventory in the aeration basins or a mass of waste flow exhibits significant deviation from the norm. These pattern changes could be symptoms of a significant change in the influent biochemical oxygen demand (BOD) or a change in sludge inventory distribution between aeration basins and clarifiers. This may be caused by an increase of sludge blanket in the clarifiers.
A calculation block, which is a pivotal part of the algorithm, utilizes the proportionalintegral (PI) control law. Preliminary analysis of the waste control loop showed that it would require up to a year to tune the PI controller using a traditional “trial and error” method.
To reduce the time of algorithm development and tuning, a computer GPS-X activated sludge simulator was utilized.
The GPS-X model for each plant was calibrated using field data. A match between calculated and actual wastage was used as the criterion for the modeling. After the model calibration, a computer-simulated response of the system with solids retention time (SRT) feedback is utilized for the selection of both reset time (Ti) and proportional gain (Kp).
The following criteria are used for designing the SRT controller:
S At a proportional gain equal to twice the Kp design value, waste rate values shall not start to diverge.
S The magnitude of each successive oscillation peak of waste rate values during a change should not exceed one-fourth of the previous peak.
The Kp and Ti values were investigated for the range of potential SRT setpoints. Both upward and downward steps toward a target value were simulated. The selection of each pair of optimum Kp and Ti for each target value usually requires at least 10 simulations. Based on the simulation, the relationship between Kp and SRT is determined for each activated sludge system.
The calculated waste flow signal is filtered using a low-pass filtration algorithm, while also utilizing nonparametric statistics; then, the signal is sent to a safeguard block. The purpose of this block is to check that the waste flow calculated by the controller will not have a negative effect on the plant processes.
Before the output signal is sent to the flow control element, the safeguard block checks whether new sludge waste flow may cause one of the following problems:
S Overload of clarifiers
S Overload of sludge processing facility
S Underload of sludge processing facility
S Excessive variation of waste flow (load)
S Excessive change in biomass inventory.
If any of these conditions is identified, the waste flow output signal is automatically corrected to avoid these problems. Also, a waste flow output signal was corrected using a proprietary algorithm when minimum variability of waste mass over 24 hours was beneficial for the waste sludge processing facility (dissolved air flotation [DAF], gravity thickeners, etc.).
Description of the DO/Nmaster
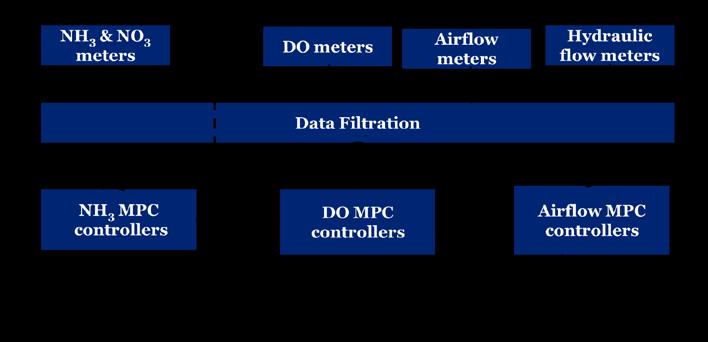
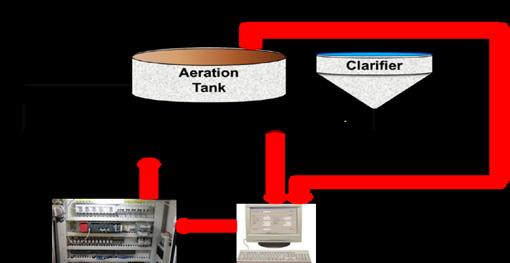
The DO/Nmaster control system consists of three cascaded control loops (Figure 5): airflow, DO, and ammonia. The following are
Continued on page 12
Continued from page descriptions of control algorithms for each control loop.
Airflow Model-Predictive Controller
Traditionally, airflow is controlled using a proportional-integral-derivative (PID) algorithm that’s linear. Control of valves with nonlinear characteristics (see Figure 1) using the PID algorithm often causes inaccurate and oscillatory behavior of the control loops. The fact that each aeration valve is controlled individually contributes to the oscillatory behavior of the aeration control. The DO/ Nmaster uses the machine learning (ML) algorithm instead of PID.
The ML algorithm is a simple decision tree that’s an implementation of an “if-then” algorithm. The decisions in the tree are followed from the root (beginning) node down and up a leaf node. The leaf node contains numeric responses.
The fine, medium, and coarse versions were tested for the decision trees. A coarse decision tree had few leaves (maximum number of four splits), a medium-complexity decision tree had a maximum number of 20 splits, and a fine decision tree had many leaves (up to 100 splits).
The DO/Nmaster uses the most advanced decision tree algorithms: a regularized gradient boosting machine (RGBM). The RGBM builds an ensemble of coarse trees in sequence, with each tree learning from and improving on the previous one.
Although coarse trees by themselves have poor predictive capabilities, they can be “boosted” to produce a powerful selection “committee.” The main idea of boosting is to add new models to the ensemble sequentially
In essence, boosting attacks the bias-variance tradeoff by starting with a weak model (e.g., a decision tree with only a few splits) and sequentially boosts its performance by continuing to build new trees, where each new tree in the sequence tries to fix up where the previous one made the biggest mistakes (i.e., each new tree in the sequence will focus on the training rows where the previous tree had the largest prediction errors).
Dissolved Oxygen Model-Predictive Control Machine Learning Controller
Classical model-predictive control (MPC) algorithms were used for DO control. For each zone, the DO transfer functions were generated using experimental data; then, each transfer function was fed through a Kalman filter into an MPC algorithm. A 10-step modeling and twostep control horizons were used in the MPC algorithms. The optimization cost function included a tracking error, the rate of change of manipulated variables, and other parameters.
During field testing of the developed state-space DO models it was found that experimental data often began to diverge from the forecast in less than an hour. To mitigate the divergence, stationary MPC algorithms were replaced with adaptive MPCs that also utilize the Kalman filter. These algorithms utilized the original transfer function structure (i.e., the number of state variables remained the same). Unfortunately, the adaptive MPCs did not provide the desired accuracy of DO control in zone 6 (at the end of the aeration tank). A new algorithm was developed to address this complication. The new algorithm updates both structure (i.e., the number of state variables) and coefficients of transfer models periodically.
Ammonia Model-Predictive Control Machine Learning Controller

Ammonia control algorithms utilize feedforward-feedback control laws. Feedforward control signals are calculated using machine learning methods using the PROPHET library developed by Facebook. The feedforward algorithm utilizes incoming ammonia load and historical data. The feedback control signals are calculated using the ammonia concentration in the corresponding zone. The control algorithm utilizes the classical MPC previously described.
Reliability Requirements for the Control System
The WWTP is staffed for only eight hours each day. The plant staff is supposed to consist of six operators, two electricians, and a plant manager; unfortunately, at this time and for the foreseeable future, the plant employs only three to four operators, one electrician, and a plant manager. For 16 hours a day the plant is unstaffed, which imposes very conservative reliability requirements (i.e., the control system is supposed to automatically identify unusual behavior of control elements, blowers, and diffusers, or a power failure and other abnormal conditions; automatically switch to an alternative control method that does not use the failed equipment; notify operators; and automatically switch back to normal operation when the problem is fixed).
Also, due to the blower discharge pressure problems previously described, there were requirements to smooth pressure changes during transients and to prevent an increase in pressure above the 0.648 bar (9.4 pounds per sq in. gauge [psig]).
The DO/Nmaster sensor and actuators fault-detection algorithms were customized for the WWTP conditions. Multicolor indication and alarm schemes were implemented using the DO/Nmaster interface (Figure 6). The alternative control logic was implemented for each failed control element (analyzers, flow meters, and actuators). The short-term electrical voltage variations and a switch from one source of energy to another were also addressed by special control algorithms.
Results
SRTmaster
Prior to SRTmaster installation, the plant had been experiencing high turbidity caused by pin floc; intermittent nitrification problems were also recorded. Both of these problems resulted in an increase in chlorine dosage and, in some cases, an increase of coliforms above the National Pollutant Discharge Elimination System (NPDES) limit.

Continued from page 12
After the installation of the automated SRT control system in 2014, the SRT setpoint was optimized and eventually maintained at 11 days (plus or minus 0.2 days). Since then, the frequency of the problems discussed here was significantly reduced. These improvements allowed the reduction of chlorine dosage and the NPDES limit violations were eliminated completely. The optimized and precisely controlled SRT was long enough to achieve stable nitrification, but was still below the minimum required for developing pin floc.
Installation of the automatic SRT control system at the WWTP allowed it to achieve 25 percent reduction in the polymer used for sludge thickening. Savings were achieved due to a significant reduction in variability of sludge mass loading on the thickening facilities. As was discussed in the Methods and Materials section, the proprietary algorithm within the automated SRT control software provides the stability of sludge wasted mass.
DO/Nmaster
The accuracy of ammonia control was evaluated based on maintaining the ammonia target in zone 6 (75 percent length of the aeration tank) since there are no ammonia meters installed in zone 7. Ammonia target in zone 6 was chosen by plant staff based on these criteria: S Necessity of maintaining zero ammonia and nitrite concentrations at the end of the tank
S Energy saving goals
The plant staff decided that ammonia concentration equal to 3.5 mg/l should target the winter-spring season; during the summerfall season, this target was increased to 5mg/l.
Results showed that the average and median values were 0.2mg/l below the setpoint. The standard deviation was equal to 0.3 mg/l. The setpoint was maintained within 1 mg/l, 90 percent of the time. Typical hydraulic, DO, and ammonia profiles are shown in Figure 7.
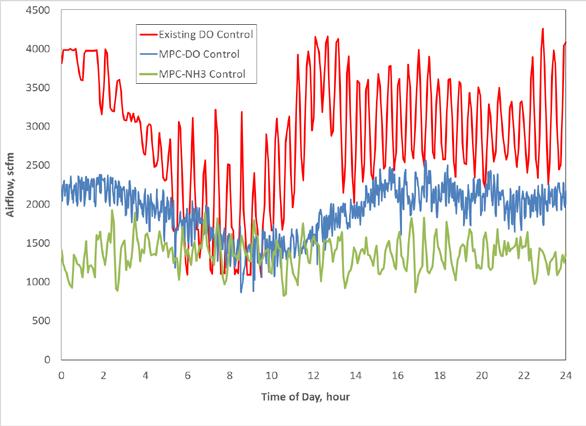
Airflow was reduced by as much as
60 percent. Airflow reduction achieved by upgrading to the DO/Nmaster controller is illustrated in Figure 8.
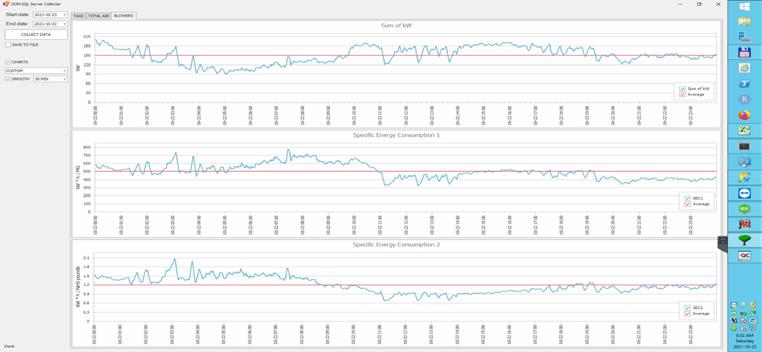
Under the original DO control, constant pressure was maintained; the DO/Nmaster maintained variable pressure, depending on the air demand. A combination of airflow reduction and pressure reduction led to more than 50 percent reduction in energy usage. As can be seen in Figure 9, daily energy demand was reduced to 500 kilowatt/mil gal (kW/ MG). While using traditional PID DO control, the energy demand for nitrification plants equipped with primary clarifiers is between 880 and1500 kW/MG.
Conclusions
The methods discussed showed the following outcomes:
1. Computer-generated models can overcome processes nonlinearity and time delays much better than the traditional PID control. As a result, the machine learning model-predictive control significantly improves control accuracy.
2. SRTmaster maintained the sludge age target with around 2 percent accuracy.
3. Ninety percent of the time, DO/Nmaster maintained the ammonia concentration target within 1 mg/l from the setpoint.
4. Optimization and precise control of sludge age reduced effluent turbidity, improved disinfection, and reduced thickener polymer usage by more than 25 percent.
5. Optimization and precise ammonia control reduced daily average energy demand by 60 percent. Daily energy usage was reduced to 500 kW/MG (similar plants usually consume between 880 kW/MG and1500 kW/MG using traditional PID DO control). S


