27 minute read
Integration of a Distribution System Tracer Study Into a Water Quality Model to Control Disinfection Byproducts in a Potable Water
FWRJ Integration of a Distribution System Tracer Study Into a Water Quality Model to Control Disinfection Byproducts in a Potable Water System
Greg Taylor, Benjamin Yoakum, and Curtis Wade
Advertisement
The University of Central Florida (UCF) owns and operates its potable water system, which supplies water to UCF’s main campus and some outlying areas. From 2016 to 2020, UCF distributed approximately 0.733 mil gal per day (mgd) of potable water to campus facilities, classrooms, and student residences. The majority of UCF’s water supply comes from four Upper Floridan aquifer (UFA) source wells that are permitted through the St. Johns River Water Management District (SJRWMD). This raw source water is treated at UCF’s water treatment plant (WTP), which aerates water to remove hydrogen sulfide and then chlorinates the water for primary disinfection and residual disinfection prior to pumping into UCF’s distribution system.
The UCF utilizes sodium hypochlorite to disinfect the water and provide residual disinfection in the distribution system. Two regulated groups of disinfection byproducts (DBPs) form when natural organic matter (NOM) in source water comes into contact with this disinfectant: total trihalomethanes (TTHMs) and a group of five haloacetic acids (HAA5s). Historically, compliance with TTHM regulations has been challenging for UCF during periods of the year when the university is not in session and water demand decreases.
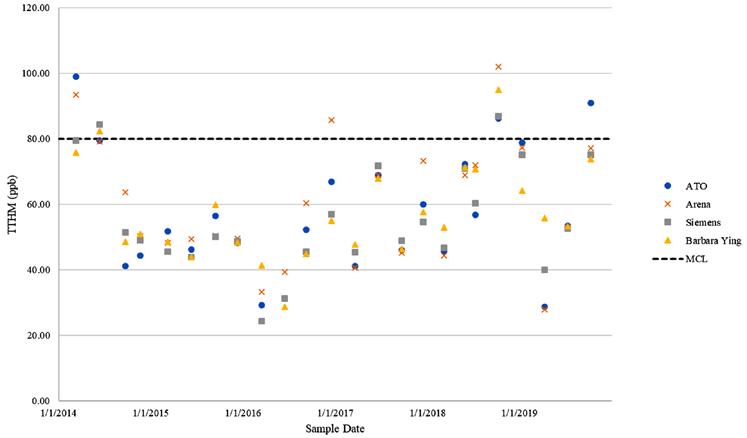
Figure 1 shows historical TTHM compliance results for UCF’s four monitoring sites. Over the evaluated time period UCF has been out of compliance for TTHMs in one quarter in 2014 and one quarter in 2018.
Both TTHMs and HAA5s form when organic matter naturally found in groundwater is oxidized during disinfection with free chlorine. The amount of TTHMs and HAA5s that form is dependent on the following: S Chlorine dose – The higher the chlorine dose, the greater the DBP formation.
Greg Taylor, P.E., is senior project manager at Wright-Pierce in Orlando. Benjamin Yoakum, P.E., Ph.D., is research and innovation project manager with Orange County Utilities in Orlando. Curtis Wade is utilities director with the University of Notre Dame in Notre Dame, Ind. At the time the article was written, Benjamin Yoakum was a project engineer at Wright-Pierce in Orlando and Curtis Wade was utilities and energy services senior director with the University of Central Florida in Orlando.
S Type and concentration of NOM in the source groundwater – The greater the concentration of NOM, the greater the
DBP formation. S The amount of time the disinfectant is in contact with NOM – The longer chlorine is in contact with NOM, the greater the DBP formation. S Temperature of water – The higher the temperature, the greater the DBP formation. S pH – The higher the pH, the lower the formation of HAA5s, but the higher the formation of TTHMs. S Bromide – The higher the concentration of bromide, the higher the DBP formation.
There are treatment options and operational strategies that can be implemented to reduce TTHM and HAA5 formation. These strategies include: S Reducing the amount of chlorine used during disinfection. The reduction in chlorine dose is limited by the requirement to maintain a minimum free chlorine residual of 0.2 mg/L within the potable water distribution system. S Modifying the treatment process to utilize chloramines for residual disinfection in lieu of free chlorine can reduce the DBP growth in the distribution system.
S Reducing the amount of NOM, specifically DBP precursor matter, prior to disinfection. Reduction of precursor matter can be accomplished with a variety of treatment options, including granular activated carbon (GAC), ion exchange, and membrane treatment. S Reducing the amount of time water containing NOM is in contact with the disinfectant. This contact time can be reduced by looping dead end or low-use distribution mains or implementing a flushing program. Flushing is limited by cost and consumptive use permit (CUP) considerations. S Aeration of chlorinated water can strip formed TTHMs from treated water where the contaminant is transferred from the liquid to the air. This treatment process does not appreciably remove HAA5s and does not prevent the reformation of
TTHMs postaeration.
Given the historical difficulties complying with TTHM regulations, UCF has implemented two of these strategies to reduce the concentration of DBPs in its distribution system: 1) Potable Water Flushing: UCF installed automated flushing stations throughout the potable water distribution system.
These stations are automated to flush potable water at a set flow rate for a selected duration. Operations can adjust the timing and quantity of flow at each flushing location. Potable water flushing is limited by the UCF’s CUP and the total water withdrawn from UCF’s permitted wells cannot exceed a set value listed in the CUP. 2) Spray Aeration: UCF installed a spray aerator and tank mixer in its ground storage tank (GST) to aerate chlorinated water and keep the GST well mixed. This aeration process strips TTHMs from the water and reduces their concentration in the finished water. This results in a reduced concentration of TTHMs leaving the WTP; however, they can continue to form in finished water after they are stripped, so if water resides in UCF’s distribution system for an extended period of time, TTHMs can reform and exceed 80 parts per bil (ppb) at maximum contaminant level (MCL).
To optimize its flushing program, UCF performed an evaluation to quantify two variables that, in conjunction, could determine if TTHMs would be expected to exceed regulated levels in the distribution system. The two variables were the rate of DBP formation and the detention time of the water in the distribution system. The overall goal of the evaluation was to better understand TTHM formation in the distribution system to reduce flushing and associated maintenance costs. The rate of DBP formation in the distribution system was determined by performing a tracer study. The detention time of water throughout the distribution system was predicted by the development of a hydraulic model. Integrating tracer study results with hydraulic modeling can produce a water quality model capable of assessing TTHM concentrations throughout UCF’s distribution system under various flow regimes.
Test Instrument Analysis Location
pH/Temperature HACH HQ40d Field Conductivity HACH HQ40d Field Free Chlorine HACH Pocket Colorimeter II Field TTHM / HAA5 Gas Chromatograph Certified Laboratory*
*Orlando Utilities Commission Water Quality Laboratory
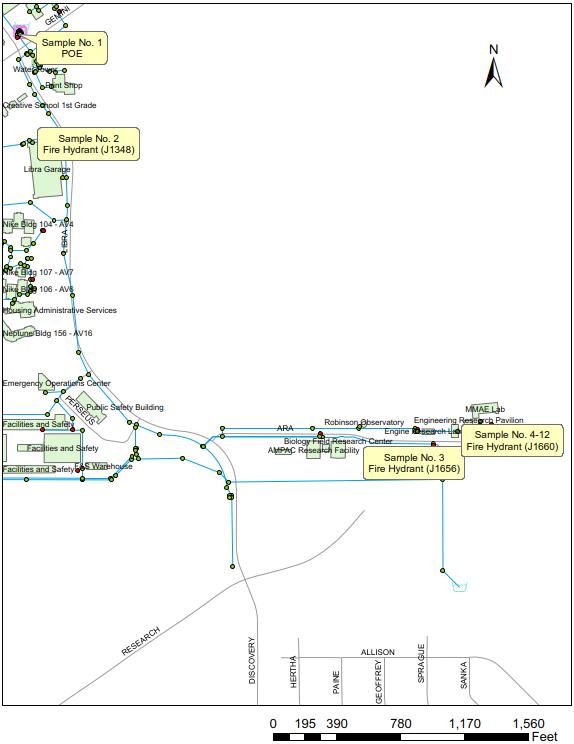
Figure 2. University of Central Florida’s tracer study sampling locations.
Methods and Materials
Distribution System Tracer Study
A tracer is a substance that is injected into a system that can be tracked (or traced) as it travels through the system, over time, and it does not react with other water quality parameters, nor degrades over time. For UCF’s tracer study, the selected tracer was table salt (sodium chloride) and the system was UCF’s potable water distribution system. Dosing salt into water leaving the WTP and entering the distribution system increased the conductivity of water from its baseline value. Conductivity in the distribution system can be measured as the water travels throughout the system. If the conductivity remains at the baseline value, the analyst knows the salt tracer has not made it to that location in the distribution system. Conversely, if the conductivity increases to above the baseline value the analyst knows the tracer has made it to the distribution system location being sampled. Using an initial timestep as the point at which the tracer is injected into the system, the age of the water can be ascertained when the conductivity increases above the baseline value.
The remainder of this subsection describes the protocol performed during UCF’s tracer study.
Prior to the tracer study, UCF contacted and received written approval from the Florida Department of Environmental Protection (FDEP) to perform such a study in UCF’s public water system. Pursuant to FDEP approval, UCF posted a public notification describing the study prior to initiating study activities.
On the morning of the tracer study, an initial batch of the salt dosing solution was produced by mixing food grade table salt with finished water from UCF’s point of entry (POE) tap in a food grade 55-gal drum. Throughout the duration of the study additional batches of the salt solution were produced to refill the drum. A National Science Foundation (NSF) 61-compliant chemical feed pump was used to dose the salt solution into the suction header pipe of the WTP’s high-service pumps. These pumps helped to mix the salt solution with finished water before the water entered the distribution system.
Figure 2 shows the monitoring route where the tracer was tracked as it flowed through UCF’s distribution system. Prior to dosing, the hydrant at the end of the monitoring route (Hydrant J1660; see Figure 2) was opened and the flow was set at approximately 150 gal per minute (gpm). This artificial flow helped pull fresh water containing the salt tracer through the distribution system, along the monitoring route and to this terminal location. After the hydrant was opened and flowing at approximately 150 gpm, dosing at the WTP commenced.
Once the tracer entered the distribution system it was traced through the system from POE to the terminal hydrant. The following describes the procedure used at the first monitoring location in UCF’s distribution system: Sample Location No. 2 (see Figure 2).
Upon arriving at Sample Location No. 2 the hydrant was flushed, and then left to continually flow at approximately 5 to 10 gpm. The conductivity of the water was measured continually using a probe until there was a measured rise in conductivity, which indicated the tracer had reached the location. After the tracer had reached the sample location, a water sample was collected and measured for free chlorine residual. Then, another water sample was collected and quenched for TTHM and HAA5 analyses at a certified laboratory. This process continued at subsequent locations until the terminal hydrant was reached.
After the tracer reached the terminal hydrant the free chlorine residual was measured and TTHM and HAA5 samples were quenched for laboratory analysis. Then, water was flushed from the hydrant for an additional 15 minutes. After that time, the hydrant was closed and the chemical feed
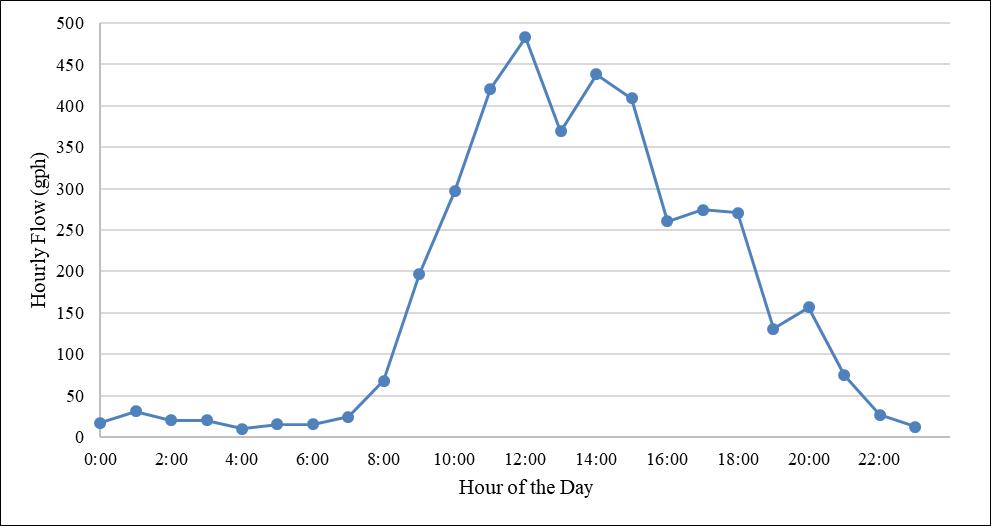
Figure 3. Classroom Building I diurnal potable water demand.

Continued from page 16 pump dosing the tracer was turned off. Water with a known age was now captured in the terminal pipeline and could be sampled over the following days. Note that selection of a terminal pipeline that has only minimal flow is required to ensure that fresh water is not pulled into the terminal pipeline over the next several days of testing.
Over the next several days an analyst would return to the terminal hydrant to sample water. For each sampling event, samples were collected from the terminal hydrant, free chlorine residual was measured, and samples were quenched for TTHM and HAA5. An analyst would continue to return to the terminal hydrant and sample until either: 1) the chlorine residual at the location had decayed to a value of less than 0.2 mg/L (the minimum allowable limit); or 2) the conductivity at the terminal location decreased back to the baseline value, which would indicate that the water from the day of dosing was no longer in the terminal pipeline that feeds the terminal hydrant.
Table 1 presents the water quality testing instruments used during the study and identifies where samples were analyzed.
Metering Data Preparation for Modeling
Modeling of water flow in UCF’s distribution system was performed by assigning a set quantity of potable water flow to each building or facility that demands potable water and then describing how the water flow (i.e., demand) varied over a time period. How potable water demand varied over a period of time for a specific facility or group of facilities can be described nominally as a demand pattern.
In a traditional potable water system that serves residential, commercial, and industrial customers, water demand varies throughout the day. For residential customers, there is typically a peak in water demand in the morning hours when people are waking up and preparing for work, and a subsequent peak in the evening after people are returning from work and preparing meals. During midday there is normally moderate water demand, and then during the night there is typically low water demand while people are asleep. For commercial customers, there is typically low demand in the morning and evening, but a peak during midday when people are shopping, or at offices and restaurants.
The UCF potable water system aligns more with the commercial demand pattern, with relatively low demands in the early morning and evening hours, and then a large peak in water demand during the midday period. This is due to a large portion of the demand being attributed to students, faculty, and staff who live off campus, but are on campus during the day to attend classes, eat at on-campus restaurants, or work at the university. This can be seen in Figure 3, which presents the diurnal demands for Classroom Building I, which is served by UCF’s potable water system.
The data used to create Figure 3 came from hourly flow totals, captured every hour at the building from May 1, 2016, to May 1, 2019, representing approximately three years of data. This large diurnal flow variation is important when evaluating the water flow through the distribution system.
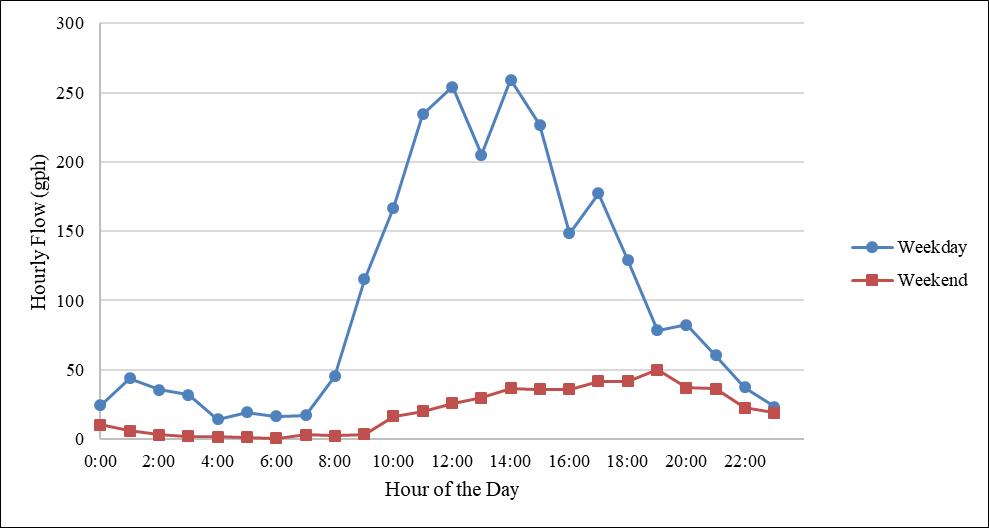
There is a fairly unique potable water demand at UCF throughout the week as well. During the standard workweek, when most classes are in session (i.e., Monday through Friday), there is significantly more potable water demand than on the weekend. Figure 4 shows the demand pattern difference between the workweek and weekend for Classroom Building I.
The data used to create Figure 4 were the same data used to create Figure 3; however, only data from weekdays were used to create the “weekday” line in Figure 4 and only data from weekends were used to create the “weekend” line. As shown in the figure, the “weekday” hourly flow values for each building are significantly higher than the “weekend” hourly flow values. This reflects a wide variation from the average daily flow when considering all seven days of a week. This large variability indicates the need to differentiate the potable water demand in modeling for both weekdays and weekends to accurately reflect the system demand. The water age will be significantly higher after a weekend of little to no demand. Using an average of all seven days to reflect weekend flow would show a lower water age, which is not accurate.
In addition, UCF has a unique potable water demand during periods of time when the university is in session (i.e., classes are being held, referred to as “in session”) when compared to periods of time when the
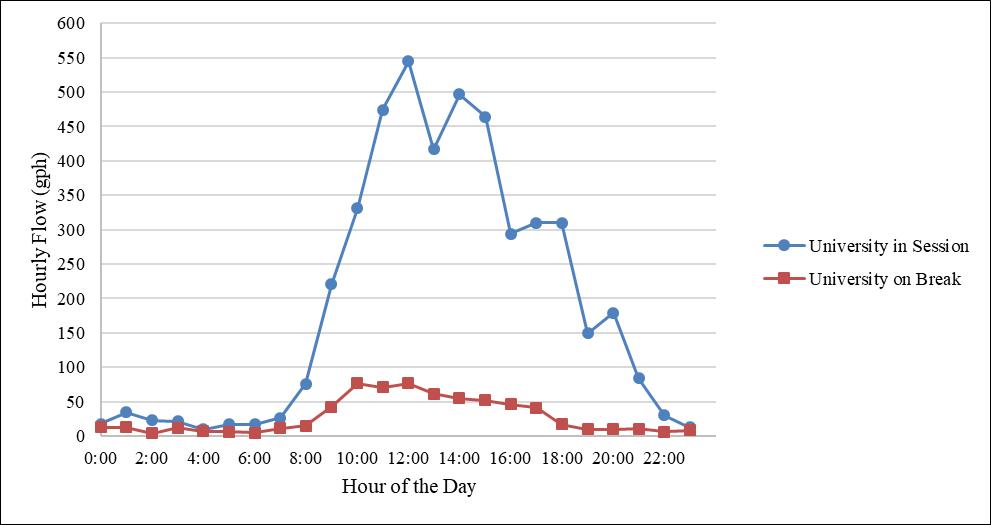
Figure 5. Classroom Building I potable water demand (in session versus on break).
Table 2. Evaluated Potable Water Demand Scenarios
Demand Scenario
Day of the Week (Average1/Weekdays/Weekends)
University Academic Period (Average1/In Session/Out of Session)
1 Average Average 2 Weekdays Average 3 Weekends Average 4 Average In Session 5 Weekdays In Session 6 Weekends In Session 7 Average Out of Session 8 Weekdays Out of Session 9 Weekends Out of Session
university is out of session (i.e., classes are not being held, referred to as “on break”). Figure 5 shows this difference for Classroom Building I. As depicted in Figure 5 there is significantly more flow in the building when the university is in session compared to when it’s on break. This large variability requires a differentiation between time periods when the university is in session and time periods when it’s on break, rather than simply taking the average flow for all time periods.
As a result of these findings, these demand criteria are important to incorporate into hydraulic modeling to appropriately represent different time periods so that water age during these periods can be evaluated; therefore, nine demand scenarios were created to represent each combination of demand criteria. These demand scenarios are presented in Table 2.
Figure 6 shows the potable water demand for each of the nine scenarios for Classroom Building I. Note that in the figure, the highest potable water demand occurs during weekdays when the university is in session and the lowest demand occurs during weekends when it’s out of session. So, UCF expects to find the lowest water age in its distribution system on weekdays, when school is in session (highest flow scenario), and conversely, expects to find the highest water age in its system on weekends when school is not in session (lowest flow scenario).
The UCF has close to 200 potable water meters, and if every meter had nine demand patterns developed for each unique meter (representing each demand scenario), then over a thousand demand patterns would need to be developed. This would result in a model that would be hard to manage; therefore, meters were further categorized by specific use type to create a manageable data set that could be efficiently modeled, while at the same time remain representative of the data set.
Meters were sorted into one of five categories/groups; the UCF operations staff was consulted to ensure accurate categorization. These categories, a description of each category, and the total number of meters sorted into each category are presented in Table 3. Water demand associated with the meter categories of Classroom, Student Residence, Facility, and Other is not controlled by UCF operations, but rather is based on the daily potable water use in each building. The UCF operators do control the flow through the meter category of Autoflusher, which is used to flush water from the distribution system to maintain water quality through reduced water age. As a result, demand patterns were not developed for this group of meters.
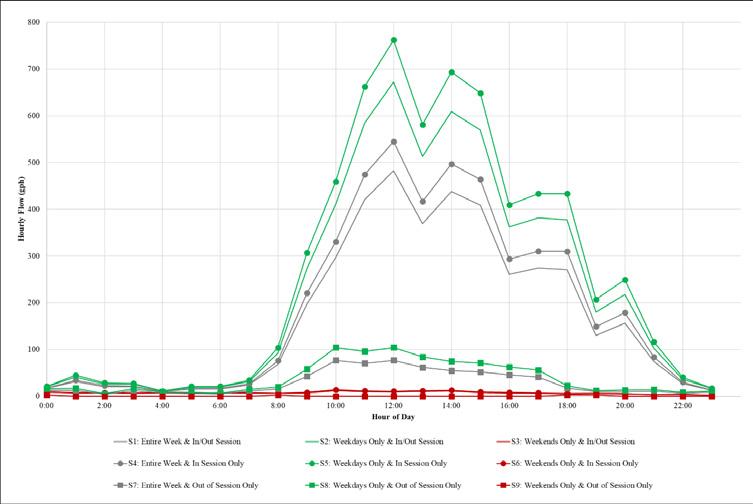
Figure 6. Classroom Building I potable water demand scenario results.
Table 3. Meter Categories and Associated Descriptions
Meter Category
Number of Meters Description of Meter Category
Classroom 37 The meter serves a building that is primarily used only during days when the university is in session and in most cases is used as a classroom. Student Residence 46 The meter serves a building that students live in while on campus. Note: this category includes both "term only" residences and "full-year" or "12month" residences. Facility 68 The meter serves a UCF nonclassroom and nonresidence building that house offices or operations facilities.
Other 28 The meter serves a building that does not fit into one of the above categories. Autoflusher 6 The meter has a defined flushing pattern that can be set by UCF potable water utility operators.
Prior to creating the potable water demand patterns, the average, maximum, and minimum daily flow for each meter was calculated using monthly metering data and dividing by the number of days for that month. Most meters had monthly meter data for every month from May 2016 through March 2019, representing 35 records for each meter.
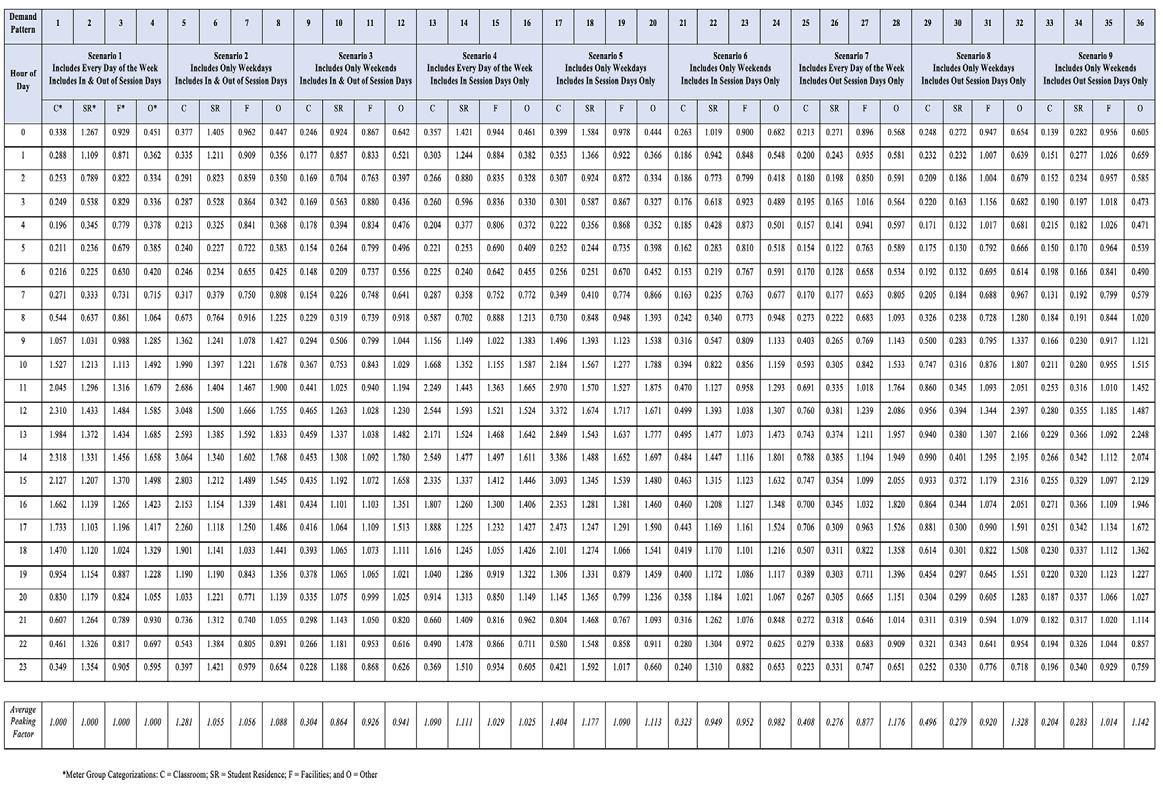
Thirty-six demand patterns were developed using hourly flow data from meters that were active during the evaluated time period. These 36 demand patterns equal the number of different combinations of the nine unique demand scenarios and the four meter groupings developed. Each demand pattern consists of 24 hourly peaking factors representing the flow through a meter for a specific hour of the day (e.g., 2 a.m.) for a specific scenario (e.g., Scenario 5: Only days
that are weekdays and only days when the university is in session). The peaking factor compares flow through a meter at a specific hour to the overall average daily flow. The resulting table of peaking factors is presented in Table 4. The last row of Table 4 calculates the average peaking factor for each demand pattern. This value represents the ratio of flow for the demand pattern when compared to the overall average flow through that meter group. For this reason, the first four demand patterns have an average peaking factor equal to 1, as these demand patterns represent the average meter data for every day. The other remaining scenarios and corresponding demand factors have average peaking factors greater than or less than 1. This is due to the fact that the peaking factors under these Continued on page 20 Florida Water Resources Journal • November 2022 19
Continued from page 19 scenarios only use a portion of the flow data used for developing the demand patterns.
When the average demand peaking factor is greater than 1, it means that the average flow for that time period is higher than average over an entire week. For example, in Table 4, Demand Pattern 5 has an average peaking factor of 1.281; this represents that, for this demand, the meters assigned to the Classroom category and during the weekdays (in and out of session), will have 28.1 percent more flow than the overall average flow for meters in this group. Conversely, an average peaking factor of less than 1 represents a lower average daily flow compared to meters in this group.
To model a water demand scenario each potable water meter needed to be assigned a flow rate for each hour of the day. This process was accomplished in the manner that follows.
For Classroom, Student Residence, Facility, or Other meters: 1. One of the nine water demand scenarios is selected. 2. Each meter is assigned a meter category. 3. The average flow for each meter is assigned to the meter and then divided by 24 to get an average hourly flow. 4. Each meter is assigned a demand pattern based on the selected demand scenario (Step 1) and assigned meter category (Step 2). The assigned demand pattern dictates the hourly peaking factors based in Table 4. 5. The flow rate for each hour of the day for each meter is calculated by multiplying the average hourly flow rate for a meter (Step 3) by the peaking factor for that hour (Step 4).
For autoflushing meters, hourly flow is assigned by the user. Typically, at UCF autoflushing meters are run in the early morning hours when system demand is low at a set rate; for example, from 2 to 4 a.m. at 50 gpm. This would result in an assigned flow of 3000 gal per hour (gph) for hours 2 and 3 and an assigned flow of 0 gph for hours 0, 1, and 4 to 23 for this meter.
Metering data are then loaded into a model to assess water age throughout the system.
Hydraulic Model Development
For systems as extensive as the UCF potable water distribution system, a computerized modeling program becomes an essential tool. The selected software for the modeling efforts was the InfoWater® platform by Innovyze™. InfoWater uses the ArcGIS platform where AutoCAD and geographic information system (GIS) shapefile features can be uploaded using the drawing’s scale, metadata, and other features. InfoWater is also capable of importing and exporting data to be used with other spreadsheet, database, and modeling software, such as Excel® and Access®.
There are two primary hydraulic modeling timestep options available to develop model scenarios: 1. Steady-State (SS) – An SS timestep captures a specific instance in time (snapshot) for the hydraulic model and does not look at
Table 4. Diurnal Demand Patterns and Hourly Peaking Factors
how the system reacts to changes. The SS modeling is the traditional option selected for master planning, as the focus is typically system pressures in relation to a change in potable water demand. The SS modeling is acceptable for predicting future pressures and hydraulic grade lines (HGLs) and estimating the sizes and routes of future pipes. 2. Extended Period Simulation (EPS) – The
EPS modeling evaluates how a system behaves over a period of time. This model adjusts to system changes over time and can reflect how the system reacts. This type of model is used for evaluating tank drain and fill cycles, monitoring water age and DBP formation, and evaluating how pumping systems ramp up and down on variable frequency drives (VFDs) or turn on and off in reaction to system flow changes.
Either of these analysis options can be employed in the system analyses, but are dependent on the purpose of the modeling and/or evaluation. The EPS model analysis option was selected to evaluate water age throughout the distribution system over a period of several days. This analysis would provide insights related to water age and associated DBP concentrations throughout the distribution system.
The UCF potable water model contained 1,253 pipes and 1,184 junctions/nodes. The 183 potable water flow meters were represented in the GIS system as discrete points. The next step in allocating demands to meters was assigning an average flow and meter classification to each geolocated meter. This was done by importing average flow values for each meter, assigning meter classifications for each flow meter, and matching these values to each meter using the meter identifications. Each of the 183 meters was then assigned to the closest node in the hydraulic model that also corresponded to the actual pipeline that the meter was connected to. Most meters were assigned to a dedicated node; however, there were some closely clustered meters that were assigned to a singular node, with an additive sum.
The final step in allocating demands was importing demand patterns into the model. Each of the scenarios from Table 2 was incorporated into the model with the associated demand patterns for each node. The demand patterns were assigned to each meter by importing peaking factors found in Table 4 and then assigning them to each meter based on the meter’s classification and the selected demand scenario.
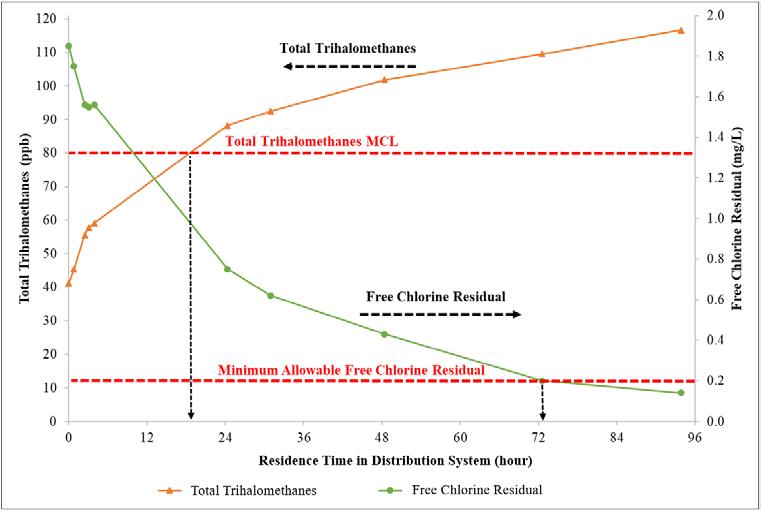
Figure 7. Tracer study results of distribution system total trihalomethane formation and free chlorine decay.
Results and Discussion
Tracer Study Results: Total Trihalomethane Formation Within the University’s Distribution System
Figure 7 presents the TTHM formation in the distribution system and the associated free chlorine decay measured from the same tracer study samples. This figure represents the best available data for how TTHMs form and free chlorine residual decays in UCF’s potable water distribution system. The following can be inferred from Figure 7: S Based on the free chlorine dose at UCF’s
WTP on the day of testing, TTHMs are expected to exceed the regulated MCL after approximately 18 to 24 hours in UCF’s distribution system. S Given the free chlorine dose at UCF’s
WTP on the day of testing, the free chlorine residual is expected to decay to below the regulated limit (0.2 mg/L) after approximately 72 hours in UCF’s distribution system. S Based upon historical data that UCF has not exceeded the regulatory MCL for
TTHMs, the practical water age target is 48 to 72 hours.
The UCF operators have the option of reducing the chlorine residual at the POE by decreasing the chlorine dose at the WTP; however, this would result in chlorine decaying below the regulated level of 0.2 mg/L in a shorter period of time (i.e., in less than 72 hours). It’s expected that water resides in UCF’s system for at least three days (72 hours), and as a result, this is not an appropriate DBP control strategy.
Modeling Results – Part 1: Simulated Water Age in the University’s Distribution System
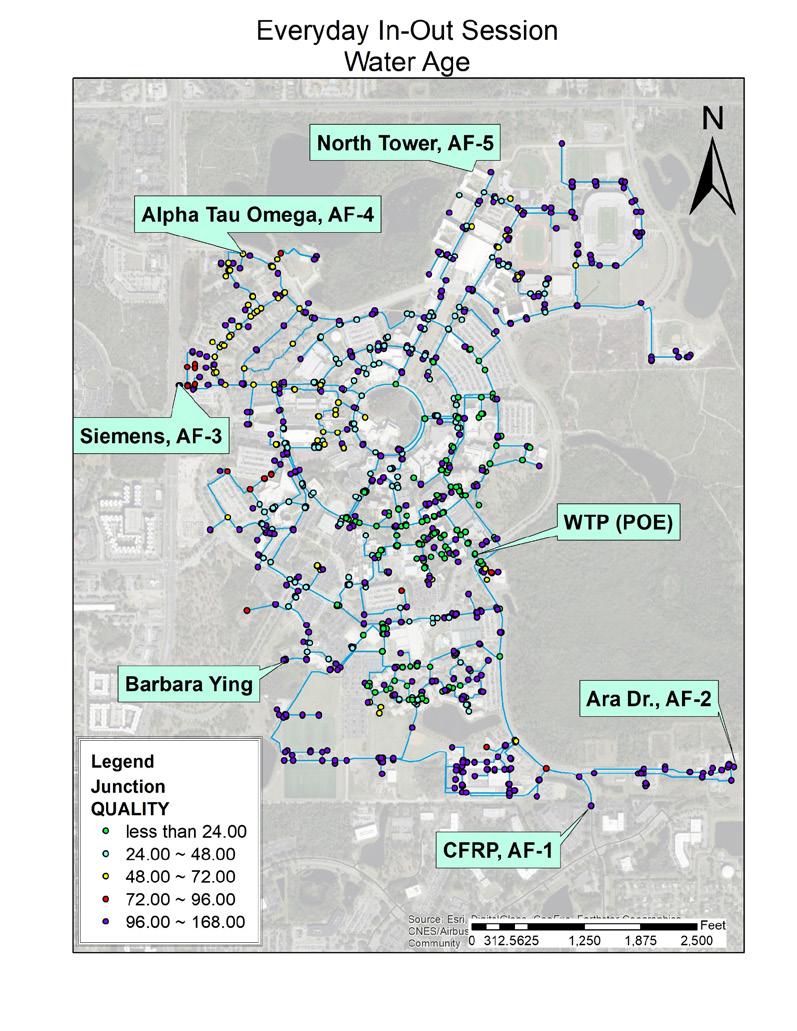
InfoWater was used to simulate water age in UCF’s distribution system for each developed demand scenario. Figure 8 shows the results of modeling Demand Scenario 1: Average Weekly Demand. This figure shows the water age at each model node in UCF’s distribution system. Results showed that only 18.7 percent of the modeled distribution system nodes had a water age of less than 24 hours without any potable water flushing. A similar modeling effort was performed for each of the other eight demand scenarios.
Modeling Results – Part 2: Simulated Total Trihalomethane Concentrations in the University’s Distribution System
The next modeling step was to integrate the TTHM tracer study results into water age modeling results. This was performed by importing the distribution system TTHM formation curve developed during the tracer study into the InfoWater model. InfoWater can then model TTHM concentrations, over time, for each water demand scenario. It should be noted that this additional modeling step can be omitted if desired. If the goal is to assess if TTHMs cross a threshold value—for example, the 80-ppb MCL—the user can look up the associated Continued on page 22 Florida Water Resources Journal • November 2022 21
Continued from page 21 TTHM concentration in the tracer study results and identify the associated critical water age. In UCF’s case, TTHMs were expected to exceed the MCL after 18 to 24 hours; therefore, modeling showed that water age could be used as a surrogate to assess anticipated compliance with TTHM regulations. In this evaluation, any node that had a water age of above 24 hours was color-coded to identify areas that were expected to have water with TTHM concentrations at or above the MCL.
The final step in modeling was to determine the amount of flushing required under each demand scenario to reduce TTHM concentrations in the system to below regulated levels (80 ppb, which corresponded to a water age of 18 to 24 hours). Figure 8 shows UCF’s five existing autoflushing stations within its distribution system. One additional autoflushing station was proposed at the location identified as “Barbara Ying.” For each scenario, the flow rate and duration of flushing at each station was adjusted. In general, if the water age around an autoflushing station was above the determined critical water age of 18 to 24 hours, then additional flushing at the nearest autoflushing station was needed. In some instances, it was prudent to add a line loop in the distribution system. The result of these efforts showed how optimal flushing could be accomplished under each demand scenario.
Autoflushing becomes cost- and CUPprohibitive if an excessive amount of water is flushed to reduce water age. During certain periods of the year, specifically when the university is not in session, UCF is required to flush a significant amount of potable water to remain in regulatory compliance. As a result, it was recommended that UCF add a treatment process that will remove DBP precursor matter, which would result in a reduction in TTHM formation potential. This would allow water to reside in the distribution system for a longer period of time without forming TTHMs in excess of the regulated MCL. In addition, this treatment addition would allow UCF to significantly reduce its need to flush potable water.
Findings Summary
A distribution system tracer study was performed with food grade sodium chloride to assess the TTHM formation potential and free chlorine residual decay in UCF’s potable water distribution system. The study results found that TTHMs reached the U.S. Environmental Protection Agency (EPA) MCL of 80 ppb after approximately 18 to 24 hours in the distribution system and free chlorine residual decayed past the minimum regulatory level of 0.2 mg/L after approximately 72 hours. While UCF has not exceeded the MCL for TTHMs, these are general guidelines for long-term planning with the hydraulic model.
Historical water usage data were used to develop nine unique potable water demand scenarios that characterize the potable water demand of UCF’s system during different periods of time throughout the year. These demand scenarios were imported into an InfoWater model that contained UCF potable water assets, including distribution system piping and potable water meters. A hydraulic model was developed that could estimate water age throughout the distribution system for each developed demand scenario. Modeling results showed that water age in several areas of the system exceeded 96 hours.
Tracer study results were integrated into the hydraulic model to predict TTHM concentrations throughout the distribution system. The goal of subsequent modeling efforts was to optimize flushing to reduce the amount of potable water being flushed, while also maintaining compliance with TTHM regulations. Model runs were completed to determine optimal flushing regimes for each developed demand scenario.
Recommended short-term improvements, elucidated through modeling, included the addition of several line loops in the distribution system and the construction of an additional autoflushing station. The recommended longterm improvement was to add a treatment process that will remove DBP precursor matter, which would result in a reduction in TTHM formation potential. This improvement would greatly reduce the concentration of TTHMs throughout UCF’s distribution system and significantly reduce potable water flushing in the system. S


