Funding
This work was carried out as part of the LINC project (formerly named TUPPAC – Transforming Urban Planning Providing Autonomous Collective Mobility), which involved a larger consortium led by Gate21. The consortium includes Municipality of Albertslund, Municipality of Gladsaxe, Nobina Danmark A/S, IBM Danmark ApS, Roskilde University (RUC) and The Technical University of Denmark (DTU). The project is funded by project partners and the EU programme Urban Innovative Actions (UIA), which is supporting the project with 25 million DKK.


Demand for public transport with automated egress solutions
Mikkel Thorhauge*, Anders Fjendbo Jensen, Jeppe Rich Department of Management, Technical University of Denmark, DTU, 2800 Kgs. Lyngby, Denmark
Declaration of interest
On behalf of all authors, the corresponding author states that there is no conflict of interest.
Author contributions
The conceptualisation was developed by Anders Fjendbo Jensen and Mikkel Thorhauge in close collaboration with Jeppe Rich. The stated choice experiment was designed by Anders Fjendbo Jensen and Mikkel Thorhauge Survey development was undertaken by Hjalmar Christensen in coordination with Anders Fjendbo Jensen and Mikkel Thorhauge. Gate 21 have been responsible to the recruitment process,whilethedatacollectionhaspartbeencarriedout byIBMandpartlybyAndersFjendboJensen and Mikkel Thorhauge. The model design and estimation was performed by Anders Fjendbo Jensen and Mikkel Thorhauge in close collaboration with Jeppe Rich. All authors contributed to the writing of the manuscript, and approved the final version.
Abstract
In this paper we explore user preferences with respect to autonomous shuttle busses when these operate as a first/last mile feeder mode to the main public transportation system The hypothesis we put to the test is, to what extent improvements first- and last mile public transport, through the use of autonomous door-to-door shuttle services, can be expected to affect choice of mode for the entire transport chain in comparison to choice of mode for the first- and last mile trip. The campus of the Technical University was used as a case study, and pivoted stated choice experiments were developed as part of a real-life experiment where several autonomous busses were operated at the DTU campus In the experiment, choice tasks were directed to users that specifically used the shuttle service. Our findings indicate that AV shuttle busses indeed attracted some existing public transport users, while almost no effect on overall mode shares was observed. This even holds for scenarios where speed and frequency of the busses are improved considerably compared to what was in the experimental setup. The paper thereby underlines that, while new autonomous driving technologies are likely to improve the public transport chain by improving first- and last mile services, it will have a limited effect on the overall choice of mode for the entire trip chain.
1 Introduction
Public transport services provide an important high-capacity mobility options in many cities around the world. A particular challenge for travellers using these services, however, is the service of the first and last part of the trip, commonly known as the first and last mile problem The problem can give rise to increased travel time and reduced comfort when first- and last mile connections are not efficient and located near the origin and destination of a needed trip.
Since 2009, ride-sourcing services have created new possibilities for door-to-door services and changed travel behaviour in cities such as New York, London and San Francisco (Aarhaug and Olsen, 2018) Ride-sourcing is an on-demand form of mobility usually arranged via smartphone applications (Stocker and Shaheen, 2017), which can be either personal but also carpooling with colleagues or shared rides with strangers (Dynamic ride sourcing) (Gurumurthy and Kockelman, 2020).
Research on currently available ride-sourcing services, however, suggests that such solutions can worsening traffic conditions in urban areas (Henao and Marshall, 2019; Beojone and Geroliminis, 2021; Erhardt et al., 2021; Schaller, 2021) due to a large proportion of empty driving when roaming and waiting for passengers and due to substitution with public transport and active modes. Pooled ondemand solutions where passengers with similar trajectory and departure time are combined and travel with the same vehicle have also been proposed. Such solutions require advanced sharing algorithms which has been the topic in several studies (Bischoff et al., 2018; Kucharski and Cats, 2020; Chakraborty et al., 2021)
In the recent years, there has been rapid development with respect to automated driving solutions. According to the SAE International (2021) taxonomy, (SAE International, 2021), a vehicle operating under automation level 4, should be able to operate with full self-driving automation within a defined area such as campus roads while a vehicle operating with automation level 5 will be able to operate with full self-driving automation in an unrestricted domain. While level 5 operation is still a long way off, several larger companies are currently getting far with level 4 operation. The technology could soon be relevant for new ride-sourcing services due to lower costs, which could lead to new types of services that would otherwise not be economically feasible (Becker et al., 2020)
The literature debates whether ride-sourcing (whether automated or not) is a substitute for, or a supplement to, PT (Hall, Palsson and Price, 2018; Nelson and Sadowsky, 2019) A simple and space efficient solution for an urban setting, is to introduce area-limited, demand-responsive automated vehicles as access and egress modes to existing high-capacity public transport (PT). This would
increase efficiency and comfort and thus attract travellers to PT, who would otherwise use private car. In such a setting, the service would clearly work as a supplement to PT and avoid the negative effects of ride-sourcing previously mentioned.
Some previous studies indicate that such a setting could have a positive effect on PT. Hall, Palsson, and Price (2018) indeed found that a large share of pick-up and drop-offs in a ride-sourcing system would already be at PT stations. Furthermore, Yan, Levine, and Zhao (2019) found that the major deterrents of an integrated ride-hailing and public transport service was transfers and additional pickups, but found that ride hailing providing a service directly to the destination of the traveller could greatly increase PT if the fleet of vehicles is increased to ensure acceptable waiting times and number of additional pick-ups. Such an increase is costly especially due to the need for more drivers and therefore such a setting in most cases is probably only feasible with automated vehicles.
Due to limited access to revealed preference data for ride-sourcing services, research is often based on stated preferences, where potential users of a service is presented with a number of hypothetical scenarios describing a number of competing travel services including car and public transport as competing alternatives (see e.g. Table 1 in Geržinič et al. (2021) for an overview). In most studies walking time or distance is included as attributes of one of the other transport modes. It is important to include all relevant modes, including bicycles, due to a high mode share of this transport alternative (Hallberg, Rasmussen and Rich, 2021) To our knowledge, only Yap, Correia, and van Arem (2016), and Geržinič et al. (2021) include bicycle as an alternative. However, only (Yap, Correia and van Arem, 2016) focus on automated rides and they only include bicycle as part of the egress stage. On the other hand, Yan, Levine, and Zhao (2019) and Geržinič et al. (2021) focus at on-demand ride sourcing for the full trip and not as a complement to PT. In most studies walking time or distance is included as attributes of one of the other transport modes.
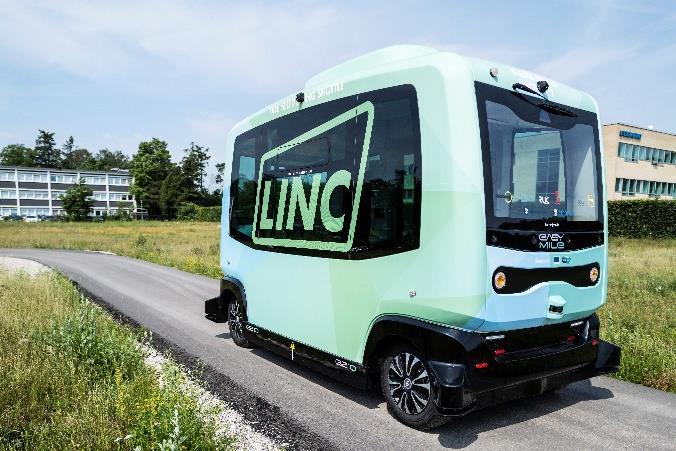
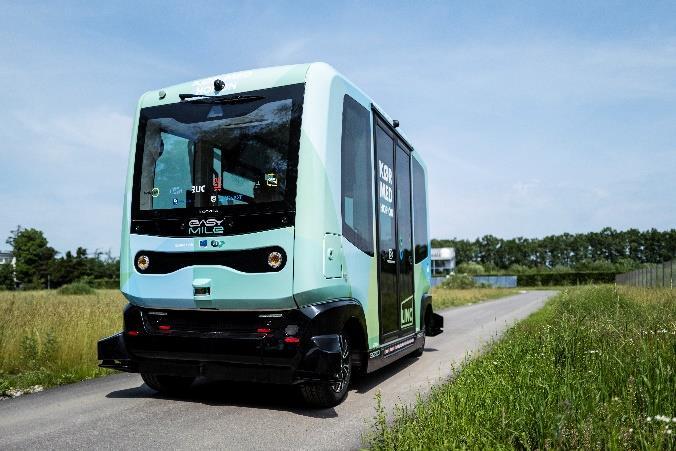
In the current study, a stated preference survey is developed and used to collect data about travellers preferences in a scenario where an automated shuttle service (as seen in Figure 1) is introduced. The shuttle service works as a feeder connection to the main backbone PT system in order to increase the performance and attractiveness of the overall PT system. To test this, we explore an AV shuttle service acting as a feeder line between main PT hubs and a university campus.
In contrast to previous research, this study includes a sample with a specific travel relation to and from the area. Moreover, in the period of the data collection in-campus, real-life tests with AV shuttle buses were carried out. This provide users and survey respondents with a better understanding of this type of service, which would otherwise be entirely hypothetical. While the real-life tests conducted at campus was using fixed routes and fixed stops due to technological limitations, the main feature of the automated shuttle service presented in the stated choice scenario, is that it can take the traveller directly to the destination on campus, which for some employees or students can be quite far.
Based on the collected data, a mixed logit model has been estimated in order to analyse the effect of the presented attributes and this model has been used to simulate the change in mode shares across different possible future scenarios.
2 Case study, experimental design, and data collection
2.1 Testbed: Campus of the Technical University of Denmark
In this project the campus of the Technical University of Denmark (DTU) was selected as a testbed for studying preferences toward AV shuttles as a first/last mile mode of transportation to/from the main feeder PT modes. The DTU campus covers approx. 1 km2 and is located approx. 13 kilometers north of the City Centre of Copenhagen. It holds approx. 6.000 employees and 13.000 students (Technical University of Denmark, 2020) Figure 2 shows an overview of the campus site highlighting existing public transport connections1. Note that there are two main access entries to DTU by public transportation; 1) the train (blue) to Lyngby St. combined with bus or bike to the campus (about 2.5km), or 2) the (red) highway bus lines along the highway east of campus, which involve walking to the final destination on campus.
1 As of 5th november 2021
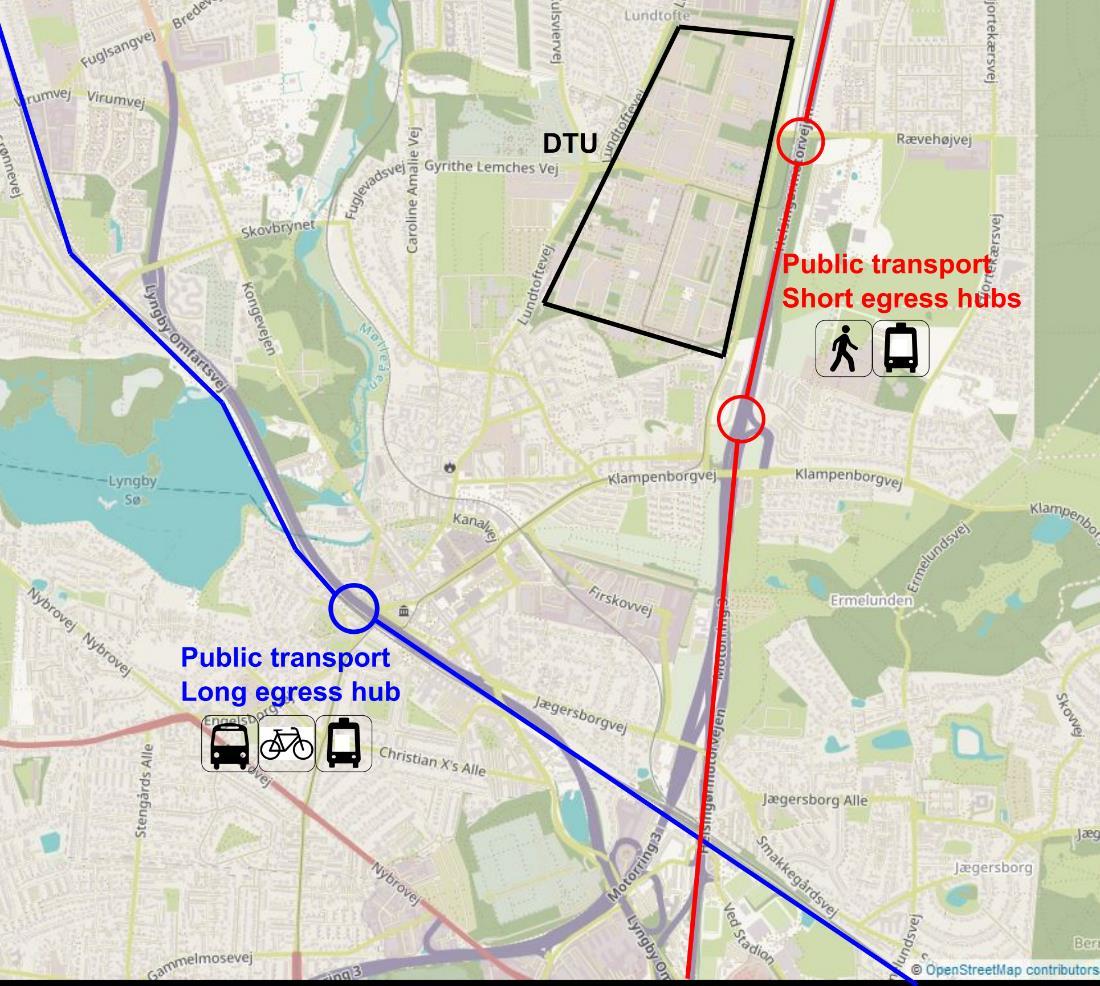
Figure 2: Map of DTU including existing public transport services to the campus.
2.2 Stated choice experiment
In order to assess individuals’ preferences towards AV shuttles we develop a stated choice experiment. For simplicity, we focus on the (one way) morning commute to DTU. Since we are (also) interested in exploring if the introduction of AV shuttles can shift people from car to public transportation, the stated choice experiment was set up to cover the entire commute from home to DTU, and not only the egress part of the PT trip. The stated choice experiment therefore includes non-PT modes as alternative modes for the commuting trip. More specifically, in our design it was possible to commute by car, bike and public transportation as the main modes. For the public transportation alternative, multiple egress modes are available, including walk, bike, bus and AV shuttle. The available egress modes are dependent on how each respondent would normally arrive to DTU by public transport. For individuals who would take the train to Lyngby station (in the remainder of this paper we will refer to this as “long egress”), the following PT egress modes were presented: Regular bus, bike, and AV shuttle. For individuals who would take the bus along the eastern highway (in the remainder of this paper we will refer to this as “short egress”), the following PT egress modes were presented: walk and AV shuttle. We designed two main stated choice experiments; one for the long egress and one for the short egress. For each of these, a version with and without car were developed, depending on whether the respondent indicated that a car was available in their household or not
Mode alternatives in the stated choice experiments
Long egress with car Long egress without car
PT, egress: regular bus (+ walk) X X
PT, egress: bike X X
PT, egress: walk X X
PT, egress: autonomous X X X X Bike X X X X
Table 1 shows an overview of which alternatives are available in the different stated choice experiments. The main difference between the conventional bus and the autonomous bus options (except of course for the driver) is that the conventional bus is assumed to follow a predefined route, stop pattern, and time table, while the autonomous bus operates as a demand responsive shuttle, which drops off travellers at their final destination, thus removing the need to walk from a bus stop to the final destination
Mode alternatives in the stated choice experiments
PT, egress: regular bus (+ walk)
PT, egress: bike
PT, egress: walk
PT, egress: autonomous
Bike
Table 1: Overview of available alternatives in the four designs
In order to customise the specific values presented to the respondents, we pivot the design with respect to their distance from home to work and whether they would normally use train (long egress) or bus (short egress) to DTU (if they would use PT). Travel times are computed based on the distance and a mode specific travel speed, which was assumed to be 5 km/t for walking, while for bike we ask the respondents to declare if they would consider themselves to be slow (~15 km/t), medium (~20 km/t) or a fast (~25 km/t) cyclist. For car and public transport, we analysed the travel speeds in the Danish National Travel Survey to find realistic travel times. Since the travel speed for these two modes in particular depends on the distance (e.g. longer distances are usually travelled on the main roads and highways or using high speed trains), we have carried out regressions for travel speed as a function of the distance, see Figure 3. Based on these travel times, which was customized to each respondent, we then pivoted the attributes in the stated choice experiment using levels corresponding to +25%, +10%, -10%, and -25%. The same was done for travel cost. For access, transferring, and waiting times, we used absolute values ranging between 2-8 minutes and 3-9 minutes. Table 2 presents an overview of the attribute levels used in the final design
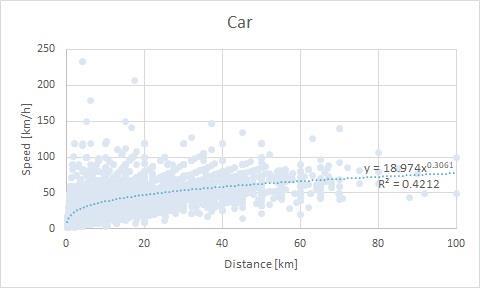
Figure 3: Regression of travel speed as a function of distance.
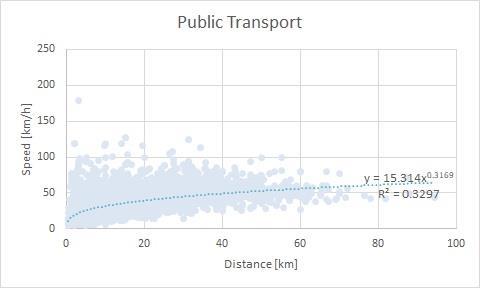
Table 2: Level values
Defining the attributes and levels to represent the alternatives is a rather complex trade-off between realism in attributes, sufficient competition among alternatives and simplicity for the respondents in overcoming the complexity of the stated choice tasks. The final stated choice experiments are presented in Figure 4 for the long egress and in Figure 5 for the short egress, both for the case where there is a car available in the household Note also, that for the AV shuttle egress mode, we include a walking icon, even though the walking time is always zero, in order to specify clearly that this is an advantage of this option.
All the stated choice experiments are designed as an efficient design as this allow us to specify 1) fixed attribute levels across alternatives (e.g. the travel time of the main part of the PT trip is shared for all egress options), and 2) level constraints among alternatives (e.g. for the PT alternatives, the bike/walk alternative cannot be more expensive than the bus alternatives). The designs are generated with 60 choice tasks divided into 10 blocks so that each respondent is presented with a total of 6 choice tasks from one of the four designs (depending on what is applicable to each respondent).
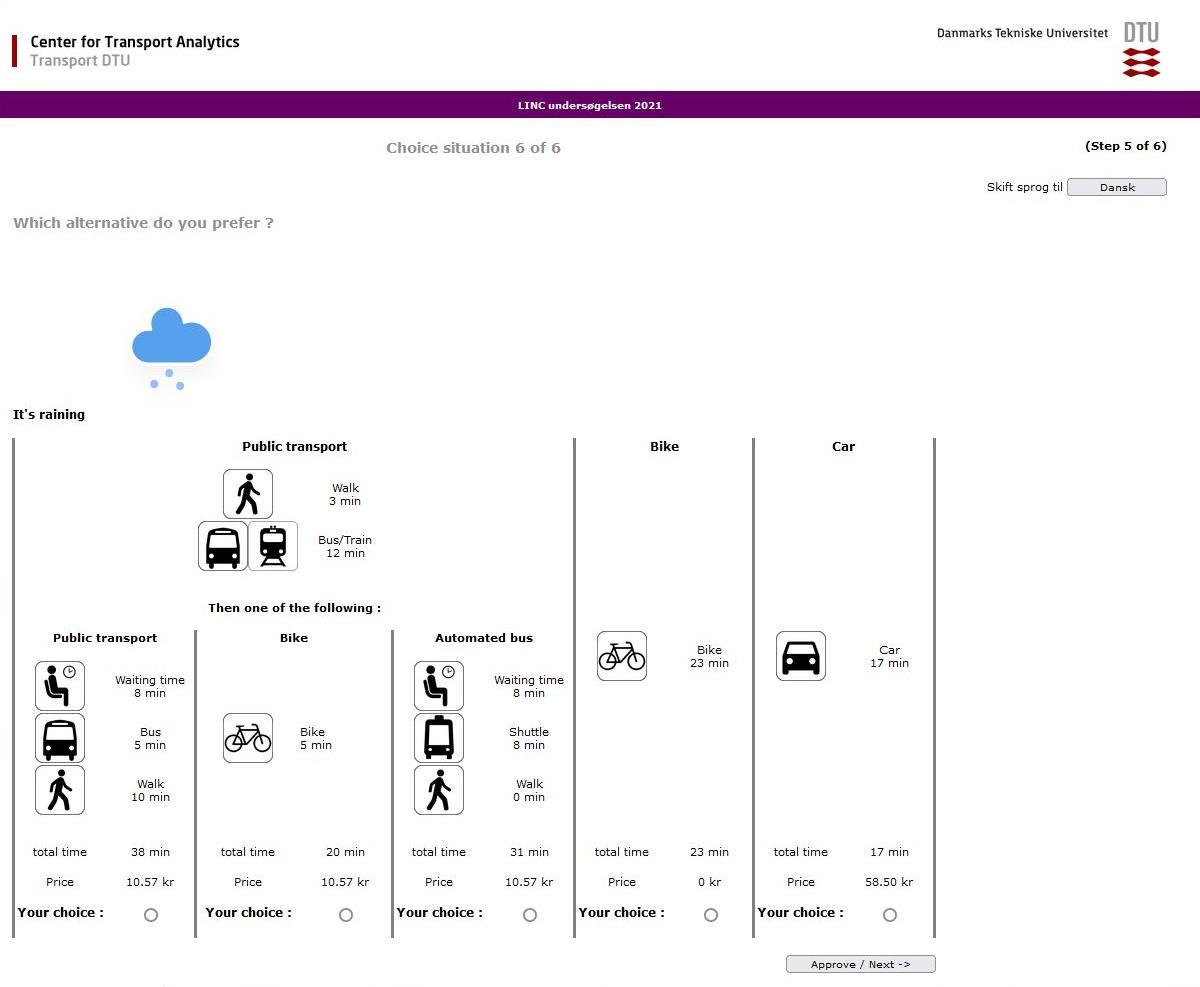
4: Choice task example of the stated choice experiment for long egress (with car)
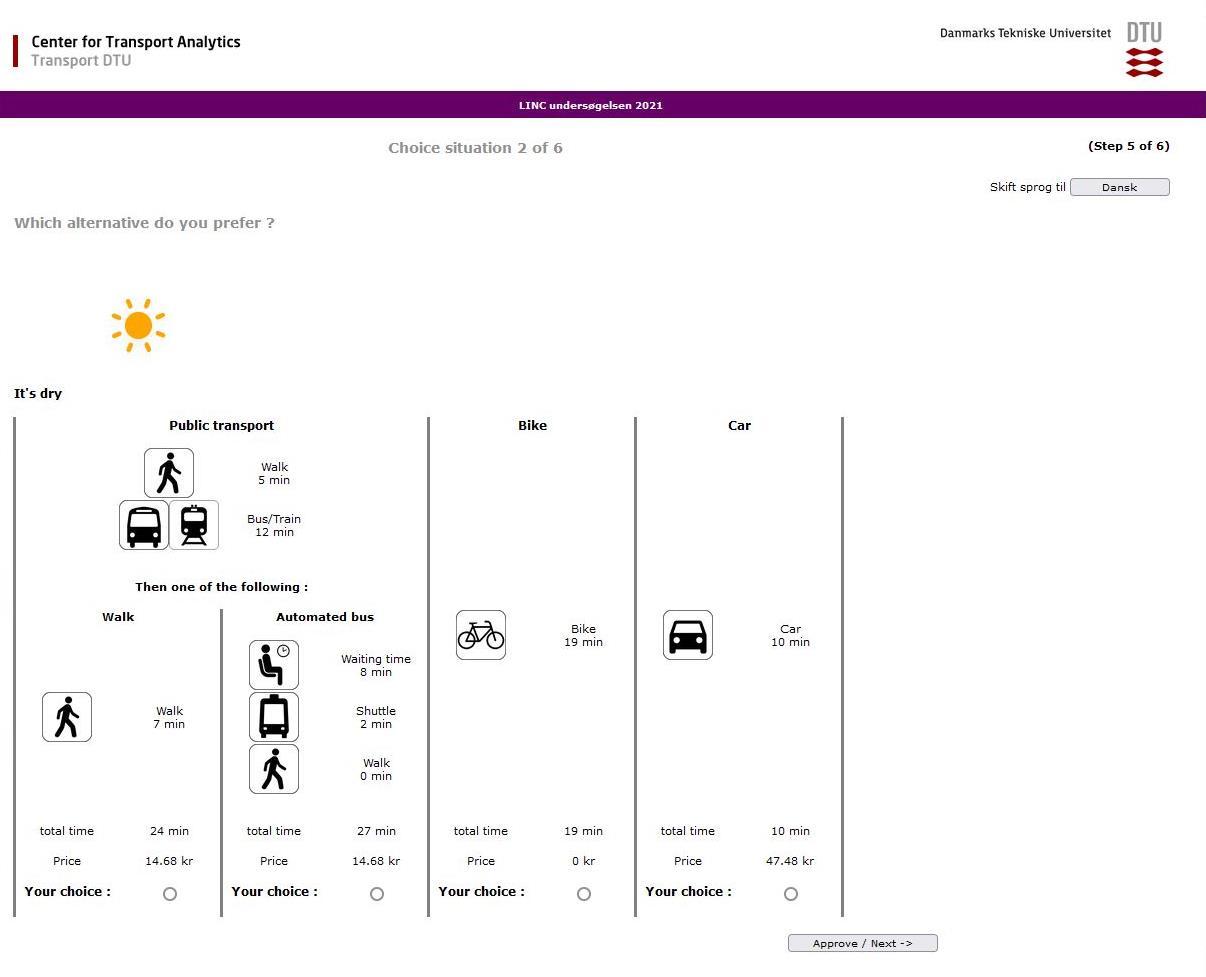
Figure 5: Choice task example of the stated choice experiment for short egress (with car)
2.3 Data collection
An online questionnaire was distributed among employees and students at the technical university of Denmark between April and November 2021. Most responses were obtained from a DTU panel which was built as part of the LINC project. Of 1035 individuals in this panel, 184 responded to the survey. Beside this panel, invitations were sent out to employees through the university intranet and invitations to students were sent through the organisers of several larger courses. In total, 236 completed responses were obtained and an additional 281 incomplete responses, which means that the respondents ended the survey before the end. In case that they completed the choice experiment and indicated the most relevant background information, some of these incomplete responses was still useful. The data was cleaned so that observations were removed if 1) there were no valid response in the choice tasks or 2) the commuting distance was less than 1 km. The final sample contained 1479 observations from 249 respondents.
About half (50.2%) of the sample are students, while the other half are employees Approx. one third (36.9%) of the sample have completed a long further education (5+ years), while another third (33.7%) have completed a medium further education (2-5 years). Figure 6, Figure 7, and Figure 8 and Table 3 presents some further key statistics of the data. We find these numbers to be plausible. Data includes especially data from the youngest age group which consists mostly of students, but for employees it covers most age groups. About 40% of the sample are females, which reflects the overrepresentation of men in both the student and employee group at DTU, where about 18% of faculty are women and 1/3 of students are females (Technical University of Denmark, 2019).
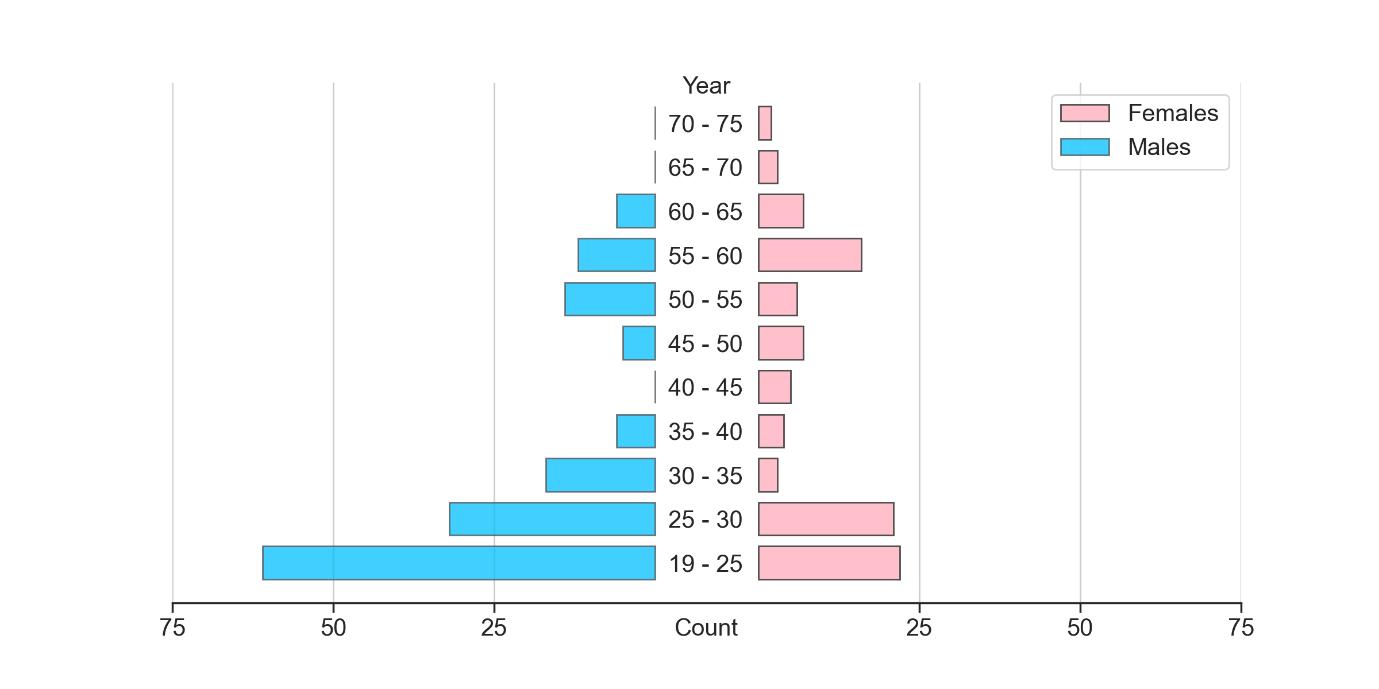
Figure 6: Gender and age (Mean= 35.2, SD= 14.5) distribution.
Figure 7 presents the distribution of commuting distance segmented on individuals using short and long egress for their PT trip to DTU. Overall, there are slightly more people using short egress modes than long egress, but no clear pattern indicate if one of these are particular preferred for specific commuting distances.
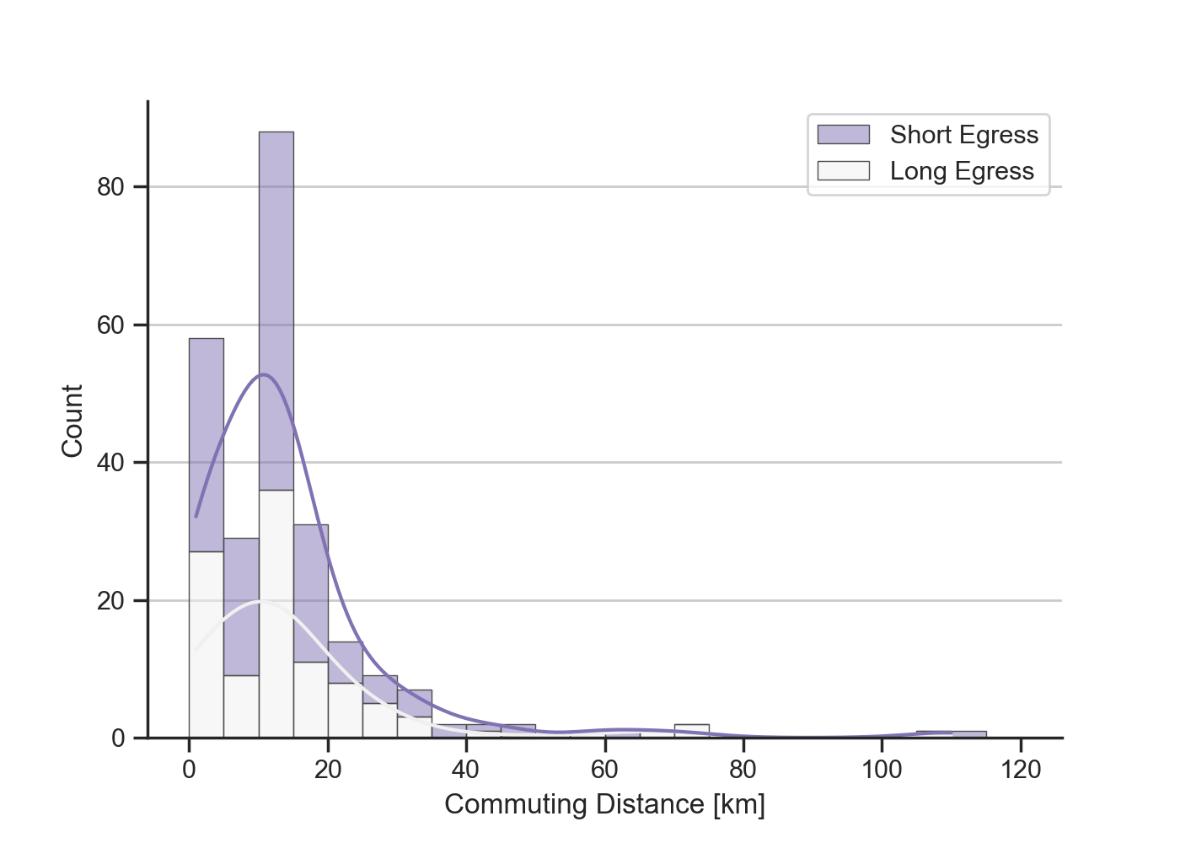

Figure 8: Travel options and characteristics
Table 3: Descriptive statistics of attributes in the stated choice experiments.
3 Method
In the following we describe the modelling framework. The model is estimated using random utility maximization (RUM), see e.g. Train (2003). We specify the utility �� for individual �� and alternative �� in choice task tas:
Where:
- �������� are observed variables that describe attributes of alternative �� for individual and choice task ��
- ���� is a vector of taste parameters that follow a density ��(��) in the population - �������� is the standard i.i.d. extreme value type 1 error term
In order to account for the panel effect from multiple observations from the same individual we define the unconditional probability �� that individual �� chooses a series of alternatives �� ={��1, ,����} over �� choice tasks as:
The integral does not have a closed form, so we use simulation in order to estimate the parameters that maximise the loglikelihood function:
4 Results
The final model specification was obtained by the following procedure. Firstly, an MNL model with parameters for all attributes (i.e., time and cost variables) was estimated in order to obtain good starting values for the mixed logit model. Then, a mixed logit model with random parameters for all alternative specific constants and all time attributes was estimated. Then a rain dummy was interacted with all alternatives. Finally, alternative-specific interaction with gender, dummy for 1 car in household, dummy for 2 or more cars in household, student dummy, young dummy, old dummy and commute distance were included. Then, the model was iteratively reduced, one variable at the time, until the model specification below was obtained.
First we define the utility for the common main part of the PT trip, i.e. the main mode (for simplicity we omit sigmas below). Student was tested with alternative-specific parameters for each PT egress mode, but a Likelihood-Ratio test indicated that there was no significant difference between generic or specific PT parameters.
And then we can defined the utility functions for the alternatives in the choice set:
4.1
Parameter estimates
Models were estimated using the software package PandasBiogeme 3.2.8 (Bierlaire, 2020) The final model contains 40 parameters and was estimated using 10,000 (0,1) normal MLHS draws. Parameter estimates for the final model is presented in Table 4.1.
It is seen that parameters for all attributes have the expected sign, i.e. negative parameters for both time and cost parameters. In the model specification testing, we generally aimed for a ��-value below 0.05, but in some cases, we included interesting and plausible parameters with slightly higher �� values. Based on statistical tests, it was possible to join rain parameters to cover three groups: i) inactive transport that covers car and PT with bus and AV shuttle as egress, ii) PT combined with walk and bike as egress modes (i.e. active egress modes) and iii) finally the bike mode when used for the entire trip (the latter was chosen as the reference in estimation). Compared with bike, there is a higher preference for PT combined with active modes when it is raining. This effect is even higher for modes that does not involve active modes at all as these alternatives allow the traveller to avoid rain (Carrone et al., 2020)
Overall students were found to have a preference for PT compared with all other alternatives while we only found one effect for differences between genders. Interestingly, female travellers have a lower preference for the AV shuttle compared to male travellers, but with a rather low level of confidence The oldest group in the sample (born before 1970) have a preference for bike and a dis-preference for PT in combination with bike compared to car and the non-active PT alternatives. They also seem to prefer PT in combination with walking although with a low level of confidence. Finally, a higher preference for car was found only for those with 2 or more cars in the household and a lower preference for bike was found for longer commuting distances.
Table 4: Parameter estimates and model summary for the final model.
We find the mean value of travel time to be equal to 78 and 90 DKK/h for car and PT respectively. The values are slightly lower than the official Danish VOT, which for commuting is equal to 96 DKK/h (2021-levels) for both car and PT in-vehicle-time. We find the mean value of waiting time to be 96 DKK/h, which is half the value of the official Danish VOT for waiting time. Possible explanation for our finding is that half of the respondents are students, which in general have lower levels of income and thereby lower values of time compared to the general public (Rich and Vandet, 2019). Furthermore, the parameter is estimated jointly for waiting time and initial access time to the PT station2, and while waiting time is normally a factor 2 of IVT (and thereby twice as high WTP), access time is usually lower, and thus will inherently result in a lower WTP in our case. Moreover, a large share of the respondents are regular PT users, and some might even be enthusiastic about the autonomous busses, thus being more willing to access waiting times.
Finally, based on the Cholesky factorisation (i.e. the sigmas), it is possible to calculate the correlation across the included alternatives with respect to the reference alternative (in this case car). As can be
2 This was a design choice in the stated choice experiment. This was done to simplify the stated choice experiment for the respondents and thus allowing us to focus more on the egress part. Furthermore, we do not know how far the respondents live from the station/bus stop and how they would get there (walk, bike, car, other) – both elements that would significantly impact the access time to the initial station/stop.
seen from Table 5, all the PT alternatives are highly correlated, albeit PT-Bike is slightly less correlated with the other PT alternatives. Furthermore, we also note that the Bike alternative have fairly high correlation with all the PT alternatives, and in particular with the PT-Bike alternatives. We believe all these to be intuitive
Table 5: Correlation among alternatives (relative to car)
4.2 Market shares / sensitivity analysis
As a final assessment of how AV shuttles as feeder modes to public transport would impact travel demand, we explore some case studies. More specifically, we are interesting in understanding what would happen if, e.g. the travel speed or frequency of the AV shuttle service is improved. It is important to note that since the study is based on a stated choice experiment we have to be cautious in inferring results Thus, we define a specific scenario and assess sensitivity under the specific statedchoice assumptions.
In order to make the analysis as plausible as possible we have to control and calibrate the model. The predicted market shares are a result of both the estimated parameters and the presented alternatives and attributes (e.g. travel time and cost for the available modes) in the stated choice experiment. Regarding the attributes in the stated choice experiment, we put a lot of emphasis in constructing a stated choice design which was pivoted around the respondents’ actual commuting distance and travel speed, and thus it is reasonable to believe that attribute values are fairly realistic overall We most likely would not be able to obtain more realistic travel time values from other sources (such as Google Maps, etc). Regarding the available modes in the simulation, this was based on the actual route to DTU of the respondents, which was recorded in the survey. The biggest uncertainty lies in the calibration of the model. Since this is stated choice data we cannot trust the market shares produces by the (uncalibrated) model, and since the AV shuttle is a new and not (yet) fully implemented service we cannot calibrate against actual market shares. Instead, it was decided to calibrate the market shares for the main modes (car, bike and PT), which we can observed from e.g. the Danish National Transport Survey (Baescu and Christiansen, 2020). This of course introduces a minor bias as we assume that the current market shares are valid after introducing the AV shuttle as a feeder mode, however we believe this has only limited impact on the analysis overall (which also seems to be supported by the low elasticity in the simulation below).
We further test how changes in AV characteristics impacts the overall market shares. Figure 10 presents relative changes for an improved in travel speed, number of busses (bus frequency), and egress walking distance. We quantify these in the following way:
- Travel speed: simulate a 10% increase and decrease in travel time for the AV shuttle
- Bus frequency: simulate a 10% increase and decrease in waiting time for the AV shuttle
- Egress walk: simulate walking egress times between 0-10 minutes
The market shares are generally inelastic with respect to both travel speed and bus frequency, which suggests that the market is not particular responsive to improvement in the AV shuttle service. As the feeder-mode represents only a small part of the trip mileage this is to be expected. It suggest that even in the situation where feeder transport is made more efficient and comfortable, it still has limited impacts with respect to overall market shares. The AV shuttle will capture travellers that would otherwise have taken a regular bus or biked/walked. However, we do not see a general significant
increase in the PT ridership. Again, this is not surprising as there is not much of a difference between a regular bus and an AV shuttle (provided that preferences for autonomous driving are not different from conventional public transport).
Regarding the walking egress time, we interpret this as an indication that if AV shuttles are introduced the best way is to have them provide a to-door service. Note however, that having a fully to-door service requires a (large) fleet (depending on the area of course) in order to keep in-vehicle travel times at a reasonable level. Having a single AV shuttle providing to-door service to replace a regular bus line will in many cases probably lead to a worse situation, as a to-door service is an inefficient solution if many on-board travellers have to wait for the bus to drive around and drop of passengers at specific location (Jomeh and Clausen, 2021).

5 Conclusion
In this paper we set out to explore the preferences for autonomous shuttle busses, and if these can improve the overall public transport system by acting as a feeder service to and from the main public transport arteries. The hypothesis we put to the test is if significant improvements in first- and last mile transport, through the use of autonomous services that will enable door-to-door transport, can be expected to affect the public transport market share in general The hypothesis is tested in a university environment with many students, a high share of public transport and with notable access-egress distances, which in normal conditions, will require a feeder mode.
To answer this question, a stated choice experiment was developed where questions directed to each respondent was pivoting with respect to their commuting distance. Moreover, to investigate how the entire transport chain was affected, the stated choice experiment covered the entire commuting trip from home to work, and included also car and bike alternatives in addition to the public transportation alternative. For the public transportation alternative, multiple egress modes (AV bus, regular, walk, and bike) were available depending on the egress distance. During the data collection period, three AV shuttle busses were deploy at the southern end of the DTU campus. While the specific service of these busses were different from the hypothetical design, it did introduce users to the physical layout of the busses and AV driving experiences.
Based on random utility maximization a Mixed Logit discrete choice model with more than 40 parameters was estimated. Model results were encouraging and the value of travel time was found to be 78 and 90 DKK/h for car and PT respectively, which correspond closely to the official Danish values when accounting for income differences. Further to this, results indicated that;
- While the introduction AV shuttles might shift some existing PT users to use the service, results suggest that overall market shares will be largely unaffected. The first- and last mile transport only represent a limited part of the trip and effects for the entire trip chain are thereby limited.
- The walking distance from the bus to the final destination is a determining factor and we see a significant substitution from conventional PT transport chains to AV shuttles. This alone may suggest that AV shuttles is fit for demand responsive feeder systems where people are brought to their end destination. However, this also depend on the cost of operating the system and the specific layout and arrival pattern of passengers.
- Weather did impact the demand for shuttles significantly and suggest that demand variations must be expected over the year
With an increasing potential for autonomous driving in the coming years, as legislation and regulation barriers are removed, the future research agenda should involve a continuous effort to better understand the behavioural aspects of such services. In particular, focusing on; i) the trade-off between on-demand services and cost effectiveness, ii) the perception of time, and iii) the pinpointing of where and when to consider autonomous first- and last mile solutions.
References
Aarhaug, J. and Olsen, S. (2018) ‘Implications of ride-sourcing and self-driving vehicles on the need for regulation in unscheduled passenger transport’, Research in Transportation Economics, 69, pp. 573–582. doi: https://doi.org/10.1016/j.retrec.2018.07.026.
Baescu, O. and Christiansen, H. (2020) The Danish National Travel Survey Annual Statistical Report TU0619v2. doi: https://doi.org/10.11581/dtu:00000034.
Becker, H. et al. (2020) ‘Impact of vehicle automation and electric propulsion on production costs for mobility services worldwide’, Transportation Research Part A: Policy and Practice, 138, pp. 105–126. doi: https://doi.org/10.1016/j.tra.2020.04.021.
Beojone, C. V. and Geroliminis, N. (2021) ‘On the inefficiency of ride-sourcing services towards urban congestion’, Transportation Research Part C: Emerging Technologies, 124, p. 102890. doi: https://doi.org/10.1016/j.trc.2020.102890.
Bierlaire, M. (2020) A short introduction to PandasBiogeme
Bischoff, J. et al. (2018) ‘Simulation-based optimization of service areas for pooled ride-hailing operators’, Procedia Computer Science, 130, pp. 816–823. doi: https://doi.org/10.1016/j.procs.2018.04.069.
Carrone, A. P. et al. (2020) ‘Understanding car sharing preferences and mode substitution patterns: A stated preference experiment’, Transport Policy, 98, pp. 139–147. doi: 10.1016/j.tranpol.2020.03.010.
Chakraborty, J. et al. (2021) ‘A review of Ride-Matching strategies for Ridesourcing and other similar services’, Transport Reviews. Routledge, 41(5), pp. 578–599. doi: 10.1080/01441647.2020.1866096.
Erhardt, G. et al. (2021) ‘Do transportation network companies decrease or increase congestion?’, Science Advances. American Association for the Advancement of Science, 5(5), p. eaau2670. doi: 10.1126/sciadv.aau2670.
Geržinič, N. et al. (2021) ‘Potential of on-demand services for urban travel’. Working paper, submitted 2. July 2021. Available at: https://arxiv.org/abs/2107.00882.
Gurumurthy, K. M. and Kockelman, K. M. (2020) ‘Modeling Americans’ autonomous vehicle preferences: A focus on dynamic ride-sharing, privacy & long-distance mode choices’, Technological Forecasting and Social Change, 150, p. 119792. doi: https://doi.org/10.1016/j.techfore.2019.119792.
Hall, J. D., Palsson, C. and Price, J. (2018) ‘Is Uber a substitute or complement for public transit?’, Journal of Urban Economics, 108, pp. 36–50. doi: https://doi.org/10.1016/j.jue.2018.09.003.
Hallberg, M., Rasmussen, T. K. and Rich, J. (2021) ‘Modelling the impact of cycle superhighways and electric bicycles’, Transportation Research Part A: Policy and Practice, 149, pp. 397–418. doi: https://doi.org/10.1016/j.tra.2021.04.015.
Henao, A. and Marshall, W. E. (2019) ‘The impact of ride-hailing on vehicle miles traveled’, Transportation, 46(6), pp. 2173–2194. doi: 10.1007/s11116-018-9923-2.
Jomeh, A. J. and Clausen, S. R. (2021) LINC: Simulation of autonomous shuttles in a public transportation system. Technical University of Denmark.
Kucharski, R. and Cats, O. (2020) ‘Exact matching of attractive shared rides (ExMAS) for system-wide strategic evaluations’, Transportation Research Part B: Methodological, 139, pp. 285–310. doi: https://doi.org/10.1016/j.trb.2020.06.006.
Nelson, E. and Sadowsky, N. (2019) ‘Estimating the Impact of Ride-Hailing App Company Entry on Public Transportation Use in Major US Urban Areas’, The B.E. Journal of Economic Analysis & Policy, 19(1). doi: doi:10.1515/bejeap-2018-0151.
Rich, J. and Vandet, C. A. (2019) ‘Is the value of travel time savings increasing? Analysis throughout a financial crisis’, Transportation Research Part A: Policy and Practice. Pergamon, 124, pp. 145–168. doi: 10.1016/J.TRA.2019.03.012.
SAE International (2021) ‘Taxonomy and Definitions for Terms Related to Driving Automation Systems for On-Road Motor Vehicles’, J3016_2021. Available at: https://www.sae.org/standards/content/j3016_202104/.
Schaller, B. (2021) ‘Can sharing a ride make for less traffic? Evidence from Uber and Lyft and implications for cities’, Transport Policy, 102, pp. 1–10. doi: https://doi.org/10.1016/j.tranpol.2020.12.015.
Stocker, A. and Shaheen, S. (2017) Shared automated vehicles: Review of business models. Paris: Organisation for Economic Co-operation and Development (OECD), International Transport Forum. Available at: http://hdl.handle.net/10419/194044.
Technical University of Denmark (2019) Optag 2019, Bachelor i teknisk videnskab (civilbachelor) og Diplomingeniøruddannelsen
Technical University of Denmark (2020) DTU Annual Report 2020. Kgs. Lyngby, Denmark. Available at: https://issuu.com/dtudk/docs/dtu-aarsrapport-2020.
Yan, X., Levine, J. and Zhao, X. (2019) ‘Integrating ridesourcing services with public transit: An evaluation of traveler responses combining revealed and stated preference data’, Transportation Research Part C: Emerging Technologies, 105, pp. 683–696. doi: https://doi.org/10.1016/j.trc.2018.07.029.
Yap, M. D., Correia, G. and van Arem, B. (2016) ‘Preferences of travellers for using automated vehicles as last mile public transport of multimodal train trips’, Transportation Research Part A: Policy and Practice, 94, pp. 1–16. doi: https://doi.org/10.1016/j.tra.2016.09.003.
