DG STORE Final Report
Final report of the electricity grid and potentials for energy flexibility in Southeastern Denmark and Northern Germany
June - 2023
 Prepared by Prof. Dr. Olav Hohmeyer Cand.polyt. Anders Møller-K.
2 Contents 1. EXECUTIVE SUMMARY – DANISH 3 2. INTRODUCTION..........................................................................................................................4 3. NOTEWORTHY CHANGES SINCE THE ‘STATUS QUO REPORT’ (2020) .....................4 3.1. GERMANY ENERGY SYSTEM OVERVIEW .................................................................................6 3.2. DENMARK ENERGY SYSTEM OVERVIEW 11 3.3. INTERCONNECTIONS AND ELECTRICITY TRADE 12 3.4. THE NEED FOR STORAGE AND DSM 12 3.5. BOTTLENECKS AND DOWNREGULATION..............................................................................14 4. TECHNO-ECONOMIC SIMULATION & SCENARIOS.........................................................15 4.1. MODELLING APPROACH........................................................................................................17 4.2. MODEL STRUCTURE 22 4.3. SCENARIOS 31 4.4. RESULTS 34 5. DG STORE POTENTIALS, BARRIERS & RECOMMENDATIONS 37 5.1. STORAGE SOLUTIONS FOR UTILITIES ....................................................................................37 5.1.1. POTENTIALS...................................................................................................................38 5.1.2. BARRIERS.......................................................................................................................38 5.1.3. POLICY RECOMMENDATIONS 39 5.2. DEMAND SIDE MANAGEMENT SOLUTIONS BY AGGREGATING 40 5.2.1. POTENTIALS 41 5.2.2. BARRIERS 42 5.2.3. POLICY RECOMMENDATIONS .......................................................................................43 5.3. DEMAND SIDE MANAGEMENT SOLUTIONS USING SMART CHARGING ...............................43 5.3.1. POTENTIALS...................................................................................................................44 5.3.2. BARRIERS 45 5.3.3. POLICY RECOMMENDATIONS 45 6. CONCLUSION 47 7. REFERENCES ...........................................................................................................................48
1. EXECUTIVE SUMMARY – DANISH
Læs mere om DG STORE her: www.dg-store.eu
I Danmark og Tyskland og resten af Europa øges andelen af vedvarende energi (VE) i elproduktionen betydeligt disse år set i lyset af den overskyggende energikrise som har medført ekstraordinære høje energipriser rundt om i Europa. En energikrise der har været et vendepunkt og som har skabt et øget fokus på forsyningssikkerhed og præcedens for hurtigere udbygning af den vedvarende energiproduktion i Europa. (IEA, 2022)
Manglende kapacitet på tværs af elnettet
Behovet for en hurtigere udbygning af VE-produktionen medfører dog en forøgelse af den fluktuerende VE-produktion fra vind- og solenergi der tilsvarende ligger pres på den tilgængelige kapacitet på tværs af elnettet. Dette har i de senere år medført behovet for en betydelige nedregulering af energiproduktion i Danmark grundet manglende kapacitet i det nordtyske elnet gennem en specialregulering (Hohmeyer & Palm 2020). På lang sigt er dette en uhensigtsmæssig løsning at danske vindmøller betales for at stå stille og dette kræver derfor nye løsninger til f.eks. at lagre VE-produktionen i de tidspunkter hvor elnettet er mest belastet (Dansk Fjernvarme, 2022).
Nyt marked for balanceydelser i Europa 2023/24
Specialreguleringen vil i 2024 være overgået til et fælleseuropæisk regulerkraftmarked på platformen MARI (Manually Activated Reserves Initiative), hvor alle europæiske lande kan byde ind med balanceydelser der kan hjælpe til at stabilisere det europæiske elnet (Dansk Fjernvarme, 2021). Hertil arbejder de nordiske TSO’er fra Sverige, Norge, Finland og Danmark på en ’New Nordic Activation Market’ platform som i løbet af juni 2023 regnes med at blive igangsat. Dette nordiske energiaktiveringsmarked skal kobles op på den fælleseuropæiske MARI platform som vil introducere nye typer af budgivning for balanceydelser (Bräuner, 2022).
Med nye typer af budgivning for balanceydelser på et fælleseuropæisk regulerkraftmarkedet, giver dette tilsvarende nye forretningsmuligheder inden for fleksibilitetsydelser og lagringsløsninger. Disse nye forretningsmuligheder er op til markedsaktørene at indfri og de vil især have fokus på hvor hurtig og hvor længe, samt hvor stor en ydelse der kan aktiveres på det kommende fælleseuropæiske regulerkraftmarked. (Bräuner, 2022).
Tekno-økonomisk analyse af det danske og tyske energisystem
DG STORE projektet har undersøgt mulighederne for lokale lagrings- og fleksibilitetsløsninger på Lolland (DK) og i Flensburg (DE), her med fokus på at forbedre udnyttelsen af VE-produktionen. Disse regioner er typisk afspejlet af en stor overproduktion af VE som medfører flaskehalse og nedregulering af VE-produktionen bl.a. grundet manglende kapacitet i transmissionsnettet. Den tekno-økonomiske analyse vil derfor give indblik i potentialerne ved lokale lagrings- og fleksibilitetsløsninger når der i
3
Europa arbejdes frem mod et 100% VE energisystem som er baseret på høje andele vind-og solenergi. (Hohmeyer & Palm, 2020)
Hvis du ønsker at læse mere om showcasene i projektet, så besøg projekthjemmesiden www.dgstore.eu.
2. INTRODUCTION
Moving towards a greener future includes relying increasingly on renewable energy. Wind and solar power have great potential for covering the electricity demand, but not necessarily when or where it is needed. In transitioning from traditional thermal power plants to increasing amounts of fluctuating electricity production from wind and solar, it is necessary to stabilize the electricity grid. This means expansion of the electricity grid itself, but also being able to shift consumption to match production.
The project ‘Danish German STorage of Renewable Energy’ or short “DG STORE”, showcases various electricity flexibility and storage solutions to analyze their potential for stabilizing the electricity grid. The showcases located in Denmark and Germany, specifically Lolland in the Zealand Region and Flensburg in the Schleswig-Holstein region, highlights the key challenges facing these regions.
The DG STORE ‘Status Quo Report’ from 2020, highlights some of these barriers the two regions face with the increasing demand for renewable energy production in Europe. This report seeks to analyze further how a future energy system in the regions will develop and how local storage and flexibility solutions can play a key role in solving the increasing bottlenecks in the transmission grid and lessen the need for downregulation through the storage and demand side management potentials
To read more about DG STORE, please visit the project website: www.dg-store.eu
3. NOTEWORTHY CHANGES SINCE THE ‘STATUS QUO REPORT’ (2020)
The DG STORE ‘Status Quo Report’ from 2020, gave an overview of the national energy systems in Germany and Denmark. Here a more detailed focus in Germany was put on the area of SchleswigHolstein and the area of Flensburg where the DG STORE cases on the German side is present In relation to the Danish cases a more detailed focus in Denmark was put on the area of Lolland, located in the southwest of Zealand.
One thing to take note of since the ‘Status Quo Report’ was published in December 2020, were the unprecedented rise in energy prices that ensued in the wake of the COVID-19 pandemic with the increasing energy demand from industries and extreme weather conditions throughout Europe. In the slipstream of an increasing demand for energy globally, Europe also experienced a cold winter during
4
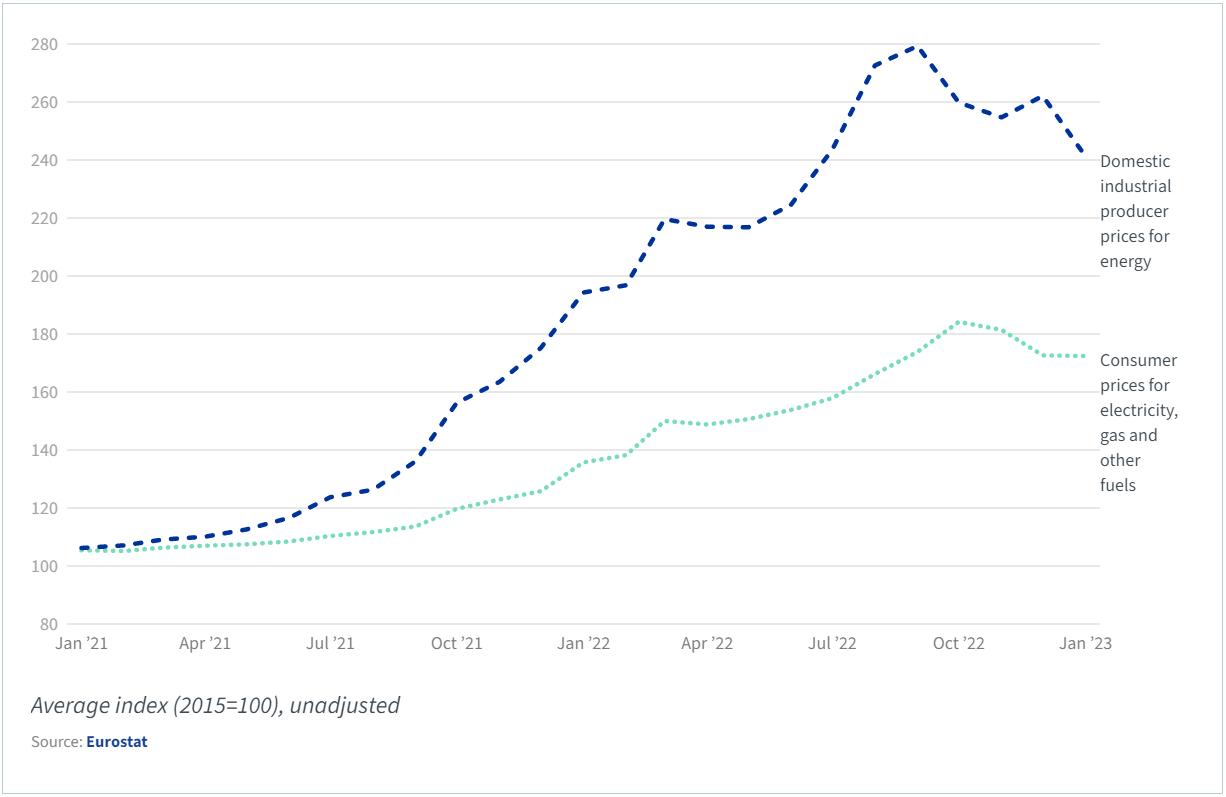
2021/2022 (Greneaa & Rodkjær, 2022) and the Danish TSO Energinet even highlighted that 2021 was an exceptionally bad wind production year with less than 10% wind production compared to a normal wind year in Denmark (Øyen, 2022). Furthermore, an extremely hot summer in 2022 resulted in droughts throughout Europe. These droughts not only resulted in less production from the Norwegian hydroelectric plants due to exhausted water reservoirs, but French Nuclear power production plants also had problems cooling down because of the low water level (Skaaning, 2022). All of this combined with Russia’s war on Ukraine in the start of 2022 which resulted in suspended deliveries of gas to some EU member states ultimately drove the electricity prices in the EU to a record high considering that the energy prices had already more than doubled between December 2020 and 2021 as seen on Figure 1 (European Council, 2023).
This European energy crisis put the energy transition agenda at the topmost political level and highlighted the need for a more robust European energy system that can be more flexible and can utilize storage of intermittent renewable energy This resulted in new and more ambitious goals both in Germany and Denmark concerning the transition to more renewable energy but also the increased focus on a European hydrogen infrastructure to store the intermittent renewable energy.
This chapter highlights some of the noteworthy changes from the overview given in the ‘Status Quo Report’ from 2020 which influences cross border interconnections and national strategies on renewable energy expansion in Germany and Denmark. These changes have also been considered in the following techno-economic analysis.
5
Figure 1 Producer and consumer energy prices (€/MWh) in the EU (European Council, 2023)
3.1. GERMANY ENERGY SYSTEM OVERVIEW
Since the writing of the ‘Status Quo Report’ several substantial changes have occurred in the German climate and energy policy as well as in the local climate and energy plans in the city of Flensburg. These changes were mainly driven by two key factors: first the mounting public pressure to increase the ambitions of the national climate policy and the local climate plan and second the unforeseen shortage of natural gas supplies in Germany and the resulting tremendous price increases for natural gas and for electricity (cf. Figure 1). The greenhouse gas reduction targets, which were at 55% CO2 emission reductions for 2030 for the FRG, were increased to 65% by 2030, 88% by 2040 and to 100% climate neutrality by 2045 (BMWK, 2022, p. 4; BMWK, 2022a, p.8; LpB, 2023). Following this massive shift in climate policy a strong increase in the market diffusion speed of renewable energy sources was legislated. In the Renewable Energy Law of 2023, the ambition was raised massively. By 2030 the target was moved to 600 TWh/a or 80% (see Figure 2 below) of the anticipated electricity consumption (Stiftung Umweltenergierecht, 2022, p.17).
6
Figure 2 Development of planned share of renewable electricity production in Germany by 2030 and the actual development until 2021 (BMWK 2022, p.12)
In the 2021 version of the law the latest year given for the planned electricity production from renewables was 2029 and the target was 376 TWh/a, while the respective target of the new law is at 533 TWh/a for 2029 (Stiftung Umweltenergierecht, 2022, p.17). Thus, the targeted generation has been increased by 42% for 2029 (see Table 1 below).
In the case of the planned renewable energy based generation capacities the new law (EEG 2023) looks out to 2040, while the old law (EEG 2021) only addressed targets until 2030. As in the case of the planned total renewable electricity generation the targets were massively increased from 188 GW (wind plus PV) for 2030 in the old law to 360 GW in the new law (see Table 2 below). What is more, this target increases to 506 GW in 2035.
While the German government increased the ambition for the expansion of renewable electricity generation it started an initiative to speed up the extension and reinforcement of the transmission grid by reducing legal obstacles for the building of new power lines (BMWK, 2022, p.17). Even at the present stage of grid planning, several construction projects are still pending (see Figure 3 below), and these will not even suffice to accommodate the expansion of renewable generation capacities for a fully renewable power supply.
7
Table 2 Development of German renewable electricity generation capacity targets in GW until 2045. (Stiftung Umweltenergierecht, 2022, p.17).
Table 1 Development of German renewable electricity generation targets in TWh/a until 2030. (Stiftung Umweltenergierecht, 2022, p.17).
Although there was the attempt by the opposition party and the Liberal Democratic Party, which is part of the present federal coalition government, to restart a discussion on a prolongation of the operation of the remaining German nuclear power plants, the only change made towards the planned end of all nuclear power generation set for December 2022 was postponed till the end of the winter (April 15th 2023) in order to back up the fragile situation of the power generation system due to the lack of Russian gas for power production (Die Zeit, 2022).
8
Figure 3 German grid expansion plan as of third quarter 2021 (BMWK 2022, p.18)
In the transport sector the government has set the target to 15 million fully electrical passenger cars and a target for building more than 100,000 public charging points per year by 2025 (BMWK, 2022, p.24).
In the housing sector the new targets have been set to 50% climate neutral heat by 2030 and full climate neutrality of all existing buildings by 2045. It is foreseen that 4 to 6 million electrical heat pumps will be installed for heating by 2030 and all new buildings are supposed to meet a heat consumption standard of 40 kWh/m2 per year from 2025 onwards. (BMWK 2022, p.28).
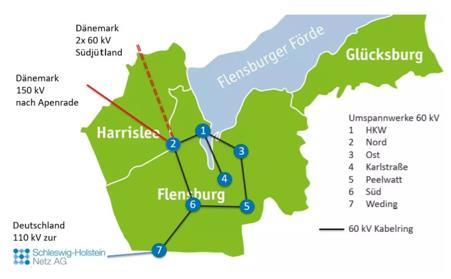
For Flensburg the climate neutrality target for the Stadtwerke was pulled up from 2050 to 2035 by the city council, which is setting the general operating guidelines of Stadtwerke Flensburg, which is owned completely by the city of Flensburg (NDR, 2022). Different from the original concept of climate neutrality to be reached in 2050, which was set in the ‘Integriertes Klimaschutzkonzept Flensburg’ (Hohmeyer et al., 2011, p.48), the new concept builds upon central and decentral heat pumps in the district heating system and a transition from natural gas to hydrogen being used in the CCGT generators in the midterm The original plan from the ‘Klimaschutzkonzept’ to move to the use of wood chips for CHP has been dropped. It is foreseen that the system will rely on additional short term and seasonal heat storage to a substantially larger extent than originally planned, as solid biomass, which could have been stored easily, will not be used at a large scale anymore. Whether there is going to be some auxiliary biomass boiler or not is still a point of discussion (Stadtwerke
The envisaged future energy supply system for Flensburg is sketched in Figure 4
Flensburg, 2023)
9
Figure 4 Envisaged structure of Flensburg’s future energy supply system (Stadtwerke Flensburg 2023)
Besides these changes in the climate targets and the planned generation structure, there has been a need for a decision about the 150 MV high voltage connection to the Danish transmission system, as the Danish TSO has decided to put such power lines underground. As Flensburg would have had to invest into a completely new connection to Appenrade, it was decided to connect by a new 110 MV power line to the German connection point in Weding, which is considerably closer to Flensburg and helps to reduce the investment costs (Stadtwerke Flensburg 2023a). This new connection to the German high voltage grid is planned to be operational in 2025. With this strong new connection to the German grid and a substantial weakening of the connection to the Danish grid it is likely that Stadtwerke Flensburg will operate more in the German and less in the Nordic electricity market in the future.
These new developments and decisions of late 2022 will change the situation for direct and indirect storage technologies in Flensburg as the use of solid biomass will be very limited. If solid biomass is used at all, the competition for storage will be mostly with renewable hydrogen to be used in CCGT or for heat generation, which will foreseeably be rather expensive as compared to solid biomass. Thus, the market situation for all kinds of direct and indirect storage is likely to improve as compared to the original plans. What is more, with the climate neutrality target being moved from 2050 to 2035 these storage technologies will become economically attractive far earlier than under the original plan. At the same time, it will be less likely that the expansion and reinforcement of the German national grid will be able to keep pace with the accelerated expansion of renewable energy generation capacities, namely, the expansion of on- and offshore wind in northern Germany.
10
3.2. DENMARK ENERGY SYSTEM OVERVIEW
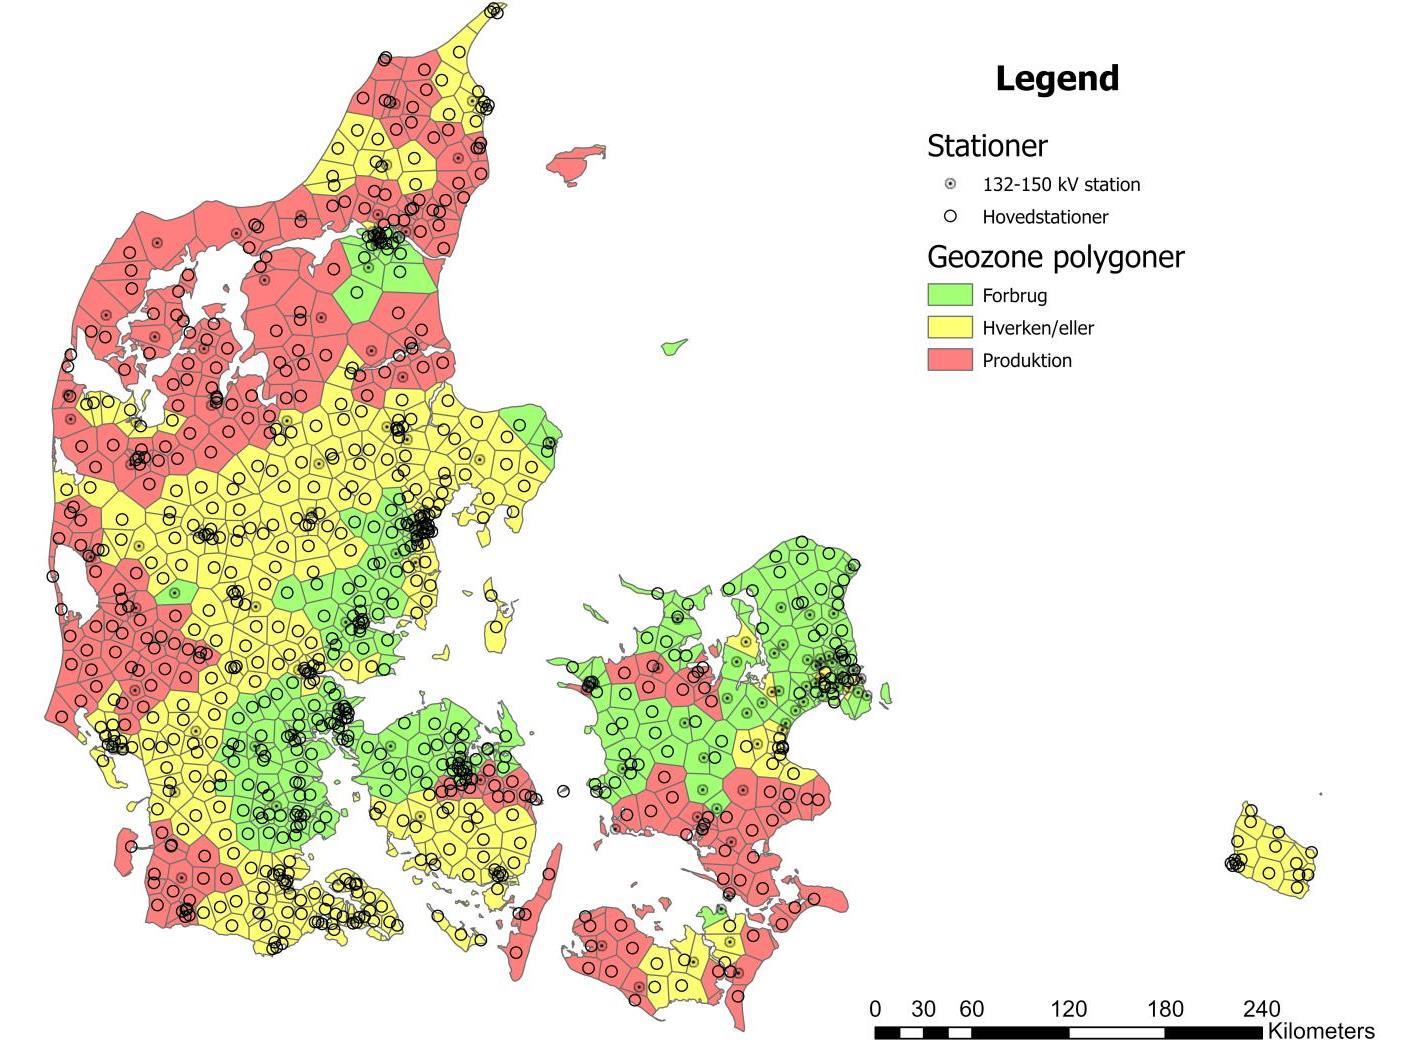
Since the writing of the ‘Status Quo Report’ the Danish Climate Law stated that Denmark must be climate neutral in 2050 as well as reduce greenhouse gas emissions by 70 % from 1990 to 2030. In the foundation for the new Danish government elected in December 2022, a new and more ambitious goal was set to be climate neutral in 2045 as opposed to 2050. However, these more ambitious goals of also reducing CO2 emissions by 110% in 2050 compared to 1990 have not been put into the Danish Climate Law yet (Ritzau, 2022). A noteworthy change in the Danish energy system is the geographically differentiated tariffs that will help position new renewable solar and wind production sites into areas with enough capacity and high consumption from industrial purposes e.g. Thus, a larger focus on the local capacities concerning production of renewable energy as well as consumption from 2023 and onwards. (Energistyrelsen, 2021)
These geographically differentiated tariffs adhere to the specific geozones as seen on Figure 5, which gives an overview of the congestion in the Danish electricity grid. The green areas are defined by an area with a large electricty consumption, thus there will be a larger discount if connecting a new solar or wind park in such a geozone. The green zones are however also defined by being densly populated zones which gives RE-developers NIMBY problems. The yellow zones could be considered a goldilocks
11
Figure 5 Shows the current geozone map for Denmark for the standard connection fee of electricity production units. (Green Power Denmark, 2023)
zones where there is both enough capacity in the electricity grid to connect a solar or wind park and is at the same time not as densly populated. Lastly, the red zones are characterised by already having large shares of RE in the electrity grid, thus resulting in very high costs in order to connect more RE in these geozones. However, these red geozones have historically been the go-to areas for RE-developers which might now be less incentivized in placing new RE-production here.
The costs of connecting new solar or wind parks to the electricity grid in Denmark from 2023 onwards is now placed on the RE-developers as opposed to the consumers through the discontinued PSO-tariff With these new tariff/fee structures for connecting more RE to the electricity grid in Denmark, it is expected that many new RE projects will be set on hold in 2023 and onwards due to less advantagous business cases. (Altinget, 2022)
3.3. INTERCONNECTIONS AND ELECTRICITY TRADE
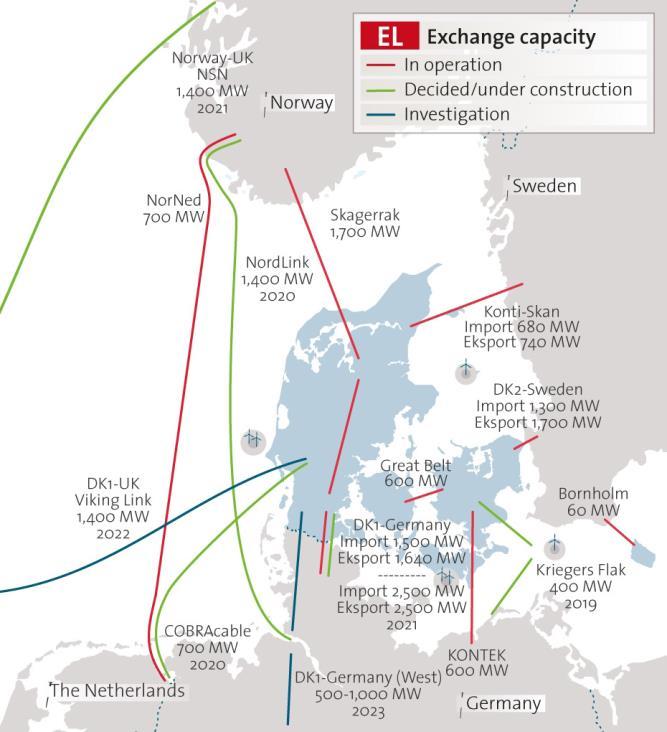
Some noteworthy changes in the interconnections between Denmark and Germany compared to the ‘STATUS QUO REPORT’ from 2020 is as follows:
The DK1-DE connection will not be increased to 3.500 MW until 2025 as opposed to previously stated 2024 as seen on Figure 6. Here the 220 kV connection will be increased to a 400 kV connection.
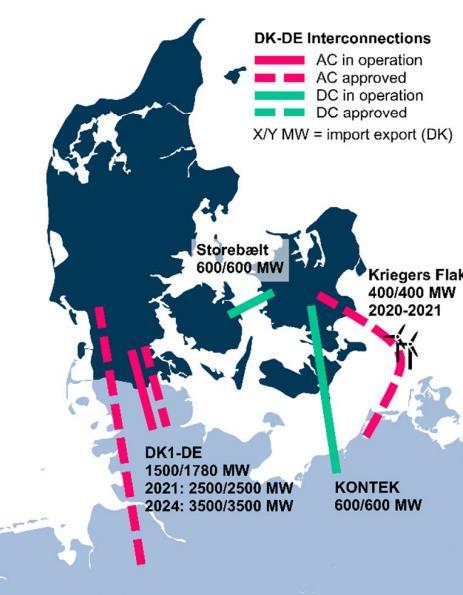
The Krieger’s Flak connection to Denmark is 600 MW as opposed to 400 MW, however the connection to Germany is still 400 MW.
With the coming energy island at Bornholm this offshore wind park will be connected to Zealand (DK2) with a 1200 MW connection. Furthermore, a 2.000 MW connection to Germany will be established from this energy park at Bornholm in primo 2029.
As with the Krieger’s Flak connection, the connections from the energy island at Bornholm will be limited by the fluctuating RE-production but can otherwise also be used as an interconnection for electricity trading between Germany and Denmark. (Danish Energy Agency, 2022)
3.4. THE NEED FOR STORAGE AND DSM
As highlighted in the ‘Status Quo Report’ there is discrepancies between the fluctuating electricity production and the consumption which must be solved for a 100% renewable energy system (RES) to function properly and minimize bottlenecks and downregulation. This time-discrepancy between
12
Figure 6 Shows the plans for electrical transmission connections between Denmark and Germany in 2020. (Hohmeyer & Palm, 2020)
production and consumption therefore creates a long-term demand for storage solutions and demand side management (DSM).
A noteworthy change since 2020 is the increasing plans in both Germany and Denmark in developing Power-to-X solutions that produce green hydrogen from the excess RE production moving towards 2030. In essence the green hydrogen can then be stored temporarily in a hydrogen infrastructure which can be used directly in hard-to-abate sectors or be converted into other e-fuels.
Denmark is currently developing ‘energy islands’ which are large offshore wind parks that will produce large amounts of RE for Denmark and nearby countries. Instead of downregulating this RE-production due to bottlenecks a Power-to-X production facility will be connected instead. This introduces a flexible green hydrogen production during times of excessive RE production. The Danish Energy Agency’s analysis prerequisites ‘AF20’ from 2020 showed that they only expected a Power-to-X capacity of 1 GW by 2030. These analysis prerequisites help the Danish TSO (Energinet) in planning for the development of the transmission network based on the development of the electricity and gas consumption in Denmark. The newest analysis prerequisites ‘AF22’ shows a significant expansion of the Power-to-X capacity which is expected to be 6,9 GW by 2030. This significant expansion is based among other things on the announced projects in the pipeline towards 2030. (Ritzau, 2023)
Germany announced their National Hydrogen Strategy in 2020 expecting 5 GW in 2030 and an additional expansion of 5 GW Power-to-X capacity by 2040 (BMWi, 2020). In 2022 Germany updated their National Hydrogen Strategy targets now expecting a total of 10 GW Power-to-X production capacities by 2030 (BMWK, 2022, p.20)
This disruptive technology of Power-to-X will significantly change the market for storage and DSM solutions at a national level in the future as it can help stabilize the energy system through storage of e-fuels as countries work towards a 100% RES with more fluctuating RE-production from wind and solar. A key element to consider here is the conversion efficiency of the Power-to-X technology, whereas the first step of the e-fuel production is the hydrogen electrolysis which currently have a conversion efficiency of 65-70% (ESA, n.d.) or higher (82-85%) (Danish Energy Agency, n.d.) if excess heat is recovered for use in district heating However, further conversion of the hydrogen to other efuels will imply further losses thus there still a need for local storage and DSM solutions that is more efficient as opposed to the expected losses that a Power-to-X conversion implies compared to direct electrification.
13
3.5. BOTTLENECKS AND DOWNREGULATION
As both Germany and Denmark are significantly increasing their RE-production there is an increasing need for storage and flexible consumption to solve increasing bottlenecks in the transmission grid. However, a temporary solution to these bottlenecks has been to downregulate the electricity production in Denmark. The current countertrade model ‘special regulation’ between Germany and Denmark is also changing in 2023/2024.
DOWNREGULATION IN DK ON TENNET'S REQUEST [GWH]
Reduced/stopped production from thermal plants Power on immersion heaters Power down wind tubines Categories combined (*Less detailed from 2022 onwards)
As seen on Figure 7, the downregulation in Denmark on TenneT’s request, resulted in downregulation of up to 3.048 GWh in 2020 and 3.424 GWh in 2021. The use of ‘special regulation’ in 2022 were less than previous years but still shows a problem with bottlenecks in the German energy system. In recent years a discussion about whether the ‘special regulation’, between Germany and Denmark, complies with the EU competition rules and the EU rules of the free movement of goods have resulted in the Danish TSO building a new countertrade model that will comply with these rules. (Forsyningstilsynet, 2022).
The Danish TSO, Energinet, have put forward two deadlines for ending the current countertrade model. The first deadline will be moving to the intra-day countertrade model “New Nordic Activation Market’ in 2023. This collaboration between the TSO’s in Sweden, Norway, Finland, and Denmark will open for new types of bidding on balancing services and in preparation for the use of the MARIplatform (Manually Activated Reserves Initiative) in 2024. This new countertrade model could also open for new business opportunities for actors working with balancing services or storage solutions, however this is defined by how quick, how long and how large of a capacity that your balancing service can provide on a common European regulating power market in 2023/2024. (Bräuner, 2022)
14
0 500 1000 1500 2000 2500 3000 3500 2022 2021 2020 2019 2018 2017 2016
Figure 7 Special regulation by Danish actors 2016-2022 on TenneT's request (Energinet, 2023)
Energinet advocates that it will no longer be possible to use the ‘special regulation’ unless a modified IT-solution is implemented in 2023. The second deadline is the implementation of a common European regulating power market in 2024 using the MARI-platform. (Forsyningstilsynet,
2022).
Thus, the ‘special regulation’ will be moved from the current balancing market to the intra-day markets. Here all European actors can provide their down-regulating services, but it will only be actors from Denmark, Sweden, Norway, and Finland as the down-regulating services must be done north of the bottleneck in Germany. This could provide a more competitive market for balancing services and storage solutions that could push for a wider integration of these services in Europe. (Energiwatch,
2021)
4. TECHNO-ECONOMIC SIMULATION & SCENARIOS
In order to understand the future role of the different local direct electrical storage options like car batteries or indirect storage options through heat or cold storage for the time shift of heat production from electricity (like heat pumps with hot water storage or the time shift of freezer operation) it is necessary to understand the interaction between the local options and the operation of the overall electricity system at the national or even EU level, which will be mainly driven by weather patterns and the national energy demand.
As these interactions are highly complex and varying in short time intervals it is necessary to use computer simulation models for the calculation of the interactions between the different system levels. Such a computer simulation model has been built based on the open software energy system modelling platform OEMOF (Open Energy Modelling Framework). Figure 8 shows the interactions of the different system levels from the local level in Flensburg or Lolland through the national levels in Denmark and Germany up to the EU level, where a constant interchange of electricity takes place.
15
TheInteractionBetweenSystem AnalysisandthePracticalCases
EnergysystemsimulationattheEUlevel
Energysystemsimulationatthenationallevel(DandDK)
Energysystemsimulationatthecontrolarealevel (Tennet,DK1,DK2)
Energysystemsimulationatthelocallevel (Flensburg,Lolland)
Freezer
ElectricalHeatPump
ElectricalBoiler
PracticalcasesinDG-StORElikeE-vehicles
For the project a number of questions were to be answered by the energy system simulation:
• Which type of storage will be needed?
• How much storage will be needed?
• How often will the storage be needed?
• When will it be needed (at which level of renewable electricity generation from wind and PV)?
• What will be the market prices paid for such storage at different points of system development in the future?
At the same time the case studies were supposed to give answers to a number of questions relevant for the future operation of the energy system:
• Which types of direct or indirect storage will be available locally in the future?
• When will these types of storage become available?
• How much storage can be supplied by the different options?
• For how long will each type of direct or indirect storage supply its service, once called upon?
• What will it cost to make the different types of storage available locally?
16
16
T e c h n oe c o n o m i c s i m u l a t i o n ( h o u r l y o r e v e r y 1 5 m i n u t e s ) T e c h n oe c o n o m i c s i m u l a t i o n T e c h n oe c o n o m i c s i m u l a t i o n
Refrigeratorand
Techno-economicsimulationandelectricalsimulation
Figure 8 Interactions between the different levels of the electricity system (Hohmeyer, 2021, slide 16)
PracticalCases Techno-economicsystemsimulation
Energysystemsimulation(Local,regional,nationalandEUlevel)
Techno-economicsimulation(hourlyorevery15minutes)
Informationfromthesimulation: Informationfromthepracticalcases:
- Whichtypeofstorage?
- Howmuch?
- Howoften?
- Howlong?
- When?
- Marketpriceforstorage
- Availabilityofeachtypeofstorage
- Howmuch?
- When?
- Howlong?
- Costforeachtypeofstorage
PracticalcasesinDG-StORElikeE-vehicles
Figure 9 shows the interaction of the energy system simulation performed in Work Package 3.2 of the DG STORE project, and the practical cases of direct and indirect storage. It was the aim of the project to derive some first answers to these questions for the region of Lolland and Flensburg.
4.1. MODELLING APPROACH
In the following a brief description of the techno-economic modelling approach will be given in order to give a background for the description of the model structure, the scenarios analysed, and the modelling results derived.
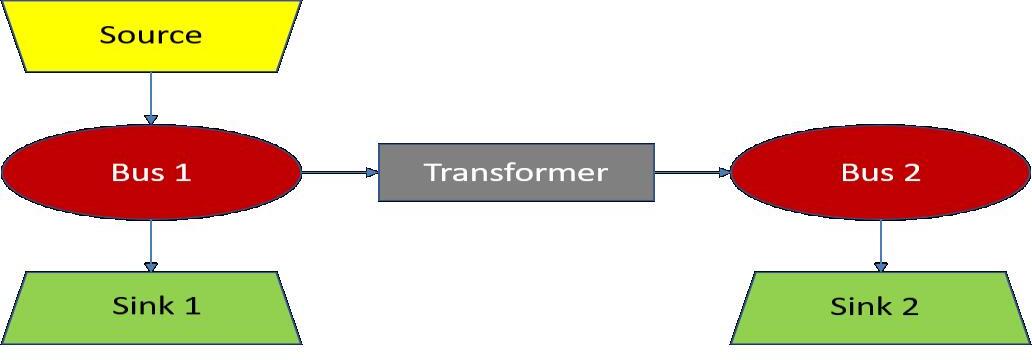
According to the OEMOF approach an energy system can be designed on the basis of four elements:
• sources (like wind or solar energy)
• busses connecting all other parts of the energy system (like power lines, gas pipelines or heat pipelines)
• transformers (all processes converting one form of energy into another, like power plants) and
• sinks (all end uses of energy like household energy consumption)
Figure 10 shows an extremely simple case of a basic energy model using these four components.
17
17
ElectricalBoiler,E-Vehicles,BusDepot…
Figure 9 Questions to be answered by the techno-economic system simulation and by the local case studies (Hohmeyer 2021, slide 17)
.3 Using Oemof to Model Energy Systems
e are three ways to
1. The energy sy cessary Compo and Buses;
2. The basic energy of the aforemen graph logic; and
3. Custom comp eating from sc
use cases can be maximum flex of provides existing addition, it enabl bination and adap research objec of libraries can be The current O ies are network, an solve optim ems like LP and MIL an be visualized plotting library Feedinlib and demandlib can be installed additionally to calculate feeding time oad profiles. A Source has one output, a Sink has one input, and a Transformer can have mu uts and outputs For example, a CHP plant can get gas from the Gas Bus and provide electrici demand via two different Buses. Transformers can also be used to model transmission lines ergy system.
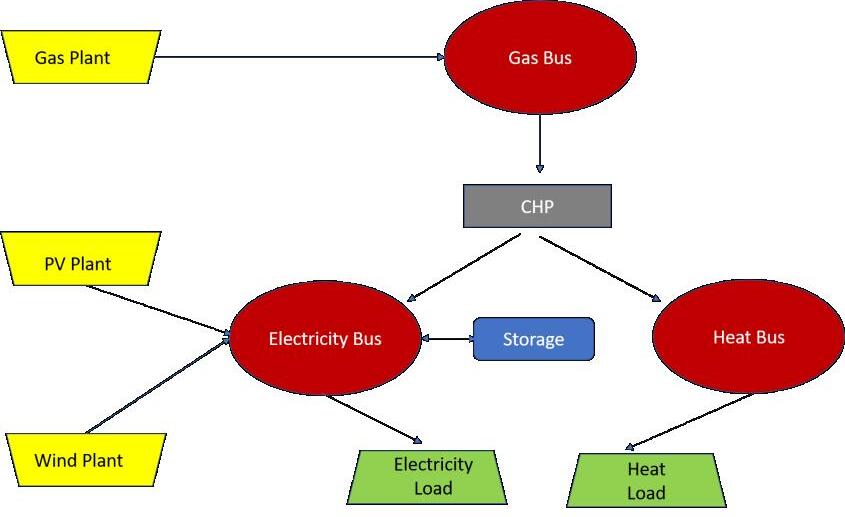
If these basic elements are attributed to some real energy system components a simple system taking into account electricity, gas and heat can look like the system depicted in Figure 11. Thus, every energy system model build on the basis of OEMOF will use these elements to describe the system.
Many projects have used Oemof to investigate various energy system research questions. For exam renpass simulates power supply in Germany and Europe with high temporal and regional resolut reegishp models local heat and power systems, and openMod.sh couples the electricity, heat, and sectors of Schleswig-Holstein [134–136]. These applications validate Oemof's usability to investiga diverse research questions of large and complex energy systems Figure 2.7 shows an Oemof applicat adapted from Hilpert et al. [120].
eate an Oemof-based model, an empty energy system object is constructed, which contains the sustains information. Different scenario provision and node-handling capabilities are also provi step. The next step involves the population of the energy system Nodes and Flows. After th del is optimized using a solver. The final results are then processed using the output library in the The usage can be separate or within one single model. Thus, a developer of Oemof can easily tween economic dispatch, unit commitment, and investment modes by making minor changes depe the application developed. Figure 2.6 shows a more detailed example of an Oemof-based en tem where PV, Wind and a Gas plant are used as Sources, a CHP is used representing a Transform
18
Figure 2 5: Oemof Components Adapted from Oemof Documentation [133]
torage Com t i ted to the El tri ity B d el tri ity d h t l ds
Figure 10 Basic structure of an energy model build on the basis of OEMOF (Maruf, 2019, p.19)
Figure 11 Simple energy model taking into account electricity, gas and heat. (Maruf, 2019, p.20) Figure 2.6: Example of Oemof-based Renewable Energy System
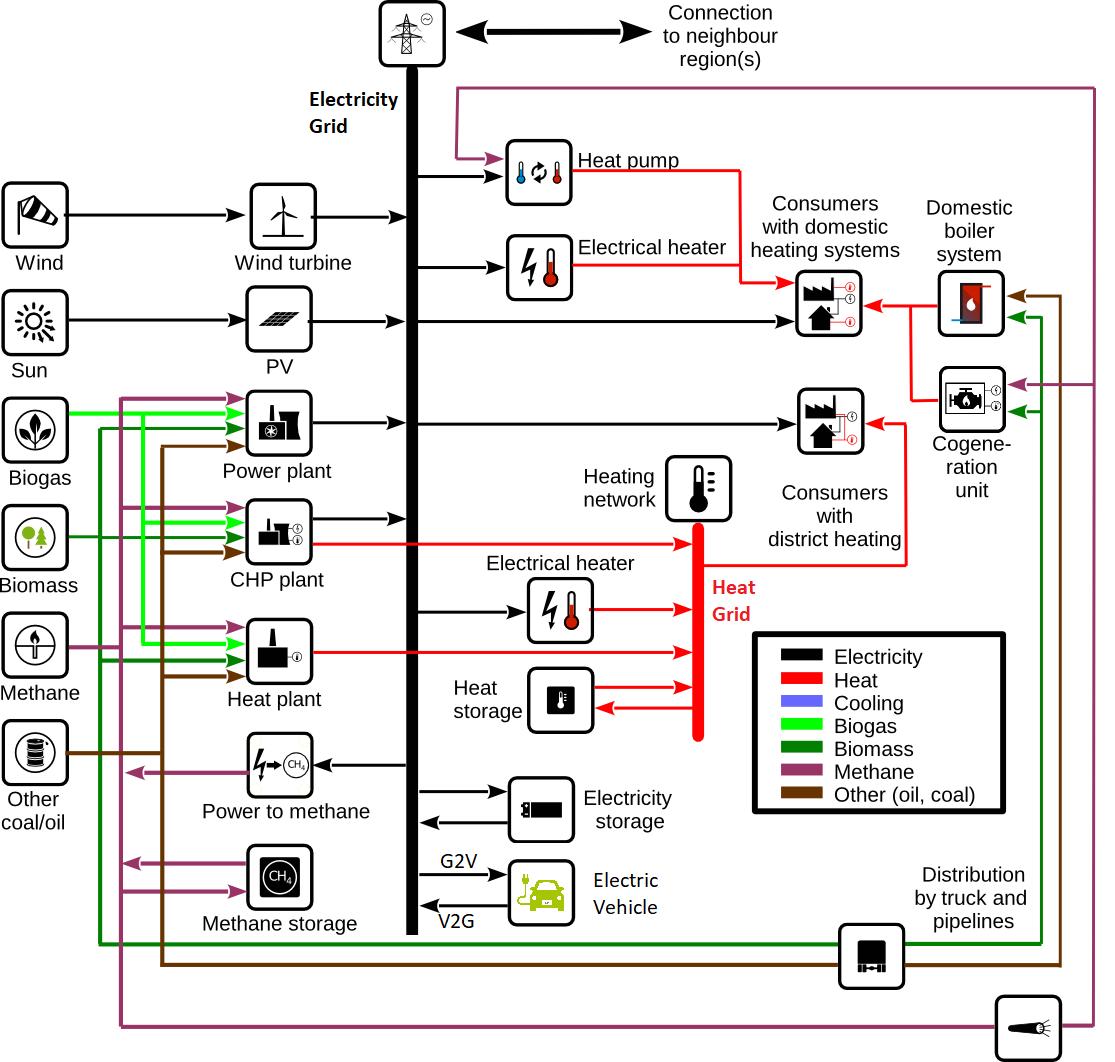
A complex energy system including different energy sources, conversion processes and end uses may look like the system depicted in Figure 12.
Many projects have used Oemof to investigate various energy system research questions. For example, renpass simulates power supply in Germany and Europe with high temporal and regional resolution, reegishp models local heat and power systems, and openMod.sh couples the electricity, heat, and gas sectors of Schleswig-Holstein [134–136]. These applications validate Oemof's usability to investigate diverse research questions of large and complex energy systems Figure 2.7 shows an Oemof application adapted from Hilpert et al. [120].
19
24
Figure 2 6: Example of Oemof-based Renewable Energy System
Figure 2 7: Example of Oemof-based sector-coupled energy system. Adapted from [120]
Figure 1210 Complex energy model taking into account electricity, methane (natural gas), heat and e-vehicles .(Maruf, 2019, p.21)
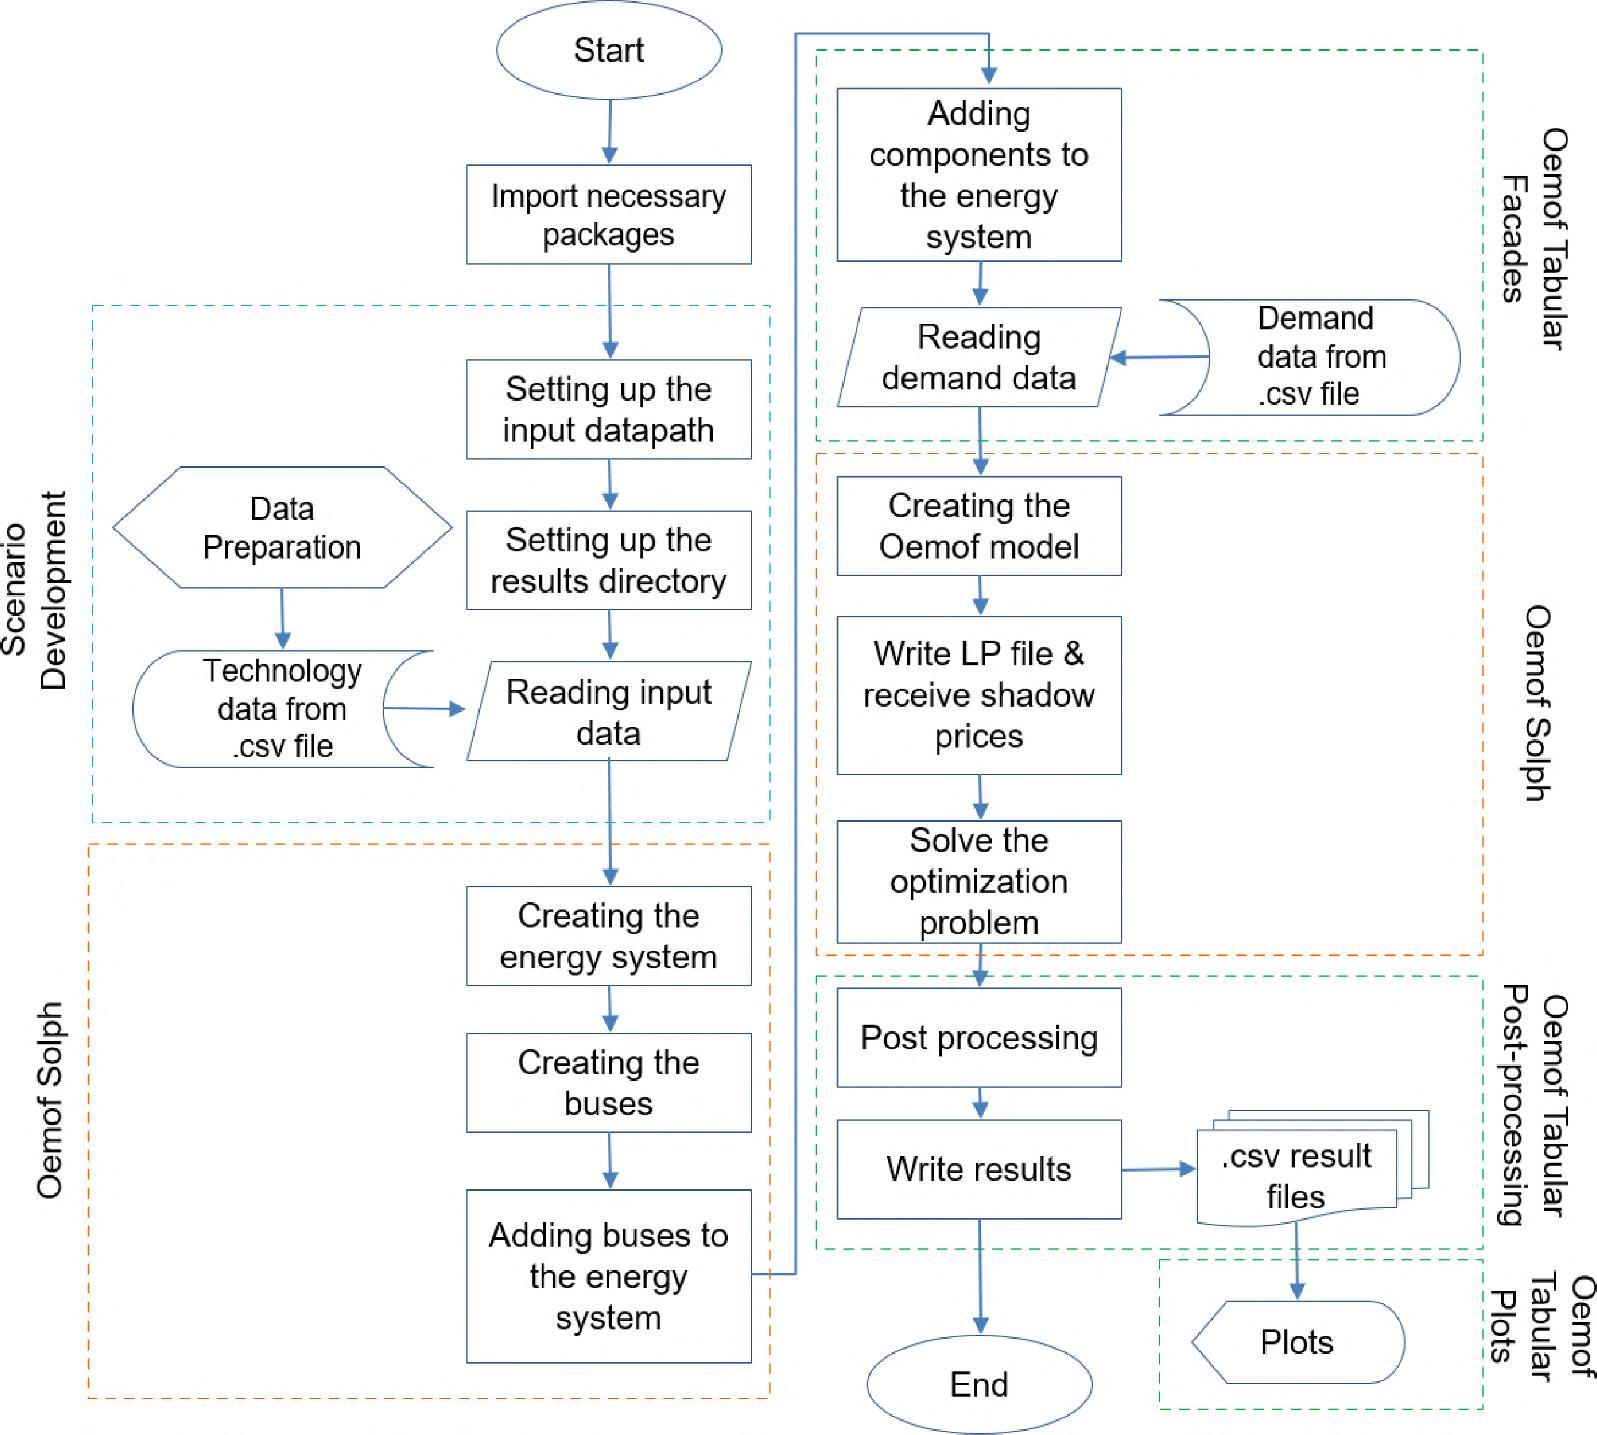
A typical model development process and application using the OEMOF functionality is depicted in Figure 13.
The energy system is mainly driven by the supply of intermittent renewable electricity from wind and solar energy, while the demand is driven by the demand for electricity from the different sectors including e-mobility and the demand for heat. All controllable generation processes like power plants based on solid biomass, biogas or other storable fuels as well as all storage options need to be used in a way that the remaining gap (positive residual load) between the intermittent renewable energy sources and the electricity and heat demand is covered in every second of the year and that storage is used to absorb most of the occurring overproduction of electricity (negative residual load).
20
Figure 13 Typical model development process and application using the OEMOF functionality. (Maruf, 2021a, p.5)
1782
1783
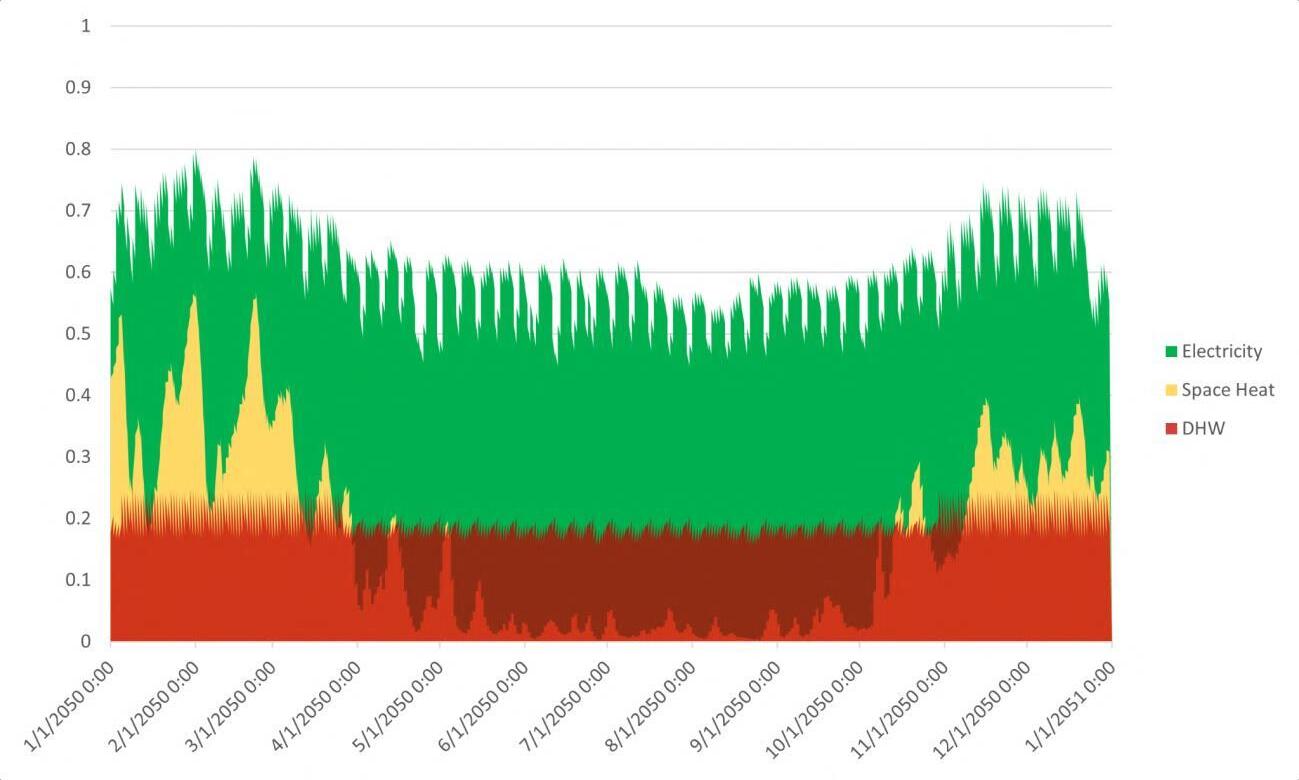
Figure 5.3 shows the normalized demand profiles of SH in 2050. The total electricity demand for SH in 1784 2050, based on the representative year, is 18.6 TWhel Total space heat demand is 18 6 TWhth, and the 1785 DHW demand is 4 TWhth The amount of available biomass is calculated from the Hotmaps project [256]. 1786
The study assumes that the existing biomass and biogas power plants are converted to CHP plants by 1787 2050 CHP’s electrical and thermal efficiencies are assumed to be 45%, and the condensing efficiency is 1788 assumed to be 50%. The COP of the ASHP and GSHP are assumed to be 2.3 and 3.9, respectively [257]. 1789
1782
1783
1784
63
Figure 5.3 shows the normalized demand profiles of SH in 2050.
2050, based on the representative year, is 18.6 TWhel. Total space 1785
DHW demand is 4 TWhth The amount of available biomass is calculat 1786
21
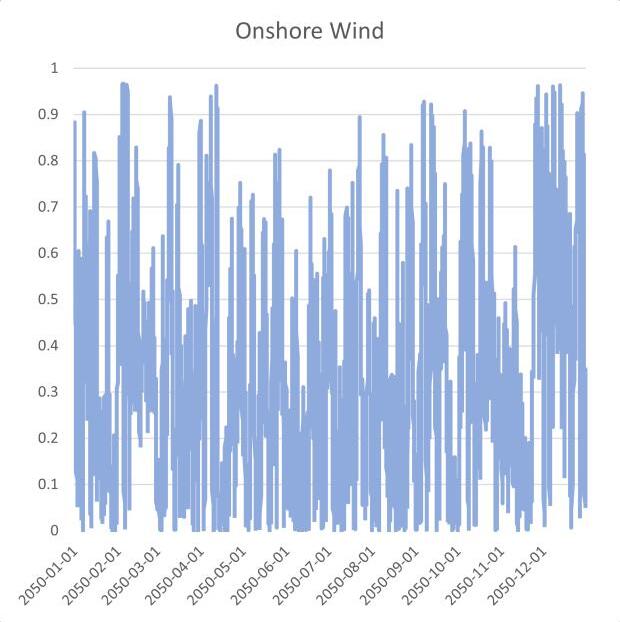
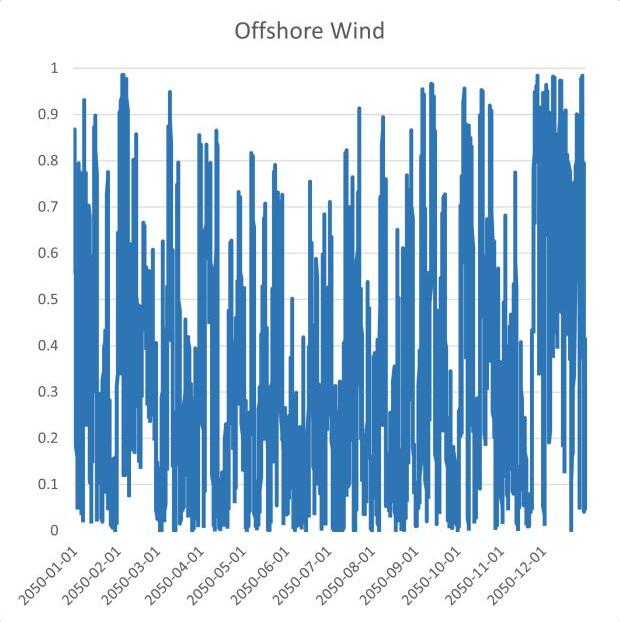
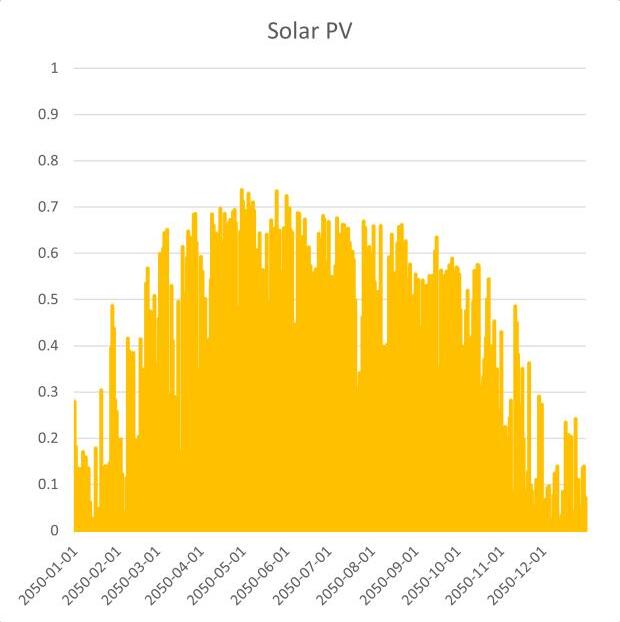
Figure 14 shows the typical electricity production from offshore and onshore wind in SchleswigHolstein, while Figure 15 depicts a typical production from solar PV generation in northern Germany.
Figure 14 Typical hourly generation from wind energy in Schleswig-Holstein across the year. (Maruf, 2021, p.11)
Figure 15 Typical hourly generation from solar PV in Schleswig-Holstein across the year. (Maruf, 2021, p.11)
(a) (c)
Figure 5 2: Normalized input profiles of volatile generators of OSeEM-SN model, (a
photovoltaics (PV), and (d) hydro run-of-the-river (ROR)
Th
(a) (b) (c) (d)
Figure 5 2: Normalized input profiles of volatile generators of OSeEM-SN model, (a) offshore wind, (b) onshore wind, (c) solar
photovoltaics (PV), and (d) hydro run-of-the-river (ROR)
1792
5.2.2 Capacity and Available Potential
1793 taken from different sources, namely the Hotmaps project [256], ANGUS II project [257], Deutsche
The existing capacities and available potentials for the volatile generators and the storage investments are
Figure 16 shows the typical structures of the demand for electricity, heating, and hot water in northern Germany.
1794 WindGuard [258], AEE [259], and LIMES-EU project [260], as listed in Table 5.2. The available potentials 1795 are calculated from the maximum potentials and the existing capacities The Li-ion, Redox, and H2
potentials are assumed to be 5% of Germany’s available potentials, as stated in the project databases The
ACAES potential is assumed to be 50% of Germany’s total potential because of its availability in only
From these supply and demand structures it becomes quite obvious that other controllable sources are needed to reconcile the gaps between the largely fluctuating generation from wind and solar energy and the demands for electricity (including e-mobility) and heat.
4.2. MODEL STRUCTURE
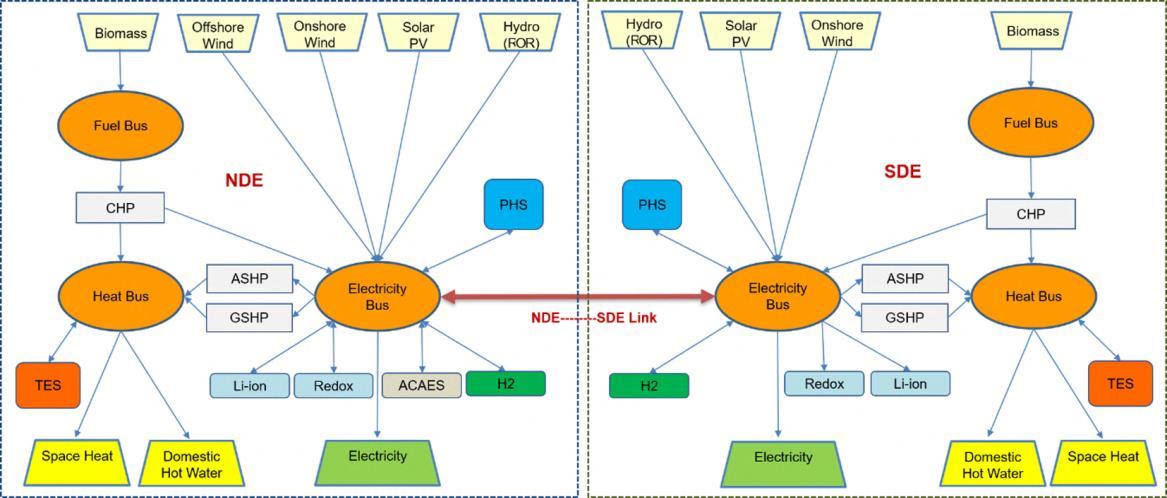
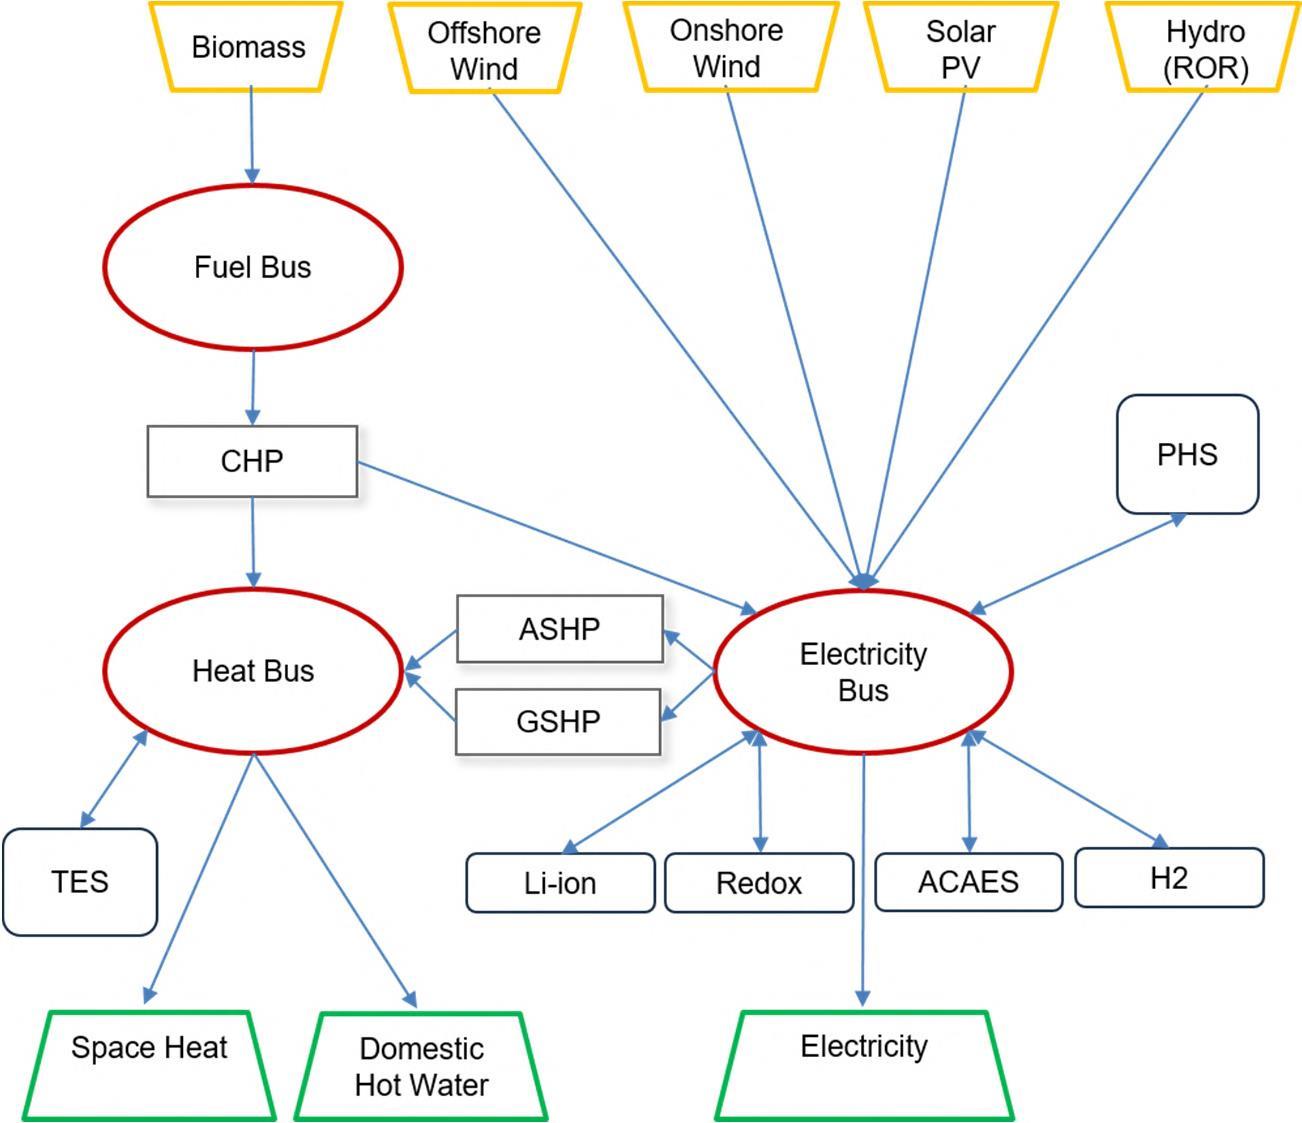
The basic structure of the model used for Germany can be seen in Figure 17, where Germany is considered as one area with one electricity bus and in Figure 18, where Germany considered as two areas connected by one large transmission line. The graphs show the different components, which make up the energy system, while the two regional systems (Northern and Southern Germany) are connected by one large high voltage power line. The same structure applies to the modelling of the Danish energy system, which is subdivided into two power supply system’s DK1 and DK2, which are different price zones in the Nordic power market.
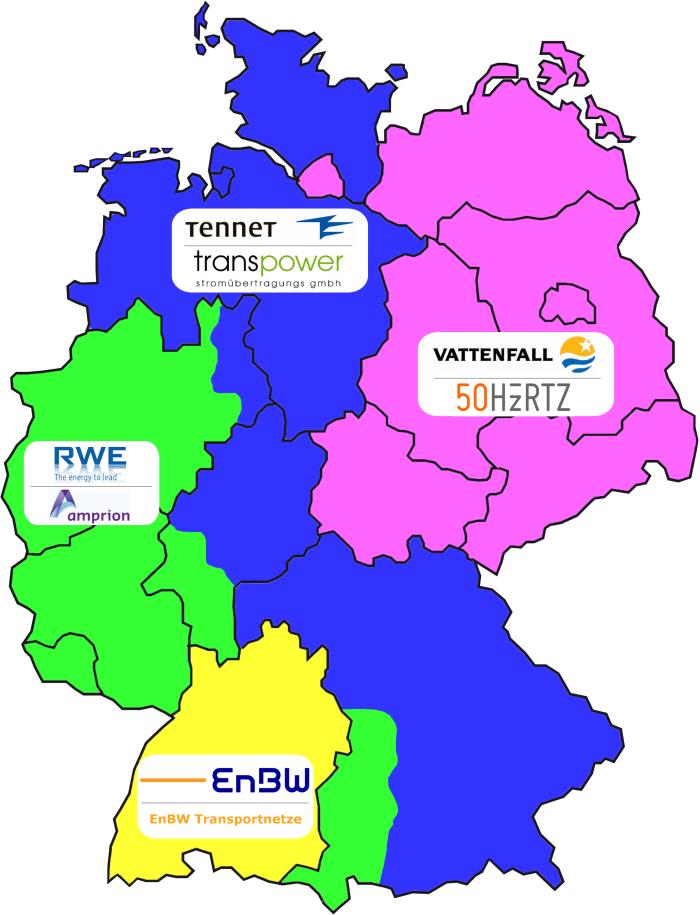
The energy system is far more complex, as it is made up by many regional subsystems. At the top level, the German power system is divided into four TSO (transmission system operator) areas (see Figure 19, left graph), namely the areas of Tennet, Amprion, 50Hz Transmission and Transnet BW, which can be depicted in the model as being connected by one large transmission line each representing the total connection capacities between each of the TSO areas (see Figure 19, right graph). Although, the other components of the energy system are not pictured in Figure 19, they must be modelled just like
22
Figure 16 Normalized electricity, space heat and hot water demand in Schleswig-Holstein across the year. (Maruf, 2021, p.11)
64 1790
Figure 5 3: Normalized demand profiles of SH in 2050
1791
1796
1797
1798
Germany. 1799
Northern
Technology Existing Capacity Available Potential Onshore Wind [GWel] 7 [258] 1.9 [259] Offshore Wind [GWel] 1.7 [258] 25.23 [260] Solar PV [GWel] 1.6 [259] 6.7 [259] Hydro ROR [MWel] 2 [259] 4 [259] Biomass & Biogas 1 GWh [259] 21.8 PJ [256] Li-ion [MWel] - 782.5 [257] Redox [MWel] - 46.5 [257]
Table 5.2: Capacity and available potential for volatile generators and storage in SH in 2050
1800
3 The maximum offshore wind potential, according to the LIMES-EU project, is 83 6 GWel The available potential of SH assumes the equal distribution of remaining capacities in the three northern states of Germany
in the simpler models shown in Figure 17 and 18. In Figure 19 it can be seen that the TSO regions are again divided into subregions, which can be modelled separately, again, just connected to each other by one major power line each. This level of regional disaggregation is chosen for the most complex level of modelling for the project.
23
Figure 17 Simplified block diagram of the OEMOF based energy simulation model with Germany as one area. (Maruf, 2021, p.7)
Figure 18 Simplified block diagram of the OEMOF based energy simulation model with Germany as two areas NED and SDE. Applies to the Danish energy system with DK1 and DK2 just as well. (Maruf, 2021a, p.5)
TenneT (formerly EONNetz, acquiredby TenneT, publicly-owned DutchTSO, Ownership Unbundling)
Amprion (subsidiary ofRWE, aVertically Integrated Undertaking)
TransnetBW (subsidiary ofEnBW, aVertically Integrated Undertaking)
ElectricityTransmissionSystemOperators
TenneT (formerly EONNetz, acquiredby TenneT, publicly-owned DutchTSO, Ownership Unbundling)
50Hertz (formerly VattenfallEurope Transmission, acquiredbyElia, publicly-owned BelgianTSO andIFM, anAustralian investmentfund, Ownership Unbundling)
Amprion (subsidiary ofRWE, aVertically Integrated Undertaking)
Morethan10gasTSOs, Ar.1600electricity andgasDSOs
TransnetBW (subsidiary ofEnBW, aVertically Integrated Undertaking)
What is more, the German energy system, specifically the electricity system is embedded into the European electricity system. Thus, every reasonable simulation of a scenario for the German power system has to take into account at least all connections to the direct electrical neighbours of Germany. Figure 20 depicts the basic layout of such minimal interconnected German/European power system, still ignoring all other members of the interconnected European electricity grid.
For the purpose of the modelling each of the neighbouring countries is treated as one energy system without regional disaggregation.
In more complex modelling the national energy systems of Germany and Denmark can be subdivided internally into the TSO regions or even the TSO sub regions, while keeping the connections to all neighbouring countries.
50Hertz (formerly VattenfallEurope Transmission, acquiredbyElia, publicly-owned BelgianTSO andIFM, anAustralian investmentfund, Ownership Unbundling)
Morethan10gasT
24
Figure 19 Simplified block diagram of the OEMOF based energy simulation model with Germany as four TSO areas (Gröbel, 2017, slide 6).
1600electricity andgasDSOs Electricity Bus Electricity Bus Electricity Bus Electricity Bus 6
Ar
ElectricityTransmissionSystemOperators
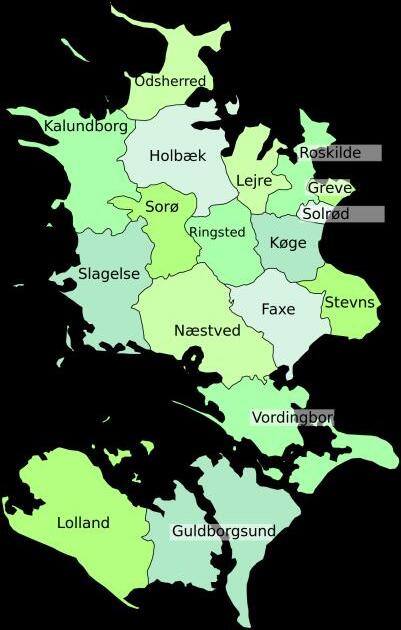
In addition to the different levels of disaggregation of the national energy systems of Denmark and Germany, the two project regions have to be singled out and connected to the national power system. In the case of Germany this is the physical supply area of Stadtwerke Flensburg (see Figure 22), consisting of Flensburg, Glücksburg and Harrislee. In the case of Denmark it is the region of the islands of Lolland and Falster or the communes Lolland and Guldborgsund (see Figure 23).
 Present Danish electricity system with its connection capacities to its electrical neighbours (Danish Energy Agency, 2018, p.7)
ut65GW, alyearly eighbouring 00MWinermany(see sbuilding 0MWtobe MW+1000 respecany(1,000 nglandare isionshave takenplace ntinuerenrelianton ctioncapac-
In total six different models defined by the countries included and by the regional resolution were created for the analyses to be conducted during the project. These are:
North andSwedentowardsEast)
(Source:Energinet)
1. Flensburg / Northern Germany / Southern Germany
2. Flensburg / Schleswig-Holstein /Northern Germany / Southern Germany
3. Lolland-Falster / DK1 / DK2 / Flensburg / Schleswig-Holstein /Northern Germany / Southern Germany
4. Lolland-Falster / DK1 / DK2 / Flensburg / Schleswig-Holstein /Northern Germany / Southern Germany / Norway / Sweden / Poland / Czech Repubilc / Austria / Switzerland / France / Belgium / Luxemburg / Netherlands
(Source:Energinet)
5. Lolland-Falster / DK1 / DK2 / Flensburg / Schleswig-Holstein / Tennet / 50Hz / Amprion / Transnet-BW / Norway / Sweden / Poland / Czech Repubilc / Austria / Switzerland / France / Belgium / Luxemburg / Netherlands

6. Lolland-Falster / DK1 / DK2 / Flensburg / Schleswig-Holstein / Tennet-1 / Tennet-2 / Tennet-3 / Tennet-4 / Tennet-5 / Tennet-6 / 50Hz-1 / 50Hz-2 / 50Hz-3/ 50Hz-4 / Amprion-1 / Amprion2 / Amprion-3 / Amprion-4 / Amprion-5 / Amprion-6 / Transnet-BW-1 / Transnet-BW-2 / Norway / Sweden / Poland / Czech Repubilc / Austria / Switzerland / France / Belgium / Luxemburg / Netherlands
26
7 deliveredto heheatto
Figure 23 The energy system of Lolland and Falster as part of the Danish energy system (Danish Energy Agency & Energinet, 2018, p.7)
ity-and
2037
erplantsto ectedfuture w
Peakconsumption(10yearwinter)
Figure12:ExpectedfuturetrendinDanishinstalled generationcapacityandpeakhourlyconsumption
0 1000 2000 3000 M WindandSolar Interconnectors
Figure1:1OverviewofthepresentDanishpower system(2018) Installedgenerationcapacities,and capacityofinterconnectorstoneighbouringcountries(Germanytowardssouth,Norwaytowards
DK1 Electricity Bus DK2 Electricity Bus Local Electricity Bus
With the increasing number of grid zones, which each have the complexity shown in Figure 17, the calculation time for solving such model increases dramatically. Thus, model 5 and 6 have hardly been used for our calculations.
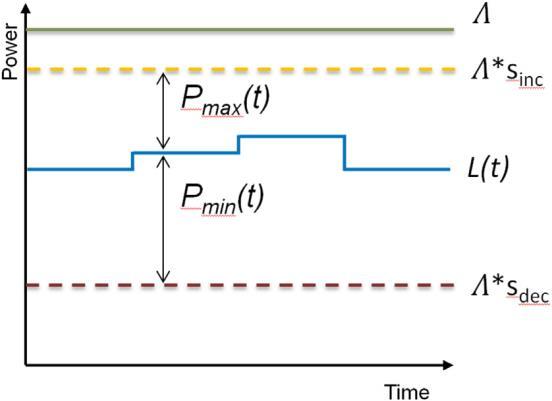
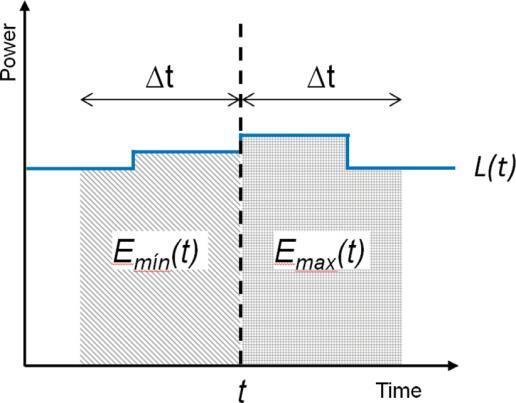
At the heart of our modelling analysis is the question of the possible role of direct and indirect storage in the two regions of the project (Lolland-Falster and Flensburg). Although, we are looking at very different ways of direct and indirect storage of electricity (time shift of heat production from power in large boilers or in decentralized heat pumps, the shifting of e-car or e-bus charging over time, the active use of car batteries to directly store electricity and feed it back into the grid or the time shift of the operation of compressor units in fridges or freezers, all these applications can be seen as temporary storage possibilities, which can supply a certain storage capacity to be charged (Pmax) or discharged (Pmin) for a certain time interval (Delta t) on demand. This can be schematically illustrated as shown in Figure 24.
27
Figure 24 A schematic view of shifting of power demand over time based on direct and indirect storage of electricity (Heitkoetter et al., 2021, p. 4).
Figure 25 Distribution of the potential values for load increase, Pmax (positive values), and load deacrease, Pmin (negative values) (Heitkoetter et al., 2021, p. 10)
A detailed analysis of the potential for shifting electricity demand in Germany in 2018 and 2030 conducted by Heitkoetter et al. (2021) shows that power-to-heat applications have by far the largest potential for load increases or decreases, while e-mobility and power-to-gas applications will become more important over time (see Figure 25) (please bear in mind the logarithmic scales of the graph).
In a similar analysis without considering e-mobility and power-to-gas Kleinhans (2014) has shown that there is a very significant difference in such indirect storage (or load shifting) potentials between the summer and winter seasons, which is mainly due to the absence of heating demand during the winter.
Figure 26 shows the temporal distribution of the buffer sizes and capacities of the nine technologies analysed during a winter week and the distribution of the same load shifting potentials during a summer week in Germany. While the load shifting potential is dominated by electrical heating in the winter, the main potential in the summer stems from air-conditioning and hot water (AC/W) Table 3 shows the estimated loads for the different technologies and their time shift potential in hours. Short verbal descriptions of the technologies are given as well.
Fig 2 Exemplified application of the framework for characterization of the potential for demand side management to the accumulated loads eligible forDSM in Germany during a winter week The colors in the respective panes indicate contributions from the respective categories detailed in Table 2 The scheduled loads in panel (a) were obtained from [23, p 154] Panels (b) and (c) indicate the contributions of the respective categories to envelopes of the sizes and capacities of the respective buffers as definedin Equations (4) In winter, the potential for DSM is strongly dominated by electrical heating devices Due to their limited shifting potential of only 8 h the size of the associated storage-equivalent buffer
Fig 3 Exemplified application of the framework for characterization of the potential for demand side management to the accumulated loads eligible forDSM in Germany during a summer week For details of the representation it is referred to the caption of Figure 2 In summer, the overall part of the demand available for DSM is much lower than in winter, since there is no significant contribution of electrical heating Instead air conditioning and warm water (category 2) gain in importance
fluctuates significantly in time Please note, that the conditions (5a) and (5b) need to be taken into account for each individual category and that a graphical validation of realized loadsthereforeisnot possiblefrom thisaccumulated plot Individualsplotsfor therespective categories (just as e.g presented in Figure 1) would be required for this purpose instead
28
8
0 5000 10000 15000 20000 25000 30000 S c h e d u l e d l o a d L [ M W ] (a) 1:HEAT 2:AC/W 3:CO-D 4:WHIT 5:VENT 6:CO-L 7:CO-H 8:IN-1 9:IN-2 -150000 -100000 -50000 0 50000 100000 150000 B u f f e r s i z e E [ M W h ] (b) -30000 -20000 -10000 0 10000 20000 30000 40000 0 24 48 72 96 120 144 168 B u f f e r c a p a c i t y P [ M W ] t [h] (c) Mon Tue Wed Thu Fri Sat Sun
Figure 26 Loads, buffer size and buffer capacity of different load shifting technologies in Germany during a typical winter and summer week (Kleinhans, 2014, p. 8-9)
David Kleinhans
Systematic characterization of the potential of demand sidemanagement 9 0 5000 10000 15000 20000 25000 30000 S c h e d u l e d l o a d L [ M W ] (a) 1:HEAT 2:AC/W 3:CO-D 4:WHIT 5:VENT 6:CO-L 7:CO-H 8:IN-1 9:IN-2 -150000 -100000 -50000 0 50000 100000 150000 B u f f e r s i z e E [ M W h ] (b) -30000 -20000 -10000 0 10000 20000 30000 40000 0 24 48 72 96 120 144 168 B u f f e r c a p a c i t y P [ M W ] t [h] (c) Mon Tue Wed Thu Fri Sat Sun
Ø Soziotechnisches DSI-Potential für eine Stunde bei Querschnittstechnologien (dA≤ 30m in)
h is considered
their energy demand and time
Table 2 Categorization of loads and their corresponding potential for demand side management as compiled and estimated by Klobasa [23, p 133] (categories numbers were redefined for reasons of clarity) T he corresponding loads L c (t)are available from model simulations for different weekdays and seasons [23, p. 154]. T his data is used for estimation of the potential for demand side management in Germany as shown in Figures 2 and 3
Since Schleswig-Holstein represents only about 3% of the German population, the regional potential for load shifting based on different possibilities in private households, the overall load shifting potential is proportionately small as Figure 27 shows. The share for industrial process based technologies is even smaller for Schleswig-Holstein due to its relatively low share in energy intensive industries (Steurer, 2016, p.68).
3.2 Characterization of the national potential of a European country for demand side management
As a second examplethe framework introduced in Section 2 is used forthe conceptual characterization of the potential for DSM in Germany An adequate categorization of loads with respect to their DSM characteristics in C =9categories and corresponding scheduled loads L c(t) is obtained from [23], where an in-depth analysis of the current German electricity sector and results from model simulations are presented. For this purpose Klobasa analyzed relevant industrial processesand domestic consumerswith respect to their potential for thetemporal shifting of loads In combination with information on the dissemination of therespectivetechnologiescharacteristic factorsfor DSM potential of different sectors of German electricity consumption could be estimated [23, p. 133]. Klobasa furthermore provides simulation data of the time-resolved loads of the respective sectors, both for a summer and a winter week [23, p. 154].
Details of the categories relevant for this work are compiled in Table 2. Simulation results for sector-specific load curves are available for weekdays, Saturdays and Sundays both in winter and summer. For the scope of this analysis the data was rearranged to cover one week (i.e. 5 weekdays, Saturday and Sunday) with periodic boundary conditions4 in winter and summer, respectively. The maximum capacities in the respective categories were set to the constant values listed in Table 2
Speicherheizungen Wärmepumpen Warmwasser Umwälzpumpen
Abb. 3-19: Regionale Verteilung soziotechnischer DSI-Potentiale in positiver und negativer Richtung bei Querschnittstechnologien in Industrie, GHD und
The data and results for the analysis with the framework introduced in Section 2 are exhibited in Figures 2 (winter week) and 3 (summer week). From inspection of the figures in particular the high potential of electric heating systems in winter for DSM actions becomes evident.
To our knowledge this time-dependent size, which is highly relevant forthe characterization of the potential of DSM as energy storage-equivalent technol-
29
3 Analyse von DSI-Potentialen und ihrer Nutzungscharakteristika 70
0,0 0,2 0,4 0,8 1,0 1,2 1,6 1,8 2,0 Ø 1 Stunde Ø 4 Stunden Ø 1 Stunde Ø 4 Stunden Ernährungsindustrie Kunststoffindustrie Metallbearbeitung Maschinenbau Fahrzeugbau Landwirtschaft Gartenbau Büros Beherbergung Krankenhäuser Handel Gastronomie Kühlhäuser Wasserversorgung Recycling
1 000 MW
Haushalten
in positiver Richtung (Lastreduktion) in negativer Richtung (Lasterhöhung)
el
BY BW HE NW HB BB TH RP SL ST SN BE MV SH NI HH 100 MWel 10 MWel BY BW HE NW HB BB TH RP SL ST SN BE MV SH NI HH 1.000 MWel Haushalte BY BW HE NW HB BB TH RP SL ST SN BE MV SH NI HH 100 MWel 10 MWel BY BW HE NW HB BB TH RP SL ST SN BE MV SH NI HH Industrie und
0 10 Ø 1 Stunde Ø 4 Stunden Ø 1 Stunde Ø 4 Stunden
Waschmaschinen Wäschetrockner Geschirrsp
GHD
Kühlgeräte Gefriergeräte Klimaanlagen
üler
Table 3: Different load shifting technologies,
shifting possibilities analyzed by Kleinhans for Germany (Kleinhans, 2014, p. 8-9)
10 David K leinhans cCode Description Λ [M W] ∆ t [h] 1HEAT Electric Heating 25000 8 2AC/ W AC and hot water 10000 4-8a 3CO-D Domestic cooling devices 2000 1 4WHIT Domestic white goods 1400 24 5VENT Ventilation 900 4 6CO-L Cooling (low and intermediate power facilities) 800 4 7CO-H Cooling (high power facilities) 200 4 8IN-1 Industry
technologies) 800 4 9IN-2 Industry
2200
Figure 27 Regional distribution of the capacities of different load shifting technologies in Germany. Right side: load reduction, Left side: load increase (Steurer, 2016, p.70)
(cross-sectional
(high demand, curtailment only)
a For analysis ∆ t2 =6
The cost of load shifting options vary widely as can be seen in the right-hand part of Figure 28 (red curve) for Germany. Shifting electrical heating based on heat pumps or resistance heating comes at very low costs, while shifting of electricity demand with the help of household appliances can cost many times as much. Nevertheless, the shifting based on electrical heat has a very large share of the overall potential (Steurer, 2016, p 75). The Figure includes the cost of stopping industrial production on demand as well (blue curve), but in this case it shows the cost of the production lost, which is not subject of our project.
3 Analyse von DSI-Potentialen und ihrer Nutzungscharakteristika 75 Diagramm), die spezifischen Integrationskosten (Investitions- und Fixkosten) im Sinne des Erschließungsaufwands auf der sekundären y-Achse (rote Kurve im Diagramm) dargestellt. Der hellblaue und der hellrote Bereich um die beiden Kurven kennzeichnen mögliche Abweichungen bei DSI-Potentialen und -Kosten, die durch Fehlerfortpflanzung der ermittelten Unsicherheiten der Eingangsdaten bestimmt wurden.
Haushaltsgeräte
Produktionsprozesse (z B Metallerzeugung, Papier, Zement, Chemie)
Kleinere industrielle und gewerbliche Liegenschaften
Abb 3-22: Kosten-Potential-Kurve für Lastverschiebung in Deutschland
Klar erkennbar ist der Unterschied zwischen industriellen Produktionsprozessen auf der linken Seite der Grafik und den Querschnittstechnologien auf der rechten Seite hinsichtlich der Kostenstruktur. Industrieprozesse haben aufgrund typischerweise bestehender IKT-Ausstattung und der hohen nutzbaren Leistung je Standort vergleichsweise sehr geringe spezifische Integrationskosten. Insbesondere stromintensive Industrieprozesse sind relativ häufig bereits in der DSI-Vermarktung (v. a. Regelleistung, AbLaV) und haben keinen weiteren Erschließungsaufwand. Da diese Prozesse jedoch oftmals mit hoher Auslastung fahren, kann es bei der DSINutzung zu Produktionsbeeinträchtigungen kommen, die erhebliche variable Kosten verursachen.
Zur Einordnung der gezeigten Kostenspanne: Ganz links im Diagramm ist Elektrostahl eingetragen, für das der Verband Wirtschaftsvereinigung Stahl eine Spanne von 270 bis
30
1
€
0 200 400 600 800 1.000 1.200 0 200 400 600 800 1.000 1.200 0 2 4 6 8 10 12 14 16 18 20 Ø S p e z . E r s c h l i e ß u n g s a u f w a n d [ € / ( k W e l · a ) ] Ø N u t z u n g s a u f w a n d [ € / M W h e l ]
200
/MWhel angibt Der durchschnittliche Börsenstrompreis lag 2015 bei knapp
Maximales technisches Potential für Lastverschiebung [GWel]
Raumwärme
ühlhäuser
Große Supermärkte und Warenhäuser elektrische
Große gewerbliche Liegenschaften K
industrielle Liegenschaften
Große
Figure 28 Merit order cost curve of different load shifting technologies in Germany (Steurer, 2016, p.75)
4.3. SCENARIOS
The scenarios selected as a framework for the simulations done for the project are based upon the European Ten Year Network Development Plan (TYNDP 2020) (ENTSO-E, 2023), the German Network Development Plan 2035 (Bundesnetzagentur, 2022), and the Danish Network Development Plan (AF22) (Energistyrelsen 2023). This approach has been chosen to reach the greatest possible consistency between the assumed developments in Germany, Denmark and the rest of the EU, as the German Network Plan (NEP 2035) and the Danish Network Development Plan (AF22) are closely coordinated with the European Ten Year Network Development Plan (TYNDP 2020). In order to keep all assumptions consistent the German Network Development Plan uses only one of the three TYNDP 2020 scenarios (called ‘Distributed Energy’) to take into account all assumptions about the capacity developments of the neighbouring countries (Bundesnetzagentur, 2020, p. 94). What is more, it uses all major cost assumptions concerning conventional fuels from the TYNDP 2020 (Bundesnetzagentur, 2020, p. 66). Table 4 shows the development of the assumed capacities in Germany until 2035 (scenario A, scenario B and Scenario C). For scenario B an outlook till 2040 is given as well. For the calculations of this report we have chosen scenario B, as the most likely scenario. Although, the Danish network plan does not provide such a condensed oversight of the planned capacities, the data documentation accompanying the plan gives a very detailed oversight of all the planned capacities for each year from 2022 to 2050. Table 5 shows a part of the table giving an overview of the development of power plant capacities. Different from the German Network Development Plan the Danish Network Plan AF22 uses a different TYNDP 2020 scenario as general reference, the ‘National Trends’ scenario (Energistyrelsen, 2023, p. 4), which assumes a development based on past trends, not on the future necessities of climate change, a reason, why this scenario was not adopted in the German Network Development Plan. Nevertheless, the cost assumptions for conventional fuels are all taken from TYNDP 2020, which are shown in Table 6.
31
32
Table 4 Specifications of the three scenarios of the German Netzentwicklungsplan for 2035 for Germany ( Bundesnetzagentur, 2020, p. 4)
Kraftværkskapaciteter
er enten konserveret eller betinget driftsklar og tages ud af drift i løbet af 2022 er ikke medta
er enten konserveret eller betinget driftsklar og tages ud af drift i løbet af 2022 er ikke medta
Decentral
decentrale kraftvarmeanlæg i centrale såvel som decentrale fjernvarmeområder
findes udover den opgjorte decentrale kapacitet også nogle anlæg, der normalvis ikke leverer til det kollektive
Østdanmark (MW, primo år)
medtager decentrale kraftvarmeanlæg i centrale såvel som decentrale fjernvarmeområder.
findes udover den opgjorte decentrale kapacitet også nogle anlæg, der normalvis ikke leverer til det kollektive
til figurer
Analyseforudsætninger 2021 (AF21) til sammenligning
33
Table 5 Partial view of the table giving the development of conventional power plant capacities for Denmark from 2022 to 2050 according to AF22 (Energistyrelsen, 2023a)
Central elkapacitet Central elkapacitet (MW, primo år) 2022 2023 Vestdanmark (DK1) 1,928 1,963 Østdanmark (DK2) 1,610 1,870 I alt, Danmark 3,538 3,833 Anlæg,
Central elkapacitet,
2022 2023 Vestdanmark (DK1) 1,928 1,963 Østdanmark (DK2) 1,610 1,870 I alt, Danmark 3,538 3,833 Anlæg, der
der
alternativforløb (MW, primo år)
elkapacitet Decentral elkapacitet, Vestdanmark (MW, primo år) 2022 2023 Baseret på naturgas 1,167 1,167 Baseret på øvrige typer brændsler 485 478 I alt, Vestdanmark 1,652 1,644 Oversigten medtager
Der
Decentral elkapacitet,
2022
Baseret på naturgas 354 354 Baseret på øvrige typer brændsler 314 303 I alt, Østdanmark 668 657 Oversigten
Der
Elkapacitet (MW, primo år) 2022 2023 Centraleværker 3,538 3,833 Decentrale værker 2,320 2,302 I alt, Danmark 5,858 6,134
Elkapacitet (MW, primo år) 2022 2023 Centraleværker 3,895 3,595 Decentrale værker 2,195 2,040 I alt, Danmark 6,089 5,634
2023
Data
4.4. RESULTS
The preliminary results of our model calculations can be summarized in a few important take away messages (Detailed numerical results of the modelling work will be published in a scientific journal article after some further refinement and review):
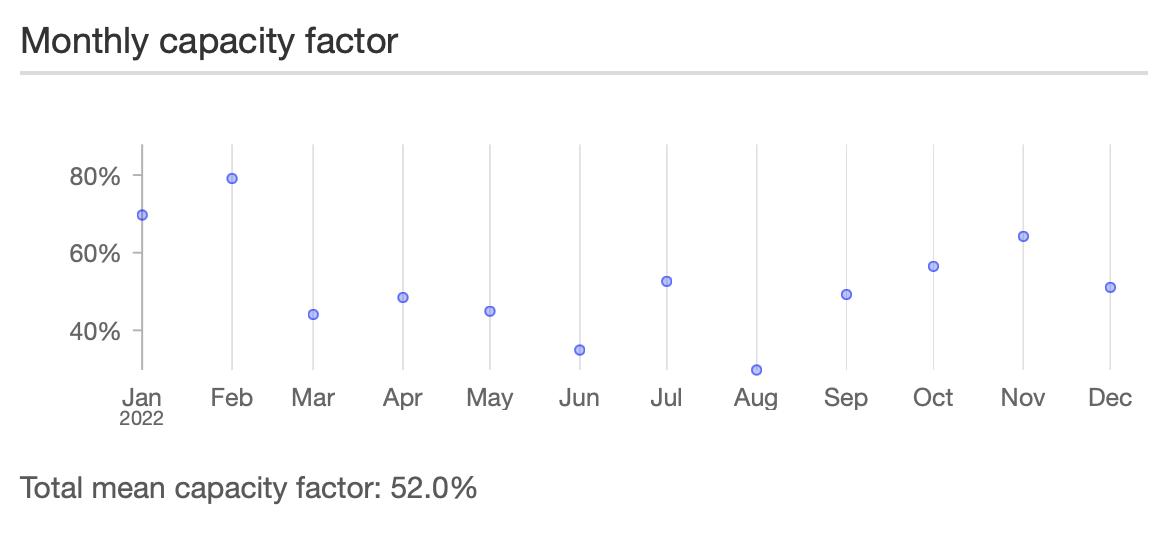
• Similar to previous studies our results show that the largest potential for indirect storage lies in the very large potential for heat storage based on electrical heating (power-to-heat) mainly using heat pumps. These potentials can be roughly divided into central heat storage based installations connected to district heating grids, like in the case of Flensburg, and decentral heat storage connected to single heat pumps supplying single one- or multi-family houses in rural areas not connected to heating grids. In addition mid-sized heat storage installations can be found in local small heating grids, with a similar configuration, which can often be found in Denmark An open question remains about the possibility of using the heat capacity of the building shells of single houses as heat storage instead of heat storage tanks using hot water, which saves the investment costs for the water storage. The disadvantage of the use of the building envelope as heat storage is the limited possibility to increase the indoor temperature above the comfort level of the inhabitants. In the case of a hot water storage an increase of the water temperature does not have any impact on the room temperatures of the house. Although, the indirect storage potential of the use of excess power for electrical heating is mainly limited to the heating season (except the use of e-heat for hot water during the rest of the season), the heating season in Denmark and northern Germany coincides quite well with the wind strong months of the year as can be seen in Figure 29 (heating degree days per month) and Figure 30 (monthly wind energy capacity factors in Lolland).
34
Table 6 Fuel prices taken from TYNDP 2020 (ENTSO-E, 2023, p.48)
Heating degree days 2022
• Depending on the market diffusion speed of e-vehicles for private transport the time shifting potential of the charging processes for private e-cars will be substantial by 2035. While this potential is still comparatively small compared to the indirect storage of surplus energy in heating, it will be increasing considerably over time. As in the case of power-to-heat it will be crucial that the time and level of charging will be available for a centralised dispatch in order to be coordinated with the vastly fluctuating residual load on the electricity grid. Whether the use of car batteries as active grid storage will become a significant option will highly depend on the willingness of private car owners to give access to their batteries for discharging them, while not directly needed.
35
Figure 29 Number of heating degree days per month in Denmark and Schleswig-Holstein 2022 (Eurostat, 2023)
0, 100, 200, 300, 400, 500, 600, 2022-01 2022-02 2022-03 2022-04 2022-05 2022-06 2022-07 2022-08 2022-09 2022-10 2022-11 2022-12
Figure 30 Wind energy capacity factor in Lolland in 2022 (Renewables ninja, 2023)
Schleswig-Holstein Flensburg, Kreisfreie Stadt Danmark Vest- og Sydsjælland
• Other options of indirect storage, like refrigerators and freezers, as well as active demand shift options, like the postponement of the use of washing machines or dryers by households, will remain only minor options for demand side management in the project regions.
• The greater Copenhagen area will become a key heat sink for power-to-heat applications in Denmark, which could absorb a substantial share of the overproduction of wind energy in the eastern Danish electricity grid (DK2).
• Extensive seasonal heat storage in the Copenhagen area based on heat storage in the geological underground may become a viable option
• Overproduction from wind energy in Denmark and northern Germany will become main drivers for the need to increase transmission capacities, direct and indirect storage, demand side management, and all forms of power-to-X conversion processes. It can be foreseen that there will be a competitive situation between further increases in transmission capacities and local direct and indirect storage, demand side management, and power-to-X activities.
• The larger the discrepancies between local wind energy capacity expansion and local and regional grid expansion will remain, the higher will be the potential for local direct and indirect storage, demand side management, and power-to-X activities.
• The internal transmission capacities between the Lolland/Guldborgsund region and the Copenhagen region will be the key grid bottleneck for the Lolland/Guldborgsund region.
• A key international transmission bottleneck for Denmark will be the capacity of the grid connections to Germany, which has been expanded recently and will be further expanded in the near future.
• The key bottleneck for Schleswig-Holstein will be the connection of Schleswig-Holstein with the rest of the German grid and the further connection of the north German grid with southern Germany. The development of the capacities of the new DC links between norther and southern Germany will largely determine the need for regional direct and indirect storage, DSM and power-to-X activities in Schleswig-Holstein.
• For both, Schleswig-Holstein and Denmark, Norway will become an even more important passive electricity storage option based on its vast storage hydro power system only limited by the capacity of the respective interconnectors. In the future these interconnectors will be utilised far more for the export of wind based overproduction in Schleswig-Holstein and Denmark than today.
• Besides Norway, Sweden may become a second large international passive storage hub option based on its substantial storage hydro power system and the strong interconnections to Denmark and Germany.
36
5. DG STORE POTENTIALS, BARRIERS & RECOMMENDATIONS
This chapter will highlight some of the findings from the “DG STORE” project here showcasing some of the potentials, barriers and policy recommendations associated with the showcases. The three main themes that will be presented in this chapter is:
• Storage solutions for utilities.
• DSM solutions by aggregating.
• DSM solutions by smart charging
5.1. STORAGE SOLUTIONS FOR UTILITIES
In the DG STORE project, the utilities Lolland Forsyning and Stadtwerke Flensburg investigated the storage potentials and barriers in connection to electrode boilers here in combination with hot water storage tanks. Through analysis of operating behavior of electrode boilers by Stadtwerke Flensburg in the DG STORE project and the theoretical advantages and disadvantages of implementing electrode boilers investigated by Lolland Forsyning, the below have been highlighted (see Table 7):
Advantages
- Small investment
- Flexible regulation
- Low standby-consumption for new electrode boilers
- Fast startup
- Easy and cheap maintenance
- Small space requirements
- Can provide a green alternative to current fossil-based peak and reserve load technologies on the heating side
Disadvantages
- Electricity price range varies
- Electricity can have high tariffs
- Can be expensive as a peak load heating resource on cold days with high electricity prices
37
Table 7 Shows advantages and disadvantages of electrode boilers (Ea Energianalyse & PlanEnergi, 2021).
5.1.1. POTENTIALS
There are many advantages to using electrode boilers as a peak load heating resource for district heating or process heat for the industry. These electrode boilers are usually installed as a peak-load capacity (5-60 MW) on the medium- to high voltage grid as opposed to electric boilers that has a smaller capacity (1-2 MW) and is installed on the low voltage grid using electric cartridge heaters as opposed to electrodes. Furthermore, the fast ramp up times (0,5-5 minutes) can provide a green alternative to current fossil-based peak and reserve load while it can also be used for flexibility services by using low electricity prices on the spot market or providing down-regulating services (Ea Energianalyse & PlanEnergi, 2021) The electrode boilers also have a high efficiency at almost 100% and can produce heating with temperatures between 95-98°C and are now a well-known and tested technology with relatively low investment as well as low maintenance costs (Energistyrelsen, 2022)
This provides economic potentials considering the volatile energy prices and the increasing fluctuating renewable energy production both in Denmark and Germany. Stadtwerke Flensburg have an installed electrode boiler with a peak-load capacity of 30 MW combined with a hot water heat storage tank of 29.300 m³ also used by the central heat and power plant units. The electrode boiler is used on the Danish regulating power market as a minute reserve if called upon by the transmission system operator (TSO). Thus, the electrode can be used for downregulating services, if bottlenecks arise in the respected region (Ea Energianalyse & PlanEnergi, 2021). However, the electrode boiler can also be used for utilizing the electricity spot market when prices are low. Optimization of the electrode boiler and heat storage capacity in relation to low electricity prices and lower tax burden have been analyzed during the DG STORE project In 2022 Stadtwerke Flensburg’s electrode boiler produced 28% more heating compared to 2021, which were a benefit of the optimized operating behavior. This have contributed to Stadtwerke Flensburg planning to build a second electrode boiler (40 MW) in combination with another hot water storage tank of similar capacity as the current one of 29.300 m³.
For further information on the optimization and economic potentials please contact Tom Trittin, Executive Assistant to the CEO at Stadtwerke Flensburg.
5.1.2. BARRIERS
The main disadvantage for the electrode boilers is the price range on electricity, which can vary depending on many factors and have been extremely volatile in 2022 (cf. chapter 3.0.). These high tariffs also play a key role in the profitability of the electrode boilers whereas Stadtwerke Flensburg, Germany, experienced a price increase in 2021 of 662% from 20,5 €/MWh to 135,6 €/MWh depending on whether the electricity used for heating production originated from their own power production and whether the fuel type for this production was based on fossil. An example of tariffs charged on electricity bought from the grid in Germany are the tax on electricity (20,5€/MWh), network charges (39,2€/MWh), the renewable energy act levy (26-65€/MWh) and other tariffs (10,9€/MWh) (Stadtwerke Flensburg, 2021) which heavily impact on the cost of heat produced from electricity
38
besides the pure spot market price of the electricity itself. The profitability and the full load operating hours of the electrode boilers at Stadtwerke Flensburg were minimal due to these high tariffs/levies. However, due to the extremely volatile electricity prices in 2022, Germany’s Federal Government decided to permanently abolish the renewable energy act levy (EEG) in January 2023 to reduce the cost burden of the EEG levy and to pass on this reduction to end consumers (The Federal Government, 2022). With these reduced levies/tariffs it is now much more interesting to look at electrode boilers in combination with hot water storage tanks. Nevertheless, it does not seem to make a lot of sense to charge an electricity tax on electricity used for electrical heating in times of renewable overproduction and downregulation as this downregulated electricity could not be used and taxed, if it would not be used for heat production and heat storage.
The biggest regulatory barrier according to Stadtwerke Flensburg is currently the network charge tariff which limits the full load operating hours even when electricity prices are low or negative. In such a scenario where power production is not profitable through their central heat and power plant, the electrode boiler could run with cheap electricity from the electricity grid and in that case provide the needed heat for the local district heating. Stadtwerke Flensburg however sees the network charges as making this uneconomic at most times even though the electricity prices are cheap or even negative.
5.1.3. POLICY RECOMMENDATIONS
As the primary operating costs of the electrode boiler is the electricity price, this is highly affected by policy driven tariffs/levies like the EEG levy in Germany or the varying electricity spot market prices. With the example of the EEG levy being abolished in Germany at the start of January 2023, the Danish counterpart to this levy was the ‘Public Service Obligations’ (PSO) tariff which were discontinued in 2022 (cf chapter 3.2 ) Like the German EEG Levy the revenue from the tariff/levy was used to cover costs related to renewable energy and decentralized plants, as well as research funding and their administration (Energistyrelsen, n.d.).
This trend in Denmark and Germany to lessen the electricity tariffs/levies opens for a better business case for utilities in utilizing the overproduction of renewable energy from wind and solar through downregulating services or converting cheaper electricity at the spot market to heating energy for their district heating networks. Another interesting development in Denmark is the geographically differentiated tariffs which in its first iteration have been focused on the local capacities concerning connection tariffs for production of renewable energy (cf. chapter 3.2.). In the second iteration of these geographically differentiated tariffs, the consumption side could prove interesting in relation to economic incentives for the placement of industrial electrode boilers on the 10 kV voltage level in congested zones like Lolland-Falster (Plesner, 2023) The geographically differentiated consumption tariffs are expected to support the placement of facilities like power-to-x plants, or industrial electrode boilers with a large electricity consumption that will respond relatively strongly to price signals of consumption tariffs (Energistyrelsen, 2021) However, these changes will not be implemented until
39
2024, since the legislative framework and methodology of this geographically differentiated consumption tariffs are still under development in Denmark (KEFM, 2023).
In Germany there are discussions on splitting Germany into different power price zones depending on the capacity of renewables in the different states (Wehrmann, 2022). Whether a geographically differentiated tariff structure like the one being developed in Denmark could be the solution in Germany is hard to tell but is nonetheless an interesting development to follow on whether these geographically differentiated price incentives will work as intended in Denmark.
5.2. DEMAND SIDE MANAGEMENT SOLUTIONS BY AGGREGATING
In the DG STORE project, three showcases investigated demand side management by aggregating different technologies.
One showcase was the German housing company Selbsthilfe-Bauverein eG (SBV) that wanted to test how smart refrigerators in a new housing project could be used in a smarter way through controlling the compressors and pooling several refrigerators together. However, in 2020/2021 no refrigerators were available on the market with basic data access that could record energy consumption or allow control of the compressor independently of the temperature. However, with the emergence of inverter refrigerators the smart home refrigerators could still be an interesting flexibility solution to look at in the future when considering home appliances are becoming smarter and easier to adjust the use time of in a flexible manner and could open for households participating actively in flexibility trading (Neupane et. al., 2022, p.368; Zhang et al., 2022, p.429).
Another showcase investigating demand side management were Vitani Energy Systems together with the grocery store company Salling Group, who wanted to demonstrate how energy consumption could be shifted in a typical grocery store through a forecast-based approach retrieving data on the amount of green electricity available, weather forecast, solar, wind and rain influence. This approach could ensure that a typical grocery store could optimize their energy consumption without compromising the temperature in the refrigerators/freezers or in the store itself. IT-security problems did however prove a larger barrier than anticipated and Vitani Energy Systems solution could not be further tested in the ‘Netto” grocery store during the DG STORE project. However, in 2022 Salling Group managed to become the first grocery store chain in the world to connect 500 of their Danish ‘Netto’ grocery stores to the ‘Flex Platform’ which is a flexibility aggregation platform developed by Andel & IBM Denmark, using artificial intelligence, IoT and Blockchain solutions (Andel, 2020; Salling Group, 2022) This ‘Flex Platform’ provides an opportunity for Salling Group to sell their system services by regulating the energy consumption of their ventilation, heating, cooling, and refrigerators/freezers Thus, Salling Group are compensated for being standby on a flexibility market and are also compensated if the system services get activated by the Danish TSO, Energinet.
40
The last showcase which this chapter will delve deeper into were the showcase from Neogrid Technologies together with Lolland Municipality. Here aggregation of residential heat pumps for system services were investigated The Danish TSO, Energinet, who was a network partner in the DG STORE project worked on defining the role of an aggregator and introducing this into the rules for the Danish electricity market Thus, Energinet worked on designing market frameworks that allow various technologies to contribute to the balancing of the electricity grid and making the market for system services more accessible to actors like Neogrid Technologies.
5.2.1. POTENTIALS
As mentioned, this chapter will delve into the potentials associated with aggregation of heat pumps investigated in the showcase from Neogrid Technologies and Lolland Municipality From a system perspective demand side management will be a key component in shifting local consumption and optimize local operation which can reduce the overall cost for grid reinforcements by the Distribution System Operators (DSO’s) and thus lower electricity prices. Therefore, a big interest is shown in developing more system services that can help balance the electricity grid to fit the increasing amount of fluctuating electricity production from wind and solar (Neogrid Technologies, 2023).
As shown on Figure 31, the electricity consumption from heat pumps in Denmark is expected to rise drastically towards 2030 as individual natural gas boilers are phased out and more industry sees a benefit in utilizing excess heat from their industrial processes (Energistyrelsen, 2023b). In 2020 8% of all residential buildings in Denmark used heat pumps as their primary heating technology. This percentage is expected to rise to 14% in 2030 and to 20% in 2035, thus it is expected that around 260.000 residential buildings will have heat pumps in 2030 (Danish Energy Agency, 2022). Denmark Statistics showed that the number of heat pumps increased from 176.240 in the start of 2022 to 222.455 in the start of 2023, which is a record rise of 26% (Home A/S, 2023). Considering this drastic
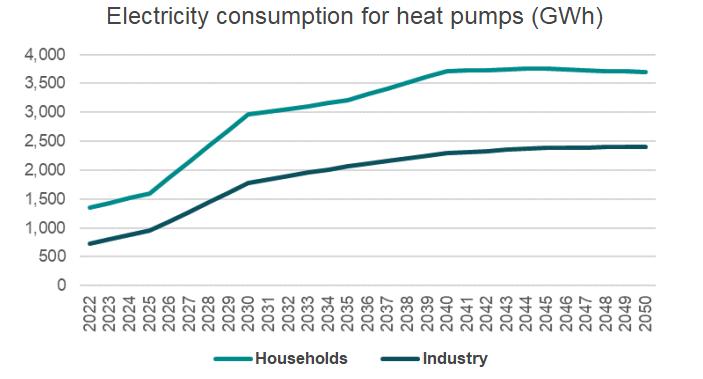
41
Figure 31 Shows the expected heat pump electricity consumption towards 2050 in Denmark (Energistyrelsen, 2023b)
increase in heat pumps used as the primary heating in residential buildings in Denmark, a clear potential can be seen.
Initially, Neogrid Technologies investigated how heat pumps could be controlled smarter through cloud-based controlling systems that could help avoid expensive tariff hours and electricity prices by incorporating data from weather and price forecasts. This showed an initial economic potential for the heat pump owners of 5-10% savings on their electricity bill. The next step is to aggregate all these cloud-controlled heat pumps in a pool which can be sold as a system service on a flexibility market.
The Danish TSO is still designing the market framework for aggregators and Neogrid Technologies is working on qualifying their pool of heat pumps and investigate the economic potential for the endusers (Neogrid Technologies, 2023).
5.2.2. BARRIERS
Neogrid Technologies have experienced several barriers while working on the showcase in the DG STORE project. One of these barriers is the lack of standardization on the design of heat pumps which, does not allow third-party access to most heat pumps available on the Danish market. This currently increases both costs and time in connecting heat pumps to a larger pool Main costs operating a pool of heat pumps currently comes from connecting a heat pump to the pool platform besides the actual development of the aggregator platform and operation hereof (ibid.)
As the market framework for aggregators are still under development in Denmark it is relatively hard to provide system services through an aggregated solution today as the aggregator must be prequalified with their aggregated pool and must be tested before they can enter the market for system services (Energinet, 2022) Getting approved with a pool of aggregated heat pumps today is rather lengthy process and requires a relatively large bid size to get approved. This could be done today in close collaboration with a Balancing Responsible Party (BRP) where heat pumps can be pooled with other flexible devices to secure bid size, however this is time consuming as BRP IT interfaces are different from each other (Neogrid Technologies, 2023)
Lastly, aggregating heat pumps are a complicated business model that must be more lucrative compared to a locally optimized operation of heat pumps which already in itself provides lucrative savings for the heat pump owner Thus, building a pool of aggregated heat pumps provides a complex value chain which must be balanced between administrative costs and the benefits of the flexibility solution This value chain must be comprised of a fair and understandable compensation mechanism between the BRP, aggregator and heat pump owner. This value chain might also be further strained considering the increased competition on system services on the new Nordic market that will be implemented in 2023/2024 (cf. chapter 3.5.; Energistyrelsen, 2021a).
42
5.2.3. POLICY RECOMMENDATIONS
In Denmark there is currently a need for more standardization from heat pump manufacturers to make these more accessible for third-party access. When looking outside the borders of Denmark solutions have already been found to overcome this barrier. In 2012 the German heat pump association ‘Bundesverbad Wärmepumpe’ introduced a ‘SG Ready’ label certifying that the heat pump was smart grid ready and had third-party access. This label has since its introduction in Germany become a requirement in the beginning of 2023 to qualify for federal subsidies when changing to a heat pump from e.g., natural gas boilers (gridX, n.d.). This regulation is a good example on how regulation can significantly reduce connection costs which is one of the main costs associated with operating a pool of heat pumps.
In relation to the design of the market framework, Energinet is already working on making the system services market more accessible while also providing easier access for aggregators. The current process of getting approved as an aggregator in Denmark is complex and very strict in qualifying the effect of a pool of heat pumps. Neogrid Technologies have in their showcase found that the DSO markets for system services are limited today which is a result of these still being under development. However, one solution provided for the DSO markets are the ‘Flex Platform’ by Andel & IBM previously mentioned which is currently the only standard market solution in Denmark at the DSO-level (Neogrid Technologies, 2023)
5.3. DEMAND SIDE MANAGEMENT SOLUTIONS USING SMART CHARGING
In the DG STORE project, three showcases investigated the possibilities of demand side management through smart charging of e-vehicles and e-busses. However, several factors played a role in delaying the implementation of these showcases which resulted in a more theoretical approach to this topic
The first showcase was the German housing company Selbsthilfe-Bauverein eG (SBV) that wanted to gather information about the charging behavior of e-vehicle owners and their willingness to allow controlled charging and discharging of their e-vehicles. SBV conducted a member survey in 2021 with 2600 participants, which showed that less than 1,8% of these already owned an e-vehicle, and 10,7% showed an interest for more e-vehicle charging infrastructure. An interesting follow-up question showed that 8,9% of the members were interested in acquiring an e-vehicle if the proper charging infrastructure were available (SBV, 2021). Out of the 1,8% members that already owned an e-vehicle, SBV managed to receive one signed expression of interest in letting their private e-vehicle participate in controlled charging and discharging at the installed charging station in Wohnpark Tarup, Flensburg. This proved more difficult than expected as the e-vehicle could not use bidirectional charging, but nonetheless statistical data from the respective charging processes were obtained through consent of the SBV members. This statistical data was later extrapolated for the energy modelling in the Flensburg area.
43
The second showcase were Stadtwerke Flensburg that also investigated bidirectional charging through their company’s e-vehicle fleet. This however also proved to be problematic as their current e-vehicle fleet and charging infrastructure were not capable of bidirectional charging. The profitability of additional investments in new charging infrastructure or suitable electric vehicles was not apparent at the time, however with the elimination of the EEG levy and more interest from car manufactures in building bidirectional ready e-vehicles this could prove interesting when the current company evehicle fleet would have to be replaced (cf. chapter 5.1.3.). The profitability with the abolishment of the EEG levy was not recalculated within the scope of the project.
The last showcase investigating smart charging were Aktiv Bus Flensburg, which had plans to fully transition their bus fleet to electric busses and built a new bus depot. To avoid additional strain on the electrical grid a smart charging system were to be developed. This system would then be able to handle bidirectional charging and help the grid in peak demand situations through a loading management software The first electric busses were to be acquired within the duration of the DG STORE project and test the planned loading management software. The delay in the overall project and a lack of subsidies, postponed the acquisition of electric busses. The first 10 electrical busses out of 20, are expected to arrive in the beginning of 2024. Thus, the testing of a smart loading management software could not be achieved within the scope of the DG STORE project.
5.3.1. POTENTIALS
The growth of e-mobility and charging infrastructure are seen in both Germany and Denmark with a political push for a faster transition to e-vehicles. A lot more e-vehicles are expected to arrive on the Danish and German roads towards 2030. In Germany the political ambitions by 2030 are 10 million evehicles (1.038.731 BEV’s today) and in Denmark this is 1 million e-vehicles (113.000 BEV’s today) (Besserladen, 2022; Danmarks Statistik, 2023; Dansk e-Mobilitet, 2022; European Commission, 2023). This shows a vast potential for demand side management considering the expected increase in battery electric vehicles (BEV’s) will be tenfold by 2030 compared with today.
A German initiative were started in 2021, to establish bidirectional charging as an important component of the energy and transportation transition in politics and society, and to ensure the progressive development of the necessary regulatory framework for bidirectional charging. Here a position paper was made by the initiative in 2022 to provide clear recommendations on how to promote bidirectional charging (Nymoen et.al, 2022). An interesting conclusion from the initiative, is that vehicle-to-home (V2H) will most likely be introduced faster than vehicle-to-grid (V2G) as there are less regulatory barriers when introducing bidirectional charging ‘behind-the-meter’ at your home (ibid; Besserladen, 2022).
In Denmark the Danish trade association ‘Dansk e-Mobilitet’ have recently stated that the V2G is nearing a breakthrough, as several car manufacturers have announced that bidirectional charging (V2G) of e-vehicles is the future and that their newer V2G ready car models are released by the end
44
of 2023 (Dansk e-Mobilitet, 2023). Especially V2H is highlighted as a contributor to covering a portion of a households regular electricity consumption during peak periods when electricity prices are at their highest and charge during the times when electricity prices are at their lowest (ibid).
An interesting demonstration project in Germany were concluded in 2022 between Honda R&D Europe and Next Kraftwerke which is one of Europe’s largest virtual power plants. Here a small fleet of six V2G ready Honda e’s along with their V2G ready charging station managed to provide system services for the German TSO, Amprion. This made Honda the first car manufacturer in Europe to receive a prequalification for providing frequency containment reserves (FCR) through a fleet of evehicles, thus being able to provide a first response to frequency disturbances on the electricity grid (Hill, 2022).
5.3.2. BARRIERS
As Stadtwerke Flensburg experienced at the start of the DG STORE project in 2020, their charging infrastructure and e-vehicle fleet was not V2G ready and therefore it would be too expensive to replace at the given time. A market overview conducted in the start of the project also showed that except for a few research projects, bidirectional charging was hardly being applied in Germany. This was partly due to insufficient availability of V2G ready e-vehicles on the market, but also a lack of V2G infrastructure and the absence of legal and regulatory frameworks that would support V2G. This was also shown in the position paper of the German initiative in 2022 (Nymoen et.al, 2022). The availability of V2G ready e-vehicles and charging infrastructure are however increasing and is nearing a breakthrough (Dansk e-Mobilitet, 2023). But the V2G ready e-vehicles are dependent on V2G ready infrastructure which is an essential part of the solution. If there are no technical requirements for public charging infrastructure providers in establishing V2G ready infrastructure this could prove problematic for smart charging in the future (Besserladen, 2022).
Another barrier to consider will be the tariffs and levies on the electricity put back into the grid from V2G e-vehicles. This can prove a major barrier considering the business case to promote V2G evehicles and system services. Here V2H could potentially prove easier to implement as some regulation/tariffs could be avoided when discharging your e-vehicle ‘behind-the-meter’ (ibid ).
5.3.3. POLICY RECOMMENDATIONS
With the increased interest in V2G from car manufacturers and a political push for more e-vehicles and charging infrastructure, regulation must be considered in this area to standardize future V2G evehicles and charging infrastructure but also promote smart charging considering that the number of e-vehicles are expected to increase tenfold within the next seven years. This will otherwise most likely put an unnecessary strain on the electricity grid in the future if all future e-vehicles and charging infrastructure revolves around dump charging. The position paper by the initiative for bidirectional charging in Germany provided some clear recommendations on how to promote bidirectional
45
charging in Germany. One key point from the initiative, was that the current push for charging infrastructure by the EU, through stricter requirements in the building sector should also encompass V2G ready charging infrastructure. Currently the regulation simply promotes that certain buildings under construction and renovation shall prepare parking spaces for future charging infrastructure among other things, and that this charging infrastructure should ideally be for bidirectional charging, however it is not a requirement. Here the initiative requires more legal certainty for the proper design of future markets when it comes to bidirectional charging, and it should therefore be a standard for future charging infrastructure to be V2G ready. (Nymoen et.al, 2022).
The Danish TSO, Energinet, together with Denmark’s green business organization, Green Power Denmark, are already looking at what regulation must be changed to better introduce V2G e-vehicles into the electricity grid without “polluting” the grid altogether. Here certain requirements will have to be meet for V2G batteries to supply power to the electricity grid at the right voltage and frequency. Thus, these changes could make V2G batteries equate to actual power production plants to supply electricity back on the grid, here meeting the ‘Requirements for Generators’ (RfG) by the EU-standard level. This RfG regulation is currently addressed for wind and solar production plants among other technologies but could by the end of 2023 also involve V2G batteries in Denmark. (Dansk e-Mobilitet, 2023).
46
6. CONCLUSION
Detailed numerical results of the techno economic modelling work will be published in a scientific journal article after some further refinement and review
Some key qualitative results to take away from the modelling work in the DG STORE project is that the largest potential for indirect storage lies in the very large potential for heat storage based on electrical heating (power-to-heat) These potentials can be roughly divided into central heat storagebased installations connected to district heating grids, like in the case of Flensburg, and decentral heat storage connected to single heat pumps supplying single one- or multi-family houses in rural areas not connected to heating grids. To promote these power-to-heat technologies such as heat pumps and electrode boilers, electricity tariffs/levies must be lessened or abolished as seen with the EEG levy in Germany but also connected storage solutions are essential to increase the business case of the power-to-heat solutions. As more residential buildings are expected to transition to individual heat pumps in the coming years, a standard for ‘Smart Grid Readiness’ must be a requirement to receive federal subsidies in Denmark as it is the case in Germany. This will help promote a future market for aggregation of heat pumps and significantly reduce connection costs which is one of the main costs associated with operating a pool of heat pumps.
Depending on the market diffusion speed of e-vehicles for private transport the time shifting potential of the charging processes for private e-cars will be substantial by 2035. While this potential is still comparatively small compared to the indirect storage of surplus energy in heating, it will be increasing considerably over time. As in the case of power-to-heat it will be crucial that the time and level of charging will be available for a centralised dispatch in order to be coordinated with the vastly fluctuating residual load on the electricity grid. Here the willingness of private car owners to give access to their car batteries for system services is crucial. Furthermore, a standardization and regulation of V2G e-vehicles as well as V2G charging infrastructure is needed to sustain the expected increase of e-vehicles by 2030.
Overproduction from wind energy in Denmark and northern Germany will become main drivers for the need to increase transmission capacities, direct and indirect storage, demand side management and all forms of power-to-X conversion processes. It can be foreseen that there will be a competitive situation between further increases in transmission capacities and local direct and indirect storage, demand side management and power-to-X activities.
47
7. REFERENCES
Altinget (2022):
Kan Jørgensen allerede nu se en opbremsning i salg af vindmøller på land på grund af udligningsordningen?. Accessed: June 26th, 2023. Available at: https://www.altinget.dk/klima/ministersvar/80903
Andel (2020):
Andel og IBM fjerner barriere for grøn omstilling Accessed: June 26th, 2023. Available at: https://andel.dk/aktuelt/andel-og-ibm-fjerner-barriere-for-groen-omstilling/
Besserladen (2022):
Deutschland 2022 – weit entfernt vom bidirektionalen Laden Accessed: June 26th, 2023. Available at: https://besserladen.de/deutschland-2022-weit-entfernt-vom-bidirektionalen-laden/
BMWi (Federal Ministry for Economic Affairs and Energy) (2020):
The National Hydrogen Strategy. Accessed: Jan. 18th, 2023. Available at: https://www.bmwk.de/Redaktion/EN/Publikationen/Energie/the-national-hydrogenstrategy.pdf?__blob=publicationFile&v=6
BMWK (Bundesministerium für Wirtschaft und Klimaschutz) (2022):
Eröffnungsbilanz Klimaschutz Accessed: Feb. 24th, 2023. Available: https://www.bmwk.de/Redaktion/DE/Downloads/Energie/220111_eroeffnungsbilanz_klimaschutz.pdf?_ _blob=publicationFile&v=22
BMWK (Bundesministerium für Wirtschaft und Klimaschutz) (2022a): Klimaschutzplan 2050. Klimapolitische Grundsätze und Ziele der Bundesregierung Accessed: Feb. 24th , 2023. Available at: https://www.bmwk.de/Redaktion/DE/Publikationen/Industrie/klimaschutzplan2050.pdf?__blob=publicationFile&v=6
Bräuner, L.K., (2022):
The Danish Power Market Characteristics & Future of Flexibility Markets. Presentation at webinar Accessed: Jan. 17th, 2023. Available at: https://dg-store.eu/webinar-power-markets-regulation-onflexibility/
Bundesnetzagentur für Elektrizität, Gas, Telekommunikation, Post und Eisenbahn (2020):
Genehmigung des Szenariorahmens 2021-2035. 26.6.2020 Accessed: Feb. 24th, 2023. Available at: https://www.netzentwicklungsplan.de/sites/default/files/paragraphsfiles/Szenariorahmen_2035_Genehmigung_1.pdf
Dansk e-Mobilitet (2022):
På rette spor mod én million elbiler i 2030. Accessed: June 26th, 2023. Available at: https://danskemobilitet.dk/nyheder/paa-rette-spor-mod-million-elbiler-2030
Dansk e-Mobilitet (2023):
Elbiler med tovejsopladning bliver en gevinst for elnettet Accessed: June 26th, 2023. Available at: https://danskemobilitet.dk/nyheder/elbiler-med-tovejsopladning-bliver-gevinst-elnettet
Danish Energy Agency (n.d.):
Technology Data - Renewable fuels Version 9. Accessed: April 19th, 2023. Available at: https://ens.dk/sites/ens.dk/files/Analyser/version_09_-_technology_data_for_renewable_fuels.pdf
48
Danish Energy Agency & EnergiNet (2018):
Model Analysis of Flexibility of the Danish Power System Accessed: March 6th, 2023. Available at:https://ens.dk/sites/ens.dk/files/Globalcooperation/Publications_reports_papers/model_analysis_of_f lexibility_of_the_danish_power_system.2018.05.15.pdf
Danish Energy Agency (2022):
Denmark's Climate Status and Outlook 2022. Accessed: June 26th, 2023. Available at: https://ens.dk/sites/ens.dk/files/Forskning_og_udvikling/cso22__english_translation_of_kf22_hovedrapport.pdf
Danmarks Statistik (2023):
Bestanden af elbiler steg med 69 pct. i 2022. Accessed: June 26th, 2023. Available at: https://www.dst.dk/da/Statistik/nyheder-analyserpubl/nyt/NytHtml?cid=40083#:~:text=Antallet%20af%20elbiler%20ved%20%C3%A5rsskiftet,i%202022% 20mod%2035%20pct
Dansk Fjernvarme (2022):
Fremtiden for specialregulering er usikker Accessed: Jan. 18th, 2023. Available at: https://www.danskfjernvarme.dk/aktuelt/nyheder/arkiv/2022/220210-fremtiden-for-specialreguleringer-usikker
Dansk Fjernvarme (2021):
Regulerkraftmarkedet forandrer sig i 2022 Accessed: Jan. 18th, 2023. Available at: https://www.danskfjernvarme.dk/aktuelt/nyheder/arkiv/2021/211214-regulerkraftmarkedet-forandrersig-i-2022
Ea Energianalyse & PlanEnergi (2021):
Ny varmeproduktion til fjernvarmesystemet i Nakskov - SCREENING AF TEKNOLOGIER TIL FJERNVARMEPRODUKTION. Accesse: May 1st, 2023. Available at: https://www.eaenergianalyse.dk/en/cases/an-analysis-of-new-supply-for-the-district-heating-system-in-nakskov/ or by contacting DG STORE https://dg-store.eu/about/
Energiwatch (2021):
Kritikerne tav da Energinet designede specialreguleringens arvtager. Accessed: April 19th, 2023. Available at: https://energiwatch.dk/Energinyt/Renewables/article12916607.ece
Energinet (2022):
PRÆKVALIFIKATION AF ANLÆG OG AGGREGEREDE PORTEFØLJER Accessed: June 26th, 2023. Available at: https://energinet.dk/media/kd5iw2bf/prkvalifikation-af-anlg-og-aggregerede-portefljer.pdf
Energinet (2023):
ÅRLIG STATISTIK FOR RESERVER 2022 Accessed: June 26th, 2023. Available at: https://energinet.dk/media/bytliz2p/%C3%A5rlig-statistik-for-reserver-2022.pdf
Energistyrelsen (n.d.):
PSO-tariffen. Accessed: June 21st , 2023: Available at: https://ens.dk/service/statistik-data-noegletal-ogkort/pso-tariffen
Energistyrelsen (2021):
49
Analyse af geografisk differentierede forbrugstariffer og direkte linjer Accessed: June 21st, 2023. Available at:
https://ens.dk/sites/ens.dk/files/El/analyse_af_geografisk_differentierede_forbrugstariffer_og_direkte_li njer.pdf
Energistyrelsen (2021a):
Markedsmodel 3.0: Baggrundsnotat om aggregatorer Accessed: June 26th , 2023. Available at: https://ens.dk/sites/ens.dk/files/El/mm_3.0_baggrundsnotat_om_aggregatorer.pdf
Energistyrelsen (2022):
Drejebog - Fossilfri spidslast i fjernvarmesystemet Accessed: May 2nd, 2023. Available at: https://ens.dk/sites/ens.dk/files/Varme/drejebog_2022_endelig_v1.1.pdf
Energistyrelsen (2023):
Analyseforudsætninger til Energinet 2022 (AF22). Accessed: Feb 24th, 2023. Available at:
https://ens.dk/service/fremskrivninger-analyser-modeller/analyseforudsaetninger-til-energinet
Energistyrelsen (2023a):
AF22 – offentligt_dataset - endeligt Accessed: Feb. 24th, 2023. Available at: https://ens.dk/service/fremskrivninger-analyser-modeller/analyseforudsaetninger-til-energinet
Energistyrelsen (2023b):
Analyseforudsætninger til Energinet 2022 – Forbrug i husholdninger og erhverv Accessed: June 26th , 2023. Available at: https://ens.dk/sites/ens.dk/files/Hoeringer/af22_-_baggrundsnotat__forbrug_i_husholdninger_og_erhverv.pdf
ENTSO-E (2021):
TYNDP 2020 (Ten Year Network Development Report). Main Report. Final Version after ACER opinion. Accessed: Feb. 24th, 2023. Available at: https://eepublicdownloads.blob.core.windows.net/public-cdncontainer/tyndp-documents/TYNDP2020/FINAL/entso-e_TYNDP2020_Main_Report_2108.pdf
ESA (Energy Storage Association) (n.d.):
How Hydrogen Energy Storage Works. Accessed: Jan. 18th, 2023. Available at: https://energystorage.org/why-energy-storage/technologies/hydrogen-energy-storage/
European Commission (2023):
Over one million purely electric cars now on German roads. Accessed: June 26th, 2023. Available at: https://alternative-fuels-observatory.ec.europa.eu/general-information/news/over-one-million-purelyelectric-cars-now-german-roads
European Council (2023):
Infographic - Energy price rise since 2021 Accessed: May 31st, 2023 Available at: https://www.consilium.europa.eu/en/infographics/energy-prices-2021/
Eurostat (2023):
Cooling and heating degree days by NUTS 3 regions - monthly data [NRG_CHDDR2_M__custom_5826634]. Accessed: April 18th, 2023. Available at: https://ec.europa.eu/eurostat/databrowser/view/NRG_CHDDR2_M__custom_5826634/default/table?la ng=en
Forsyningstilsynet (2022):
Consultation response on Energinet's methodology for procurement of countertrade energy - reference 21/01999. Accessed: April 19th, 2023. Available at : https://forsyningstilsynet.dk/media/10911/bilag-11-
50
consultation-response-on-energinet-s-methodology-for-procurement-of-countertrade-energy-reference21_01999.pdf
Green Power Denmark (2023): Tilslutningsbidrag for produktion Accessed: June 26th, 2023. Available at: https://greenpowerdenmark.dk/vejledning-teknik/nettariffer-priser-gebyrer/tilslutningsbidragproduktion
Greneaa, Daniel H., & Rodkjær, Nikolaj K. (2022): Din elregning eksploderer: Her er forklaringen på de tårnhøje elpriser. Accessed: May 31st , 2023. Available at: https://www.tjekdet.dk/indsigt/her-er-forklaringen-paa-de-taarnhoeje-elpriser
gridX (n.d.):
SG Ready Accessed: June 26th, 2023. Available at: https://www.gridx.ai/knowledge/sg-ready
Gröbel, Annegret (2017):
Integrating renewables in the grid and the market: Insights from the German Energiewende and lessons learnt. Presentation held on September 25th, 2017. Bundesnetzagentur. Accessed: March 6th, 2023
Available at:
https://www.renac.de/fileadmin/renac/media/Projects/Energy_Dialogue/2017_September/02_Integrati ng_renewables_in_the_grid_and_the_market_Annegret_Groebel.pdf
Heitkötter, W , Schyska, B.U., Schmidt, D., Medjroubi, W., Vogt, T., & Agert, C. (2021):
Assessment of the regionalised demand response potential in Germany using an open source tool and dataset. In: Advances in Applied Energy 1(2021), 100001. Accessed: March 6th, 2023. Available at: https://doi.org/10.1016/j.adapen.2020.100001
Hill, J.S. (2022):
Honda EVs to serve as virtual power plant in Germany. Accessed: June 26th, 2023. Available at: https://thedriven.io/2022/11/21/honda-evs-to-serve-as-virtual-power-plant-in-germany/
Hohmeyer, O et al. (2011)
Integriertes Klimaschutzkonzept Flensburg. Der Kurs zur CO2-Neutralität 2050. Gutachten erstellt im Auftrag der Stadt Flensburg Zentrum für nachhaltige Energiesystme (ZNES). Diskussionsbeiträge 2
Hohmeyer, O (2021):
Energy System Analysis and Simulation – Short work status report. Presentation at an internal status meeting November 30th, 2021
Hohmeyer, O. & Palm, I-M., (2020):
STATUS QUO REPORT - DG STORE. Accessed: Jan. 17th, 2023. Available at: https://dg-store.eu/wpcontent/uploads/2021/01/StatusQuo_report_DGSTORE_dk_web.pdf
Home A/S (2023):
Rekordstigning i nye varmepumper In Ritzau. Accessed: June 26th, 2023. Available at: https://via.ritzau.dk/pressemeddelelse/rekordstigning-i-nyevarmepumper?publisherId=5394039&releaseId=13679455
IEA (2022):
51
World Energy Outlook 2022 shows the global energy crisis can be a historic turning point towards a cleaner and more secure future. Accessed: Jan. 17th, 2023. Available at: https://www.iea.org/news/world-energy-outlook-2022-shows-the-global-energy-crisis-can-be-a-historicturning-point-towards-a-cleaner-and-more-secure-future
KEFM (2023):
Tariffer på elområdet In Klima-, Energi- og Forsyningsudvalget 2022-23, (2nd meeting), attachement 268 Accessed: June 21st, 2023. Available at: https://www.ft.dk/samling/20222/almdel/KEF/bilag/268/2699803/index.htm
Kleinhans, David (2014):
Towards a systematic characterization of the potential of demand side management. In: arXiv Physics and Society. 8.1.2014. Accessed: Feb. 24th, 2023. Available at: https://arxiv.org/pdf/1401.4121.pdf
Lpb (Landeszentrale für politische Bildung Baden-Würtemberg) (2023):
Klimaschutz in Deutschland. Accessed: Feb. 24th, 2023. Available at: https://www.lpb-bw.de/klimaschutzdeutschland
Maruf, Md. Nasimul Islam (2019):
Sector coupling in the North Sea region – A review on the energy system modelling perspective In: Energies 2019, 12, 4298, p. 1-35. Accessed: Feb. 24th, 2023. Available at: https://doi.org/10.3390/en12224298
Maruf, Md. Nasimul Islam (2021):
Open model-based analysis of 100% renewable and sector-coupled energy system. The case of Germany in 2050. In: Applied Energy 288(2021) 116618. Accessed: Feb. 24th, 2023. Available at: https://doi.org/10.1016/j.apenergy.2021.116618
Maruf, Md. Nasimul Islam (2021a):
A novel method for analyzing highly renewable and sector-coupled subnational energy systems – Case study of Schleswig-Holstein. In: Sustainability 2021, 13, 3852. Accessed: Feb. 24th, 2023. Available at: https://doi.org/10.3390/su13073852
NDR (Norddeutscher Rundfunk) (2022):
Mehrheit im Rat: Stadtwerke Flensburg werden bis 2035 klimaneutral 2.12.2022. Accessed: Feb. 28th , 2023. Available at: https://www.ndr.de/nachrichten/schleswig-holstein/Mehrheit-im-Rat-StadtwerkeFlensburg-werden-bis-2035-klimaneutral,stadtwerke180.html
Neogrid Technologies (2023):
DG STORE status case 5. Presentation at an internal status meeting held on Jan 26th, 2023.
Neupane, B., Siksnys, L., Pedersen, T. B., Jensen, R. H., Aftab, M., Eck, B., Fusco, F., Gormally, R., Purcell, M., Tirupathi, S., Cerne, G., Brus, S., Papageorgiou, I., Meindl, G., & Roduit, P. (2022):
GOFLEX: extracting, aggregating and trading flexibility based on FlexOffers for 500+ prosumers in 3 European cities [operational systems paper]. In e-Energy 2022 - Proceedings of the 2022 13th ACM International Conference on Future. Energy Systems (pp. 361–373). Association for Computing Machinery. Accessed: June 26th, 2023. Available at: https://doi.org/10.1145/3538637.3538865
Nymoen, H., Kimpel, T., & Kaschade, C. (2022):
Initiative „Bidirektionales Laden“ Positionspapier zu notwendigen regulatorischen Anpassungen im Kontext des bidirektionalen Ladens. Accessed: June 26th, 2023. Available at: https://ceco.de/user/pages/downloads/14.bidirektionales-laden-von-eautos-als-schlussel-zur-
52
flexibilisierung-desenergiesystems/Initiative%20Bidirektionales%20Laden%20Positionspapier%20M%C3%A4rz%202022.pdf
Plesner (2023):
Nyt lovforslag vil sikre rammerne for øget indpasning af vedvarende energi Accessed: June 21st , 2023
Available at: https://www.plesner.com/da-dk/insights/artikler/2023/03/nyt-lovforslag-vil-sikrerammerne-for-oget-indpasning-af-vedvarende-energi
Renewables ninja (2023):
Wind. Monthly capacity factors for southern Lolland Accessed: April 18th, 2023. Available at https://www.renewables.ninja
Ritzau (2022):
Ny regering vil gøre Danmark klimaneutral allerede i 2045. Accessed: April 19th, 2023. Available at: https://www.energysupply.dk/article/view/886836/ny_regering_vil_gore_danmark_klimaneutral_allerede_i_2045
Ritzau (2023):
Energistyrelsen offentliggør Analyseforudsætninger til Energinet 2022. Accessed: April 19th, 2023. Available at: https://via.ritzau.dk/pressemeddelelse/energistyrelsen-offentliggor-analyseforudsaetningertil-energinet-2022?publisherId=13560344&releaseId=13668067
Salling Group (2022):
Salling Group kobler 500 Netto-butikker på Flex Platformen Accessed: June 26th, 2023. Available at: https://via.ritzau.dk/pressemeddelelse/salling-group-kobler-500-netto-butikker-pa-flexplatformen?publisherId=3307957&releaseId=13663557
SBV (Selbsthilfe-Bauverein eG) (2021):
SBV - Selbsthilfe-Bauverein eG – Mitgliederbefragung 2021 Presentation at an internal DG STORE partner meeting in Flensburg Sept 29th, 2021.
Skaaning, Jakob (2022):
Elprisen er ramt af uheld af bibelske dimensioner. Men Putin er (stadig) det største uheld. Accessed: May 31st , 2023. Available at: https://www.zetland.dk/historie/s8yyJ9Gl-aO0E1wr0-346b1
Stadtwerke Flensburg (2021): Electric Boiler SWFL – Study Trip DG STORE 29./30.09.2021 Presentation at an internal DG STORE study trip in Flensburg Sept 29th, 2021.
Stadtwerke Flensburg (2023):
Grüne Transformation – So werden die Stadtwerke klimaneutral Accessed: Feb. 28th, 2023. Available at: https://www.stadtwerke-flensburg.de/foerdepost/blog/gruene-transformation
Stadtwerke Flensburg (2023a):
Stadtwerke Flensburg investieren mittleren dreistelligen Millionenbetrag in Zukunft der Region. Accessed: Feb. 28th, 2023. Available at: https://www.stadtwerke-flensburg.de/foerdepost/presse/wir-investierenin-zukunft-der-region
Stadtwerke Flensburg (2023b):
Unsere Leitungsnetze aus technischer Sicht Accessed: Feb. 28th, 2023. Available at: https://www.stadtwerke-flensburg.de/foerdepost/blog/unsere-leitungsnetze-aus-technischer-sicht
53
Steurer, Martin (2016):
Analyse von Demand Side Integration im Hinblick auf eine effiziente und umweltfreundliche Energieversorgung PhD Thesis. Universität Stuttgart. Accessed: Feb. 28th, 2023. Available at: https://dnb.info/1137206748/34
Stiftung Umweltenergierecht (2022):
Synopse zur Novelle des Enereuerbare-Energien-Gesetz (Gegenüberstellung EEG 2023 und EEG 2021).
Accessed: Feb. 24th, 2023. Available at: https://stiftung-umweltenergierecht.de/synopse_eeg-novelle2023/
The Federal Government (2022):
Renewables levy abolished - Relief for electricity consumers. Accessed: May. 2nd, 2023. Available at: https://www.bundesregierung.de/breg-en/federal-government/renewable-energy-sources-act-levyabolished-2011854
Wehrmann, Benjamin (2022)
Northern states call for splitting German power price zone based on renewables capacity. In Clean Energy Wire. Accessed: June 21st, 2023. Available at: https://www.cleanenergywire.org/news/northern-statescall-splitting-german-power-price-zone-based-renewables-capacity
Die Zeit (2022):
Bundestag verlängert Laufzeit der letzten deutschen Atomkraftwerke Accessed: Feb. 28th, 2023. Available at: https://www.zeit.de/politik/deutschland/2022-11/bundestag-atomkraftwerke-laufzeitverlaengerung?utm_referrer=https%3A%2F%2Fwww.google.de%2F
Zhang, L., Tang, Y., Zhou, T., Tang, C., Liang, H., & Zhang, J. (2022):
Research on flexible smart home appliance load participating in demand side response based on power direct control technology. In Energy Reports, Volume 9, Supplement 4, 2022, pages 424-434. ISSN 23524847. Accessed: Feb. 28th, 2023. Available at: https://doi.org/10.1016/j.egyr.2022.01.219
Øyen (2022):
Danskernes strøm blev mere sort i 2021 Accessed: May 31st, 2023. Available at: https://www.altinget.dk/artikel/danskernes-stroem-blev-mere-sort-i-2021
54
