1. Introduction
1.1 Name of project and execution period
Mining electric-bike-user behaviours from smartphone data, with bike-longer (20-70-0975).
The execution of the project was planned between September 2020 and February 2021. Because of COVID-19 restrictions, it was shifted and took place between November 2020 and April 2021.
1.2 Project key findings
The project comprises two phases. The first phase consists of the design, development and deployment of a smartphone sensing platform; the second phase of Global Positioning System (GPS) data collection, from smartphones, and development of mode detection algorithms supporting the study of long-distance bicycling, which specializes in discriminating between GPS trajectories generated by bikes, electric bikes and electric scooters.
Most transport modes can show similar patterns (signal) from the GPS sensor perspective in the urban context. This is mainly because mobility characteristics, such as speed patterns, are similar due to the urban form. Evident GPS data noise and accuracy limitations contribute to the difficulty of the trajectory classification task. Furthermore, new disruptive transportation trends, such as e-bike, e-scooter sharing services, generate new feature patterns within the trajectories, which are not well studied yet. This new challenge presents itself while standardization problems are still emerging due to th e fast penetration of machine learning methods, which promise to substitute traditional statistical and rule-based approaches.
Our contribution is manifold. To improve methods' generalization power, we formulate a uniquely large dataset composed of all transport types, focusing on bikes, e-bikes, and e-scooters, including shared and owned vehicles across three continents. To improve classification methods' efficiency, we apply semisupervised artificial neural networks (ANN), and we reduce the need for both pre-processing steps and labelled data. Compared to multiple baseline methods, such as random forests, our results show that although the classification task remains very challenging, our method outperforms the baseline methods in most of the key performance indexes that measure the efficiency and suitability within the context of BigData, including emerging transport types.
2. Project execution
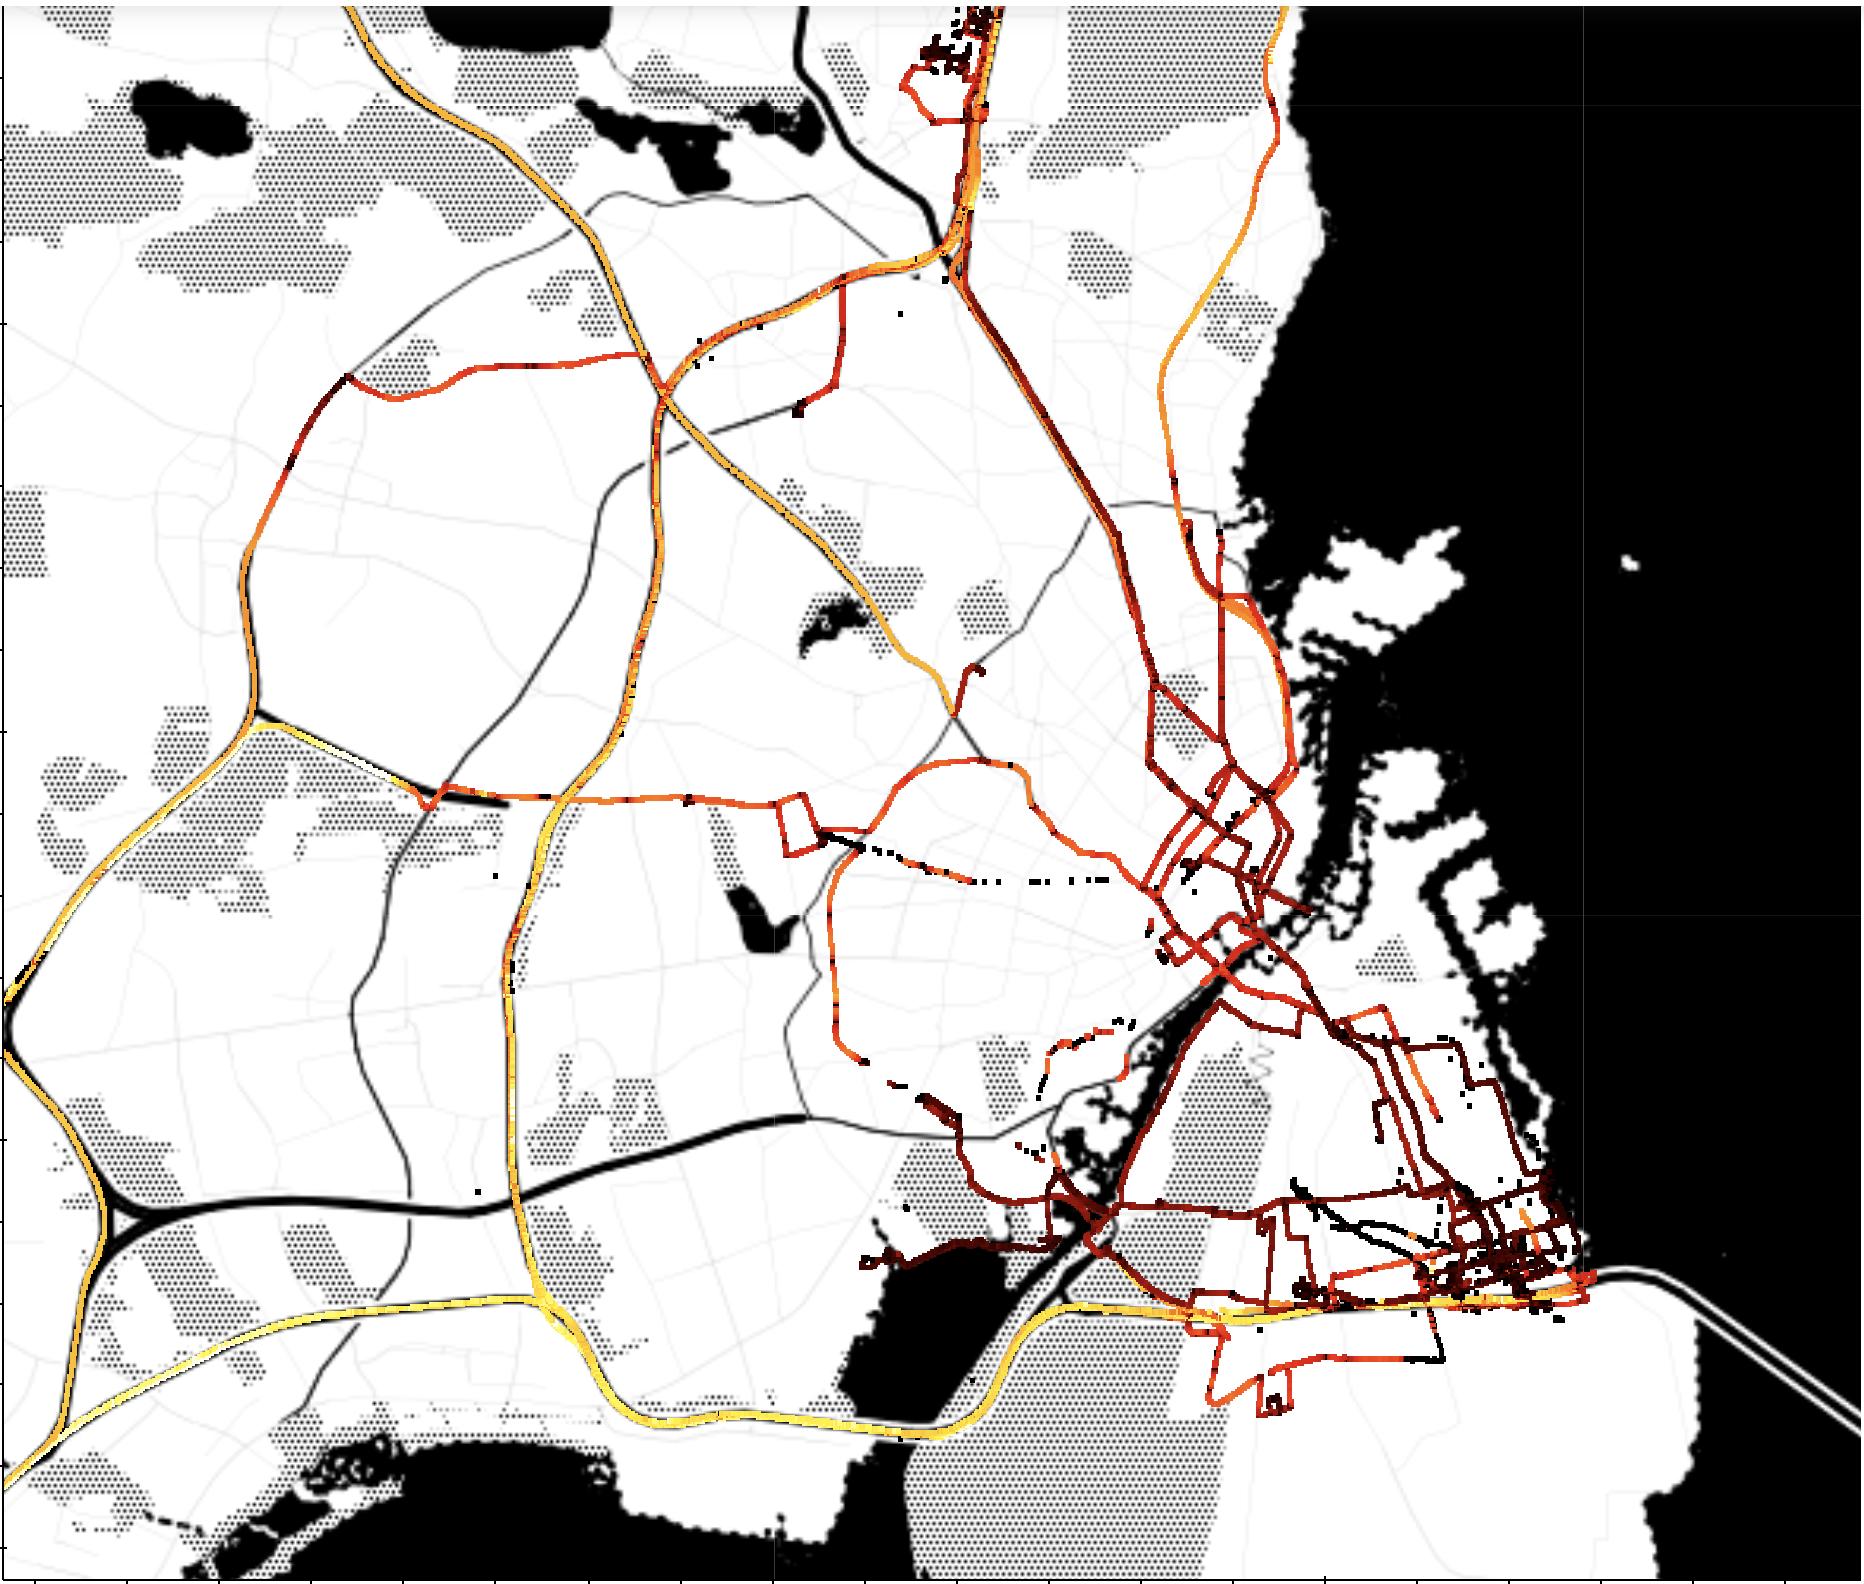
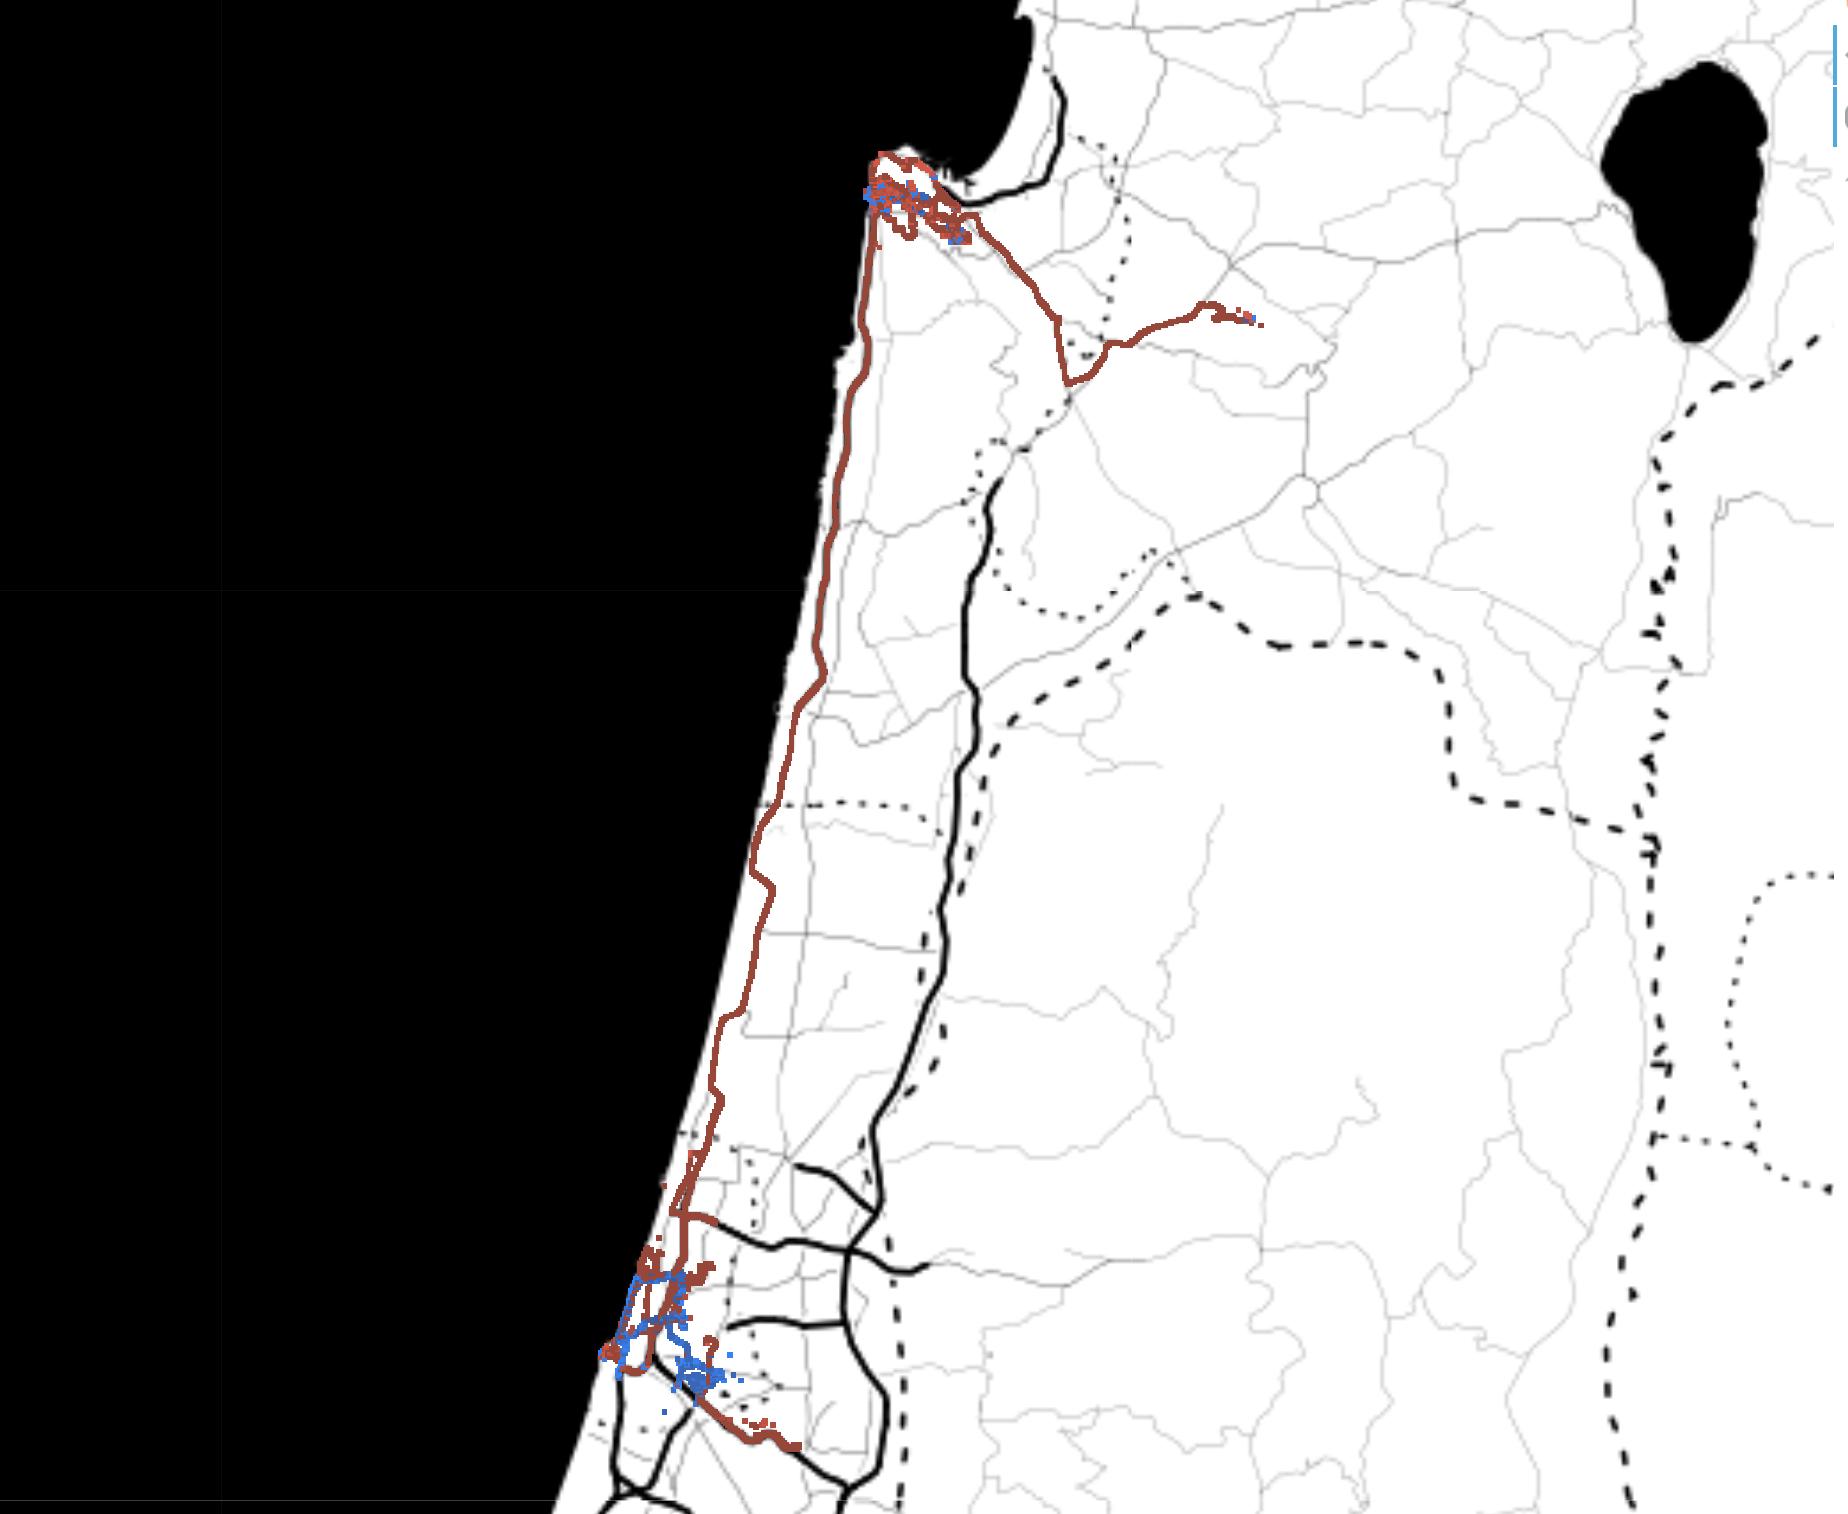
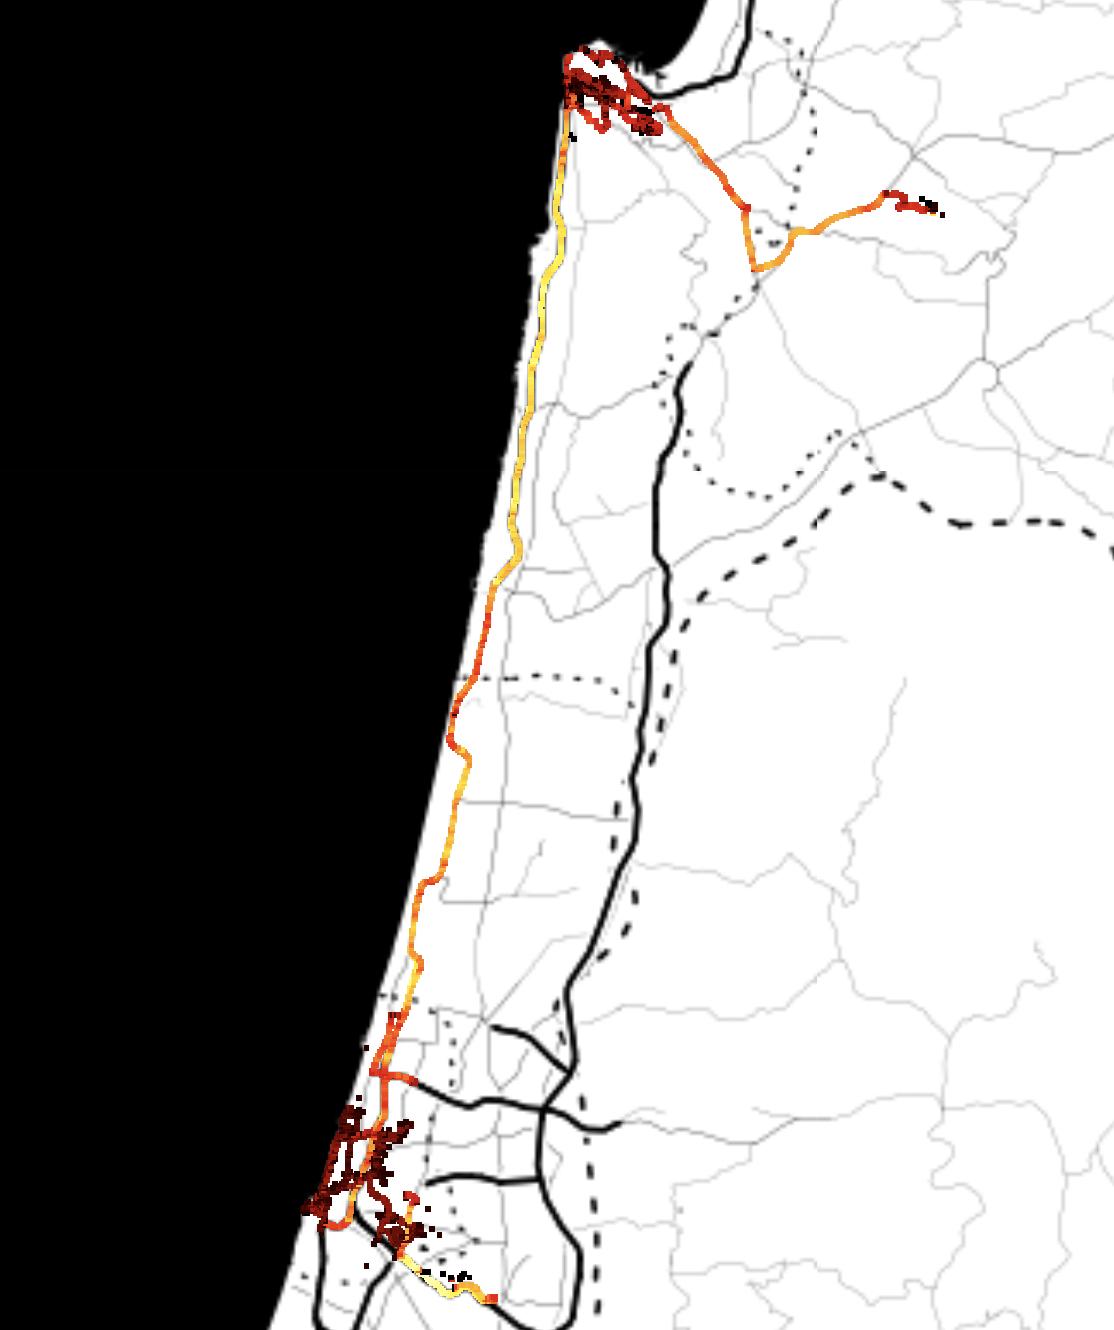
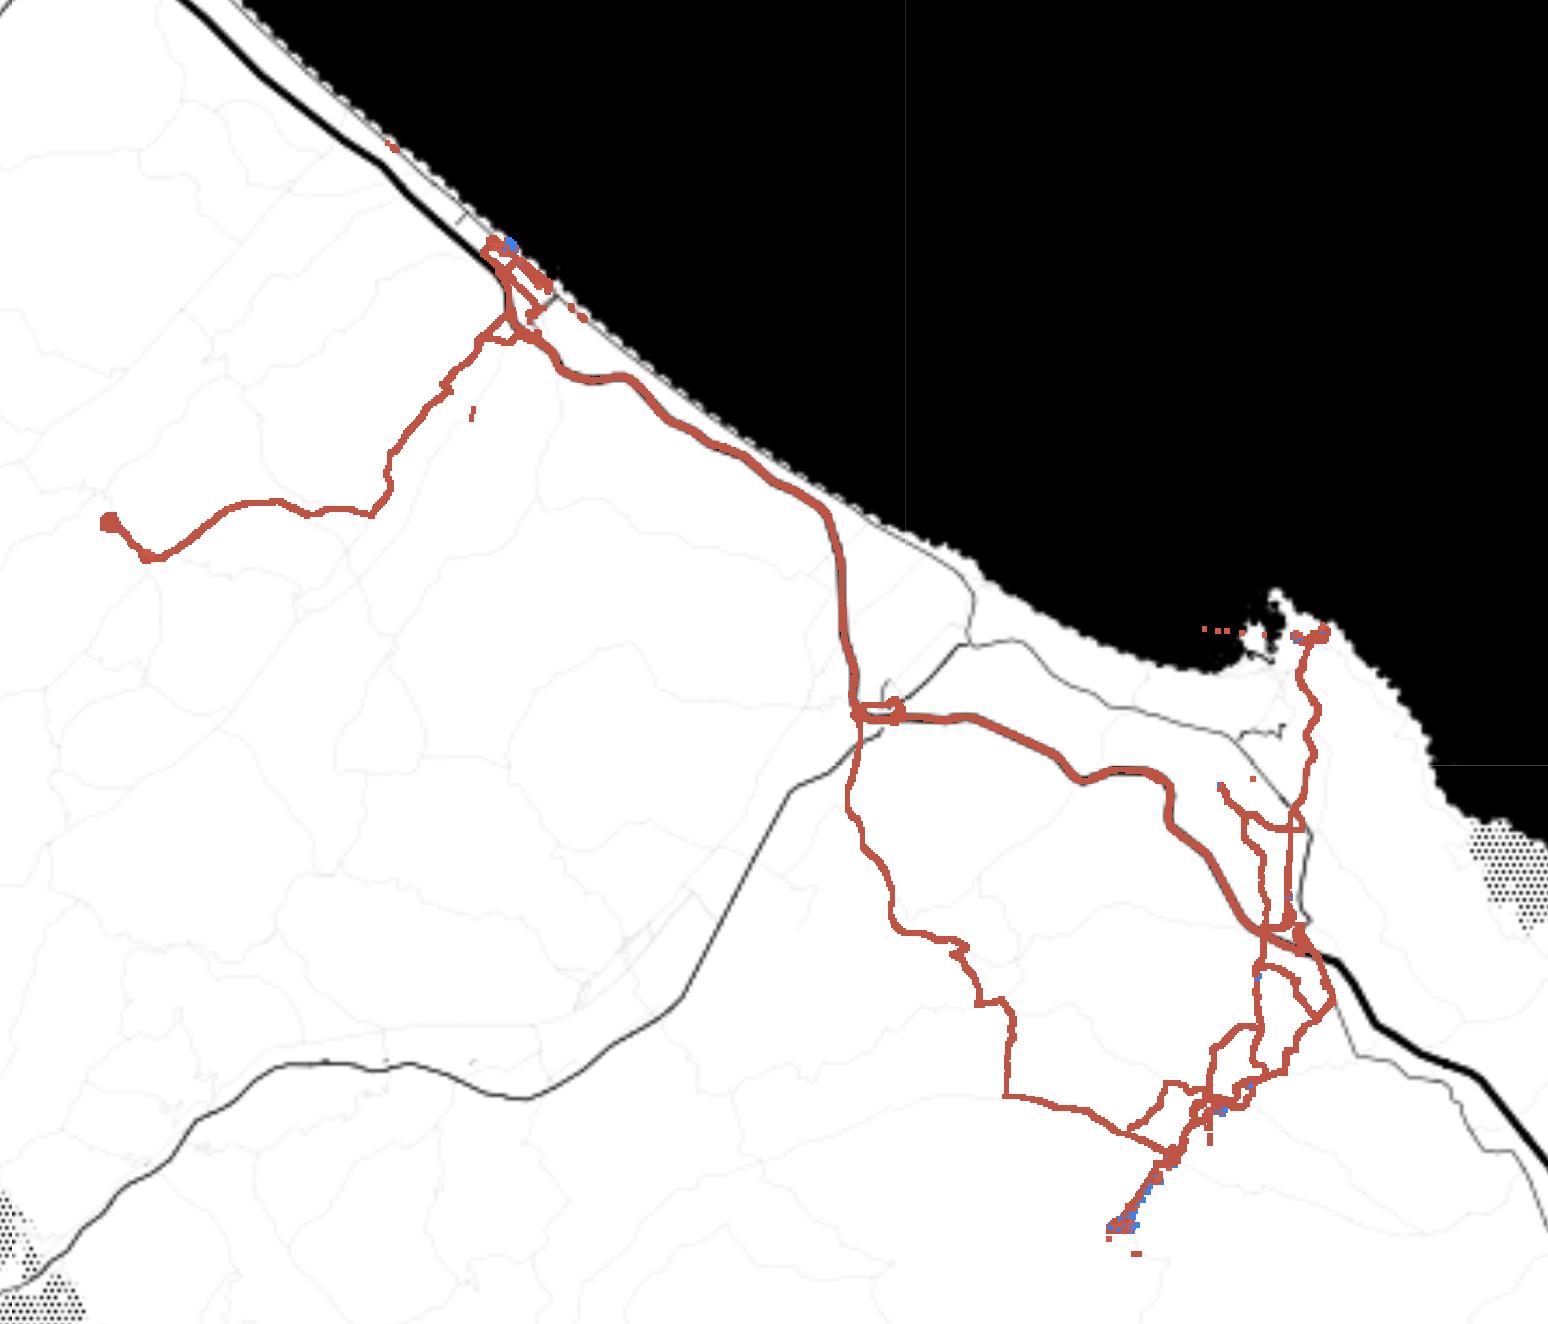
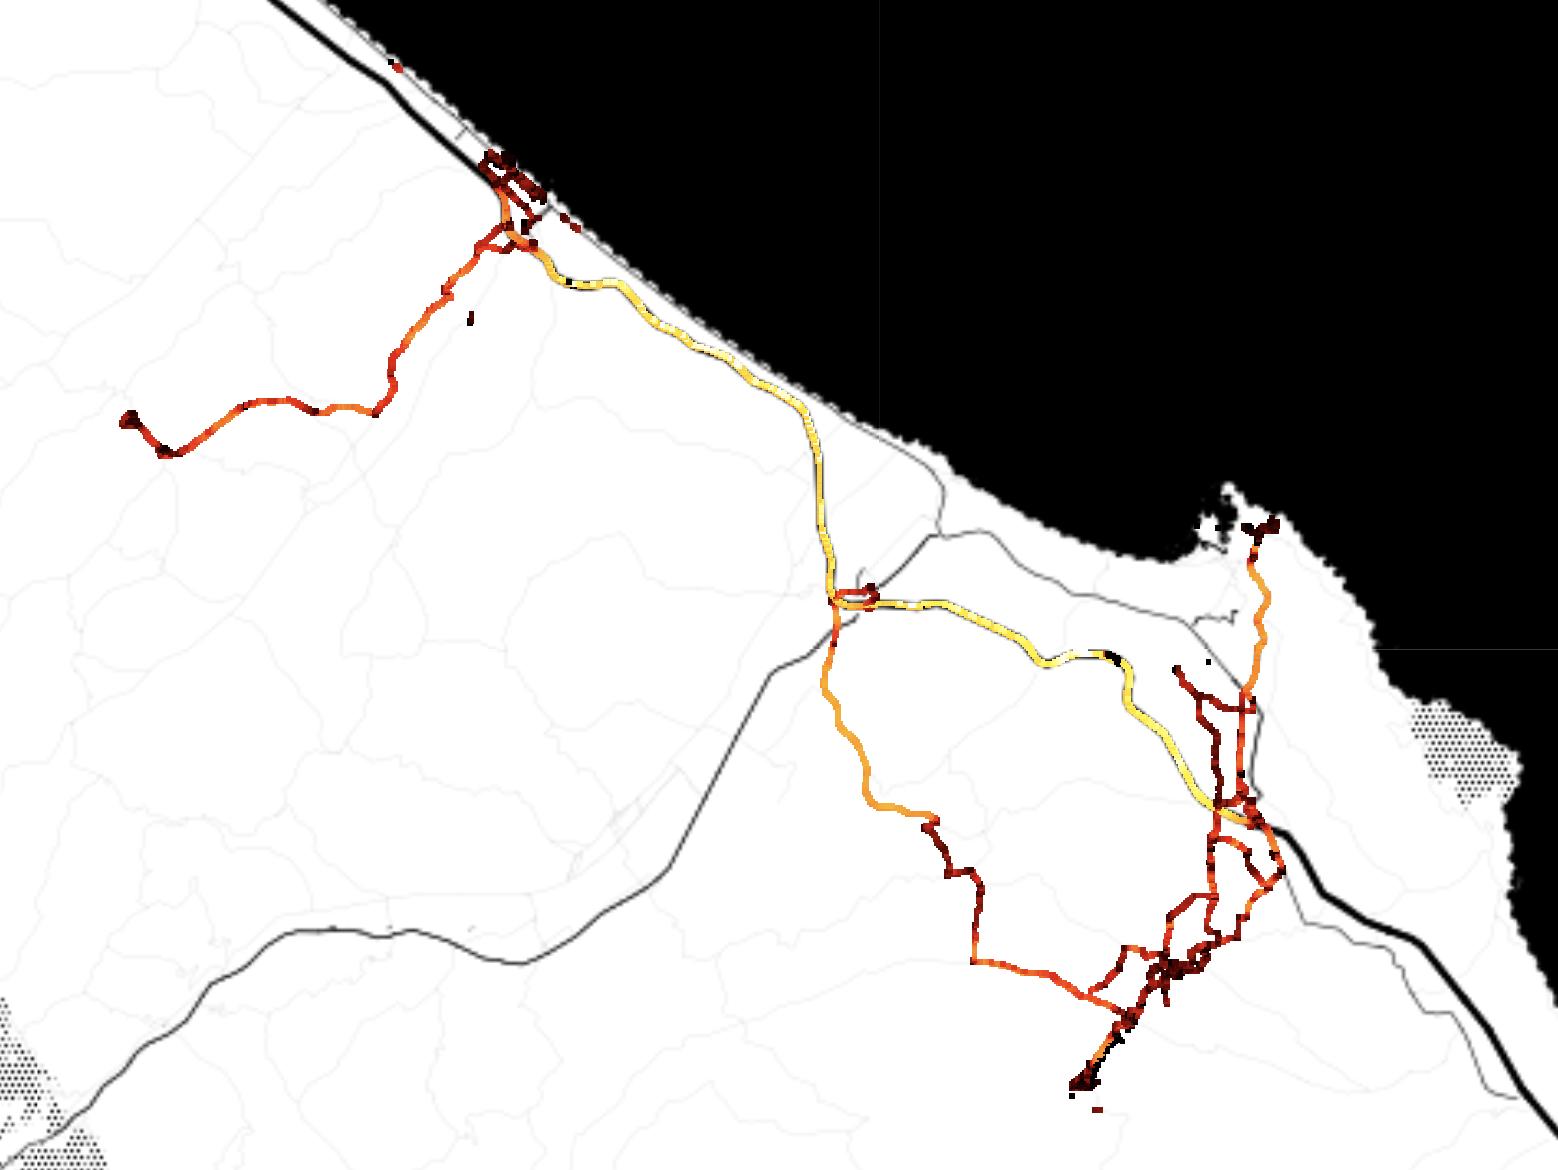
While the data sensing platform was successfully designed, implemented and deployed, in addition to difficulties due to COVID-19, a conflict between Hamas and Israel exploded in May 2021, and definitively undermined the possibility of yielding data from the platform developed and deployed in the main activities planned for this project. The risk of data collection failure was handled and mitigated beforehand by the composition of a novel and relevant dataset involving bikes, electric bikes and electric scooters. Data were collected both in Tel Aviv and Copenhagen. In the first case, data were collected by BIRD1 and focused on escooters. In the second case, data were collected by the Centre of Transport Analytics at the Technical University of Denmark, using TravelVu2. These dataset were then merged with other existing relevant dataset from S.Francisco and Beijing.
1 Bird.co at https://www.bird.co, retrieved from web May, 2021
2 TravelVu by Trivector at https://www.travelvu.app, retrieved from web May, 2021
2.1 Activities
This project provides a substantial data foundation and methodological processing protocols needed for the analysis of bicycle user behaviour and preferences with focus on e-bikes and long-distance bicycle trips. The execution of the project allowed the extension of machine learning algorithms suitable to improve the detection of users’ behavioural patterns, from smartphone data, with particular attention to bicycle patterns from GPS signal
To allow the study of bicycle use policy based on the understanding of bicycle users' priorities from the data they actually generate while riding, within this project DTU and Technion designed, developed and deployed an app able to record users’ mobility priorities in the urban space.
The bike-longer sensing platform can be categorized as a mobile software designed for crowdsourced usage, which relies on the willingness of users to contribute data. This report Appendixes document the activity carried out in this project according to the plan, such as: design, implementation, testing and pilot data collection.
During these activities, we addressed various technical issues, among others: define the technical architecture; decide a technology stack and define the development milestones. The sensing platform includes two integral parts: back-end/server technology, and the mobile app front-end.
The back-end/server technology includes the database and server-side objects that are necessary for supporting the functions embedded in the front-end. The mobile app front-end serves as the native mobile app our end-users (cyclists) will use, i.e., Apple iOS and Google Android. The front-end provides the interactive user experiences that - together with the back-end - manages data.
Although the sensing platform is fully functional and available for both Apple App Store and Google Play beta testing distribution platforms, adverse circumstances on world scale due to COVID-19, and on local scale due to a conflict exploded between Hamas and Israel, prevented the project from meeting the expectations regarding data collection via such a platform
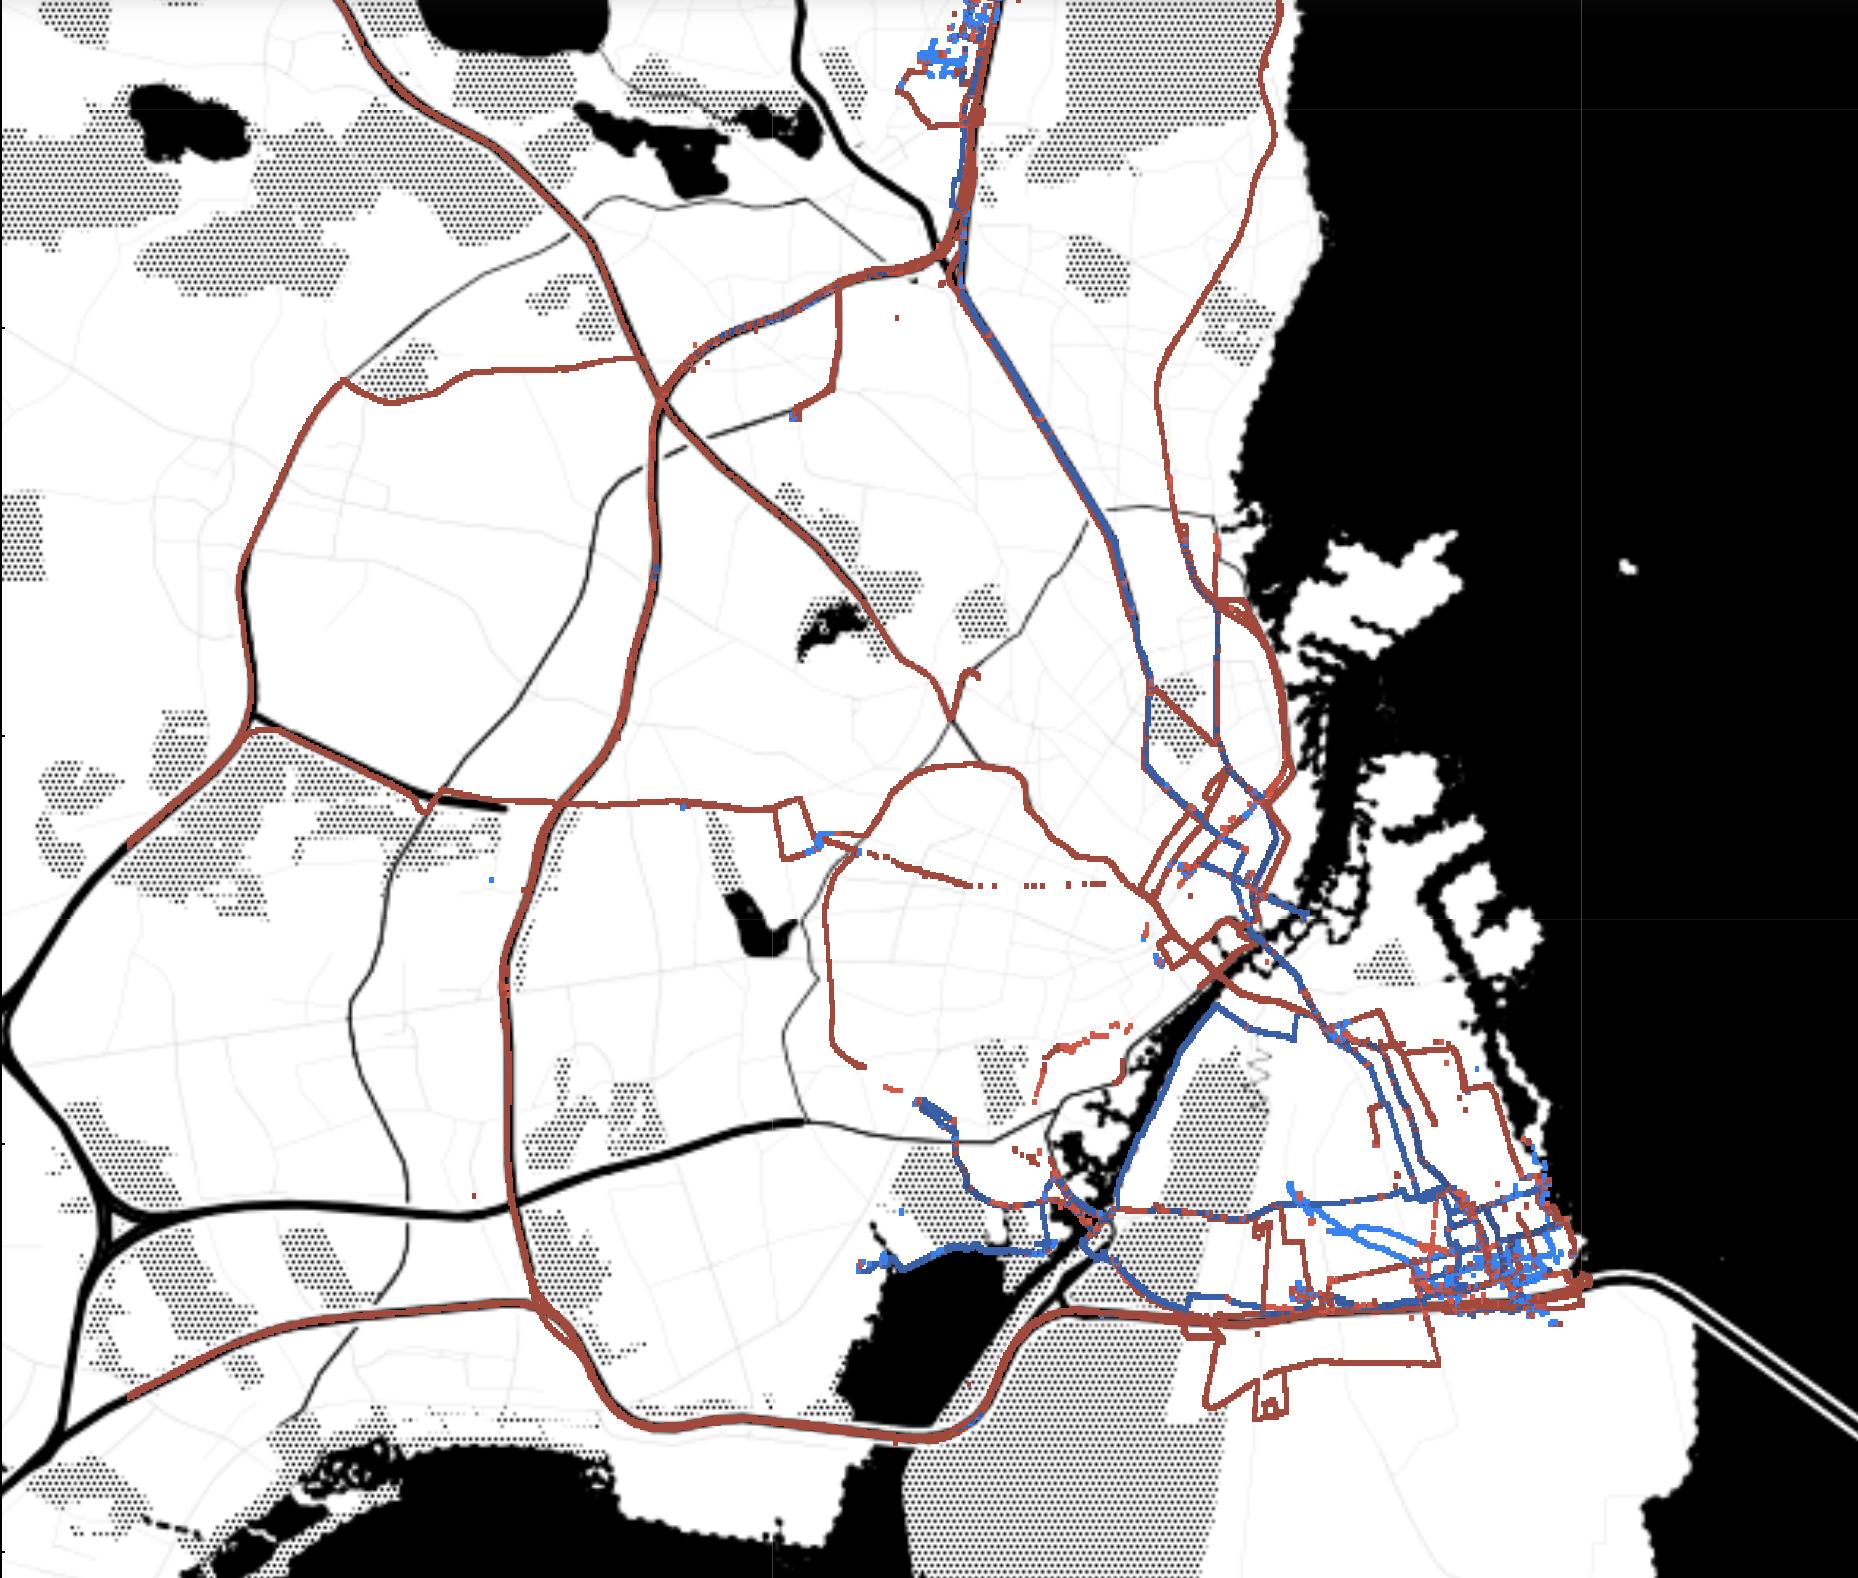
To expose existing mobility patterns for bicycle riders in Tel-Aviv and Copenhagen cities, and enable study and development of digital road network characteristics for Tel-Aviv and Copenhagen with particular focus on long distance routes, the second phase of this project had to focus in finding alternative relevant data sources
To compose a novel and relevant dataset, the efforts were directed in multiple directions. For Tel Aviv, Technion teamed up with BIRD, popular company providing e-scooter sharing service in multiple cities worldwide. For Copenhagen, the Centre of Transport Analytics at DTU provided data collected via TravelVu (by Trivector), the most popular European smartphone-based travel survey The resulting dataset includes approximatively 1000 unique users and their GPS trajectories collected throughout approximatively 1 month. This dataset has been enriched by adding relevant public dataset from Beijing and San Francisco. Although this phase was originally part of the risk mitigation plan, the resulting population enabled the study of the mode detection problem with focus on bike, e-bike, and e-scooters, from a unique perspective.
The following phases of data analysis, algorithm design and implementation were consistent with the original plan For travel-mode detection, we wanted to assess and validate the reliability of the travel-mode documented by the users. Since data is retrieved from smartphone-based loggers, in most cases no implicit
labelled travel-mode is documented for the trip; thus, we developed a model that should automatically decide on the most relevant travel-mode according to the documented travel characteristics. The ultimate goal is to filter irrelevant trips, e.g., walking, cars, public transportation, and keep only trajectories (trips) of bicycle, e-bike and e-scooter users.
While composing the dataset and evaluating baselines for comparing our off-line mode detection classifier, we found that several scientific articles, including the main reference for semi-supervised artificial neural networks (Dabiri S., 2018; Dabiri S. 2020), tend to apply a methodology for train-test data split that seems ambiguous. The performance of any classifier should be evaluated complying with the out of sample principle This means that the data used for the evaluation phase should not be exposed during the training phase of an algorithm (Hillel T., 2020).
One of the most used algorithms available to split a dataset in a training and evaluation partition is the “train_test_split” by “Sklearn” library3 While this algorithm is very effective when the dataset is composed by independent and identically distributed observations, e.g., for classification of images, its use with timeseries such as the GPS trajectories can lead to information leakage between the training and the evaluation partition Consequently, when such a “train_test_split” algorithm is used for the performance evaluation of a model applied on a dataset composed by GPS trajectories, as for example in the case of Dabiri S., 2018 and Dabiri S. 20204 , the resulting performance is probably very biased. Algorithms ranked according to the performance measured consistently with such an approach, perhaps will be still consistent. However, the real performance of each algorithm would be way below the one reported.
This new perspective allowed us to consider alternative approaches, and to reconsider the performances we obtained with our algorithms. Complying with the out of sample principle, our results are more realistic and not as biased as some of the literature we reviewed. Consequently, the literature review relevant for this activity and carried out to inspire the second part of this project, should be reconsidered from scratch In fact, the selection of valuable references should take the aforementioned stand point into account. Unfortunately, in contrast with Sinas Dabiri’s work, only a fraction of the references shares the source code. Therefore, in most cases, we have no option of checking thoroughly algorithms for performance measurement Future work will allow a better understanding of promising architectures and algorithms for mode detection. This can enable us to push the current boundaries, thus to improve the classification performance of our algorithm with respect to GPS trajectories generated by bikes, e-bikes, and e-scooters
2.2 Timeline
Planned Executed Activity Planned Deviation from plan
September 1st, 2020 November 1st , 2020
Survey of related apps. Accomplished as planned (see Appendix 1)
3 Train_test_split from SKLEARN suite, retrieved from web May 2020, at https://scikitlearn.org/stable/modules/generated/sklearn.model_selection.train_test_split.html
4 Use of Train_test_split on published by Dabiri, and related to Dabiri, 2018 and Dabiri 2019, retrieved from web May 2020, at https://github.com/sinadabiri/Transport-Mode-GPS-CNN/blob/master/CNN-Ensemble-keras.py
November 2020 December 2020 Graphical User Interface (GUI) design
December 2020 January 2021 Design of micro-tasks (active data collection).
Survey of available smartphone-embedded sensors, decision on sensory data collection.
January 2021 February 2021 Anomaly detection (erroneous data) algorithms development.
Support for both Android and iOS smartphones.
Server development, and implementation of data archiving.
February 2021 March 2021 Pilot testing in Tel-Aviv and Copenhagen.
Activity accomplished only partially, as the Interaction designer has started prematurely the maternity leave (see Appendix 4)
Accomplished as planned (see Appendix 2)
Accomplished as planned (see Appendix 3, Appendix 4)
March 1st , 2021 May 1st , 2021 Pilot testing in Tel-Aviv and Copenhagen.
The reduced mobility consequent to COVID-19 restriction in workplace, allowed the collection of trajectories below the expectations (see Appendix 4). This risk was taken into account, and relevant data were collected from alternative sources. For Copenhagen data were provided by the Center for Transport Analytics at DTU; for Tel Aviv, by BIRD.
As the situation didn’t improve compared to the previous month, data analysis and algorithmic developments were accomplished using the alternative data sources
Table 1. Schedule of the activities described in the application, and deviation from the plan
2.3 Organisational set-up
The main organizational setup was stable. Only partial exception is the person in charge of the User Interaction Design of the application, which could provide only partially her contribution.
Name Organisation
Contribution
Sagi Dalyot Technion Host Professor at Technion and Project Leader
Dror Reshef Technion Front-end development and implementation
Valentino Servizi DTU Front-end and back-end design, back-end development, implementation, application deployment, and algorithms’ development
Eldar Lev-Ran Technion Algorithms’ development
Adi Orel Technion User Interface
Design
Anders Fjendbo Jensen DTU Advisor
Table 2. Organization set-up and role
2.3 Economy
The situation of uncertainty due to COVID-19 travel restrictions required some trip replanning and consequent ticket rescheduling, and extension of the accommodation. Therefore, the actual cost is slightly above the budget The following scheme shows both budget and actual costs. The flight was covered by COWI donation for a budget up to 18.000,00 DKK. OMS donation contributes for 30.000,00 DKK. DTU covered the remaining “studierejselegater” costs.
(not including overheads)
3. Publication of results
The work on the algorithms development for mode detection focusing on bike, e-bike and e-scooters was submitted and accepted for the Israeli Smart Transportation Research Center (ISTRC) Annual Conference5 , which will take place 21st of June 2021.
5THE 1st ISTRC ANNUAL CONFERENCE, retrieved from web May 2021 at https://istrc.net.technion.ac.il/centerevents/1st-istrc-annual-conference/
Appendix 1 – Survey of related applications
The literature review includes existing research related to the various aspects related to travel surveys in general – and GPS-based travel surveys in particular, that require customized handling and planning of data processing and app development, among others, sensors, data collection, privacy issues, public engagement/gamification, and community sustaining. This section also includes a review of existing apps used by the cyclists community, each with a general description to correlate its relevance to the app developed in the bike-longer project.
Transportation related research, such as travel behaviour and demand models, are at the core of the transportation strategic planning process. They aim, among others, to analyse current usage and traffic and forecast the future demand for travel in a specific city based on travel behaviour characteristics, social habits and lifestyles of the population. These are gathered through travel behaviour surveys. The result of the planning process is the development of better transportation infrastructure and services, e.g., for cycling. Travel behaviour surveys are very expensive and time consuming and can be performed in several ways (e.g., Richardson, 2005), including conventional (classic) home interview surveys, postal questionnaires, telephone surveys, and web-based questionnaires. Only rarely research uses a seven-day diary (e.g., Kenyon, 2006), and thus in most cases data is sparse and representing the comprehensive state of the active travel. The use of an integrated approach that combines travel surveys and GPS tracking logging exists for more than a decade now (Shen and Stopher, 2014). Using only designated apps that are designed to document and log active travel is still an open topic (e.g., Sjöman et al., 2020; Nahmias-Biran et al., 2018), although it has the potential to gather a high level of spatial and temporal resolution and allow data consistency.
The interpretation of trajectories of moving objects is a topic of high relevance for a variety of application areas, let alone in the Transportation Sciences (TS). On a generic level, trajectories can be interpreted with respect to specific movement behaviour, or related to the underlying movement constraints (e.g., routable network). Information about the movement behaviour of objects is implicit in trajectory data and has to be made explicit using sophisticated interpretation methods. A taxonomy of generic movement patterns is described by Dodge et al. (2008). In the context of the bike-longer project the identification of group patterns plays an important role, e.g., (Kuntzsch and Bohn, 2013). Besides the use of mere GPS points (tuples of location and time), it is also possible to further exploit the sensors present in today’s smartphones, such as accelerometer (Zhang et al., 2013), or to include spatial context from Geographic Information Systems (GIS) (Andrienko et al., 2011). Further information about movement behaviour can be derived by the identification of regularities or repetitions within a trajectory. Besides determining regular visit patterns (Djordjevic et al., 2011), the extraction of interesting places (start, stop and purpose of trips) (Feuerhake et al. 2011) reveals important information and can, e.g., be used for the determination of ‘personal paths’ (Zhou et al., 2005), the detection of unusual behaviour, or the prediction of movements (Feuerhake, 2012). Van der Spek et al. (2009) investigates urban quality in the context of urban planning using GPS traces to determine attractive and non-attractive places.
To motivate participation, engagement, and loyalty of users towards services, as well as customers towards goods, often such services and products introduce game mechanics in the consumption process; this approach takes the name of Gamification6. At the base of this technique is the application of the same
6 Bunchball (2015) Resources-What Is Gamification?, http://www.bunchball.com/gamification. [Accessed: 24-December-2020].
motivational triggers that make games engaging. Scoring, ranking, competition and reward are among the main components of this technique.
Scoring and ranking are synergic. Perhaps, the first component is not as meaningful when implemented without the second. Thus, we present a user with both score and ranking, where the latter is any expression on this score with respect to all active users. In this way, we trigger inspiration and motivation to perform the activity related to the score, and go back to check the resulting performance, which is the ranking. Scoring and ranking, together, leverage on users’ competition desire. However, if not properly handled, competition could also be counterproductive and inhibit users. For example, tables and charts about us ers’ bike trips showing GPS coordinates, speed, calories burned, CO2 emission saved, can be used for ranking, but also to provide rewards (Sik et al., 2017). Competition and reward are also synergic. Properly handled, these components increase users’ motivation by checking the advance of, e.g., familiar opponents, including themselves (Nakashima et al., 2017).
The introduction of a smartphone application, in this case for cyclists, offers the opportunity to look into how to gather and sustain a community that has in common the interest in bicycling. Despite the definition of strategies, governance model, operational rules and the selection of the community initiators, which could differ country by country, in this phase we focus on the creation of a tool to enable its future deployment, specifically, through a smartphone application. The goal is to develop an environment suitable for collaboration towards a shared interest, and trust relationships among stakeholders and community. We aim at applying this model to increase the public engagement towards the improvement of the public network infrastructure for cyclists.
In Europe, "a country-by-country analysis of the reasons for disclosing personal information on social networking or sharing sites shows that to access the service is the most important reason in 21 Member States [...] More than four in ten (43%) report they were required to provide more personal information than necessary" (Eurobarometer, 2011). This survey, for example, is related to active collection of personal information. As for passive collection of user’s personal information, smartphones enable passive collection of a rich stream of sensors, such as Assisted-GPS (AGPS), accelerometer, gyroscope, and magnetometer (Servizi et al., 2019). Authors also state that to be meaningful, and optimal for study, AGPS should be collected at 1Hz during trips; the other sensors, at frequencies above the human body motion, which is 20Hz. All this information can contribute to a huge value for the users, which can consume highly personalized services. However, personalization comes at the cost of privacy. A vast majority of Internet users are exposed to over-disclosure, and thus to risks which have been driving both private and public efforts to protect users, as for example the General Data Protection Regulation.
To improve the transport infrastructure, scientific studies increasingly leverage smartphones and the sensors they can offer. For example, map-matching, transport mode detection and trip purpose imputation, which are at the very base of most behavioural studies related to transport, can use GPS trajectories in combination with Geographic Information Systems (GIS) to study transport choices. Data collection is often achieved via surveys, which have the sole purpose of collecting this data, sometimes under a monetary incentive for users. Although the scientific community is aware of the privacy concerns, in this case, there is no clear solution on how to solve the conflict between the need of accurate GPS trajectories for behavioural studies, and the need of approximate trajectories to enhance users’ privacy (Servizi et al., 2019).
In the following, we present a list of mobile services (apps), divided into six categories, relevant for this project, which are available on smartphones, mostly for cyclists. These mobile services provide different interpretations of the above principles and provide different values for the users’ base.
Apps for Cyclists Focus on Fitness


Strava records and upload rides (location and altitude), and allows users to see what their friends do. Users are ranked according to their cycling activity record. This application supports external GPS devices and biometrics monitors.
Training Peaks provides advanced tracking for fitness and fatigue, as well as support for training schedules. No social network connection is available.
Zwift allows users to train (cycle) at home, with other cyclists, on virtual roads.
Wahoo Fitness supports connection with Bluetooth sensors, tracks everything and uploads to, e.g., Strava and other fitness apps.


Relive is an engaging 3D video flyover of the ride, with personal progress over the route, which pinpoints segments with top speed, elevation profile, photos taken along the way, and uses ride data from, e.g., Strava.
Ride with GPS allows planning of routes in great detail, navigating and recording one’s ride. Navigation can be both online and offline. Detailed elevation profiles are available. Users can share rides on social networks. Advanced route editing is possible and supports custom cue sheets and private segments. User interaction is designed assuming a support for the smartphone on the handlebar.

Rouvy supports training from home on a stationary bike, with 2,036,020 km of real track movies, including info on each track.

Cyclemeter turns the smartphone into a logger, and it is iIntegrated with Google Maps. It stores data locally and allows exporting rides to Strava or Facebook.

MapMyRide, similar to Cyclemeter, includes routing service, and fitness-oriented tracking (nutrition, weight, etc.).
Apps for Cyclists Focus on Navigation/Routing


Google Maps is the golden standard for navigation; however, it falls short with bike directions in some areas.


Komoot relies on OpenStreetMap (OSM) and Open-Source Routing Machine (OSRM). It offers the most efficient route from origin to destination, taking into account how bike-friendly a road or path is, as well as the users’ fitness, road surfaces, and elevation profile. It allows for easy on the fly route changes to other route recommendations in the users’ position surrounding. Recommendations include features curated highlights, as suggested by local riders and Komoot ambassadors.
Bike Hub used to plot a route from origin to destination omitting dual carriageways and motorways, including cycle paths and permitted paths. This app, once ranked among the top applications for cyclists, is no longer available on the market.
Bike Citizens allows to select a route by bike, fitness, and road surface profile, in several cities of the world.
Apps for Cyclists Focus on Specialized Communities

Viewranger is for off-road exploring, where users can create and share their own routes in the app, download other people’s tracks or just explore the riding around. There’s even a live tracking ‘Buddy Beacon’ function that allows sharing a ride trace with the public or selected friends, as well as seeing who is around.


Trailforks relies on crowdsourced information. The app has more than 161,000 trails around the world, and includes condition reports, live tracking, and even points of interest, such as bike shops, in case the user needs a spare tube. Can be used offline. Emergency function that generates exact GPS coordinates and name of the nearest trail.
DotWatcher.cc is tracking-oriented maps, insight and analysis for specialized long-distance bicycle races, by experienced long-distance racers.
Apps for Cyclists Focus on Bike

The Road Bike Manual is a bike repair app, providing instructions on how to maintain a bike.

Delight helps the user locate his/her bike and switch lights on/off automatically.
Apps for Cyclists Focus on Cycling Context


Fill that hole maps road conditions and report to the municipality.
First Aid by British Red Cross helps learning how to deal with common first aid emergencies, as well as being an invaluable reference when things go wrong. All the information is stored on the phone, so it works with no data connection.
What3words pinpoints and shares the exact location in every part of the world using 3 words, also vocally. Integrated with Google Maps, Apple Maps, and Waze.

MyWindsock displays a heat map of where you are most likely to encounter head, cross and tail -winds over a Strava segment or ride.
Apps for Cyclists Focus on User Behaviour and Complex Multimodal Transport Chains (Travel Surveys)


Mobile Market Monitor is one of the first successful smartphone-based travel surveys, deployed by several large-scale transport surveys worldwide, such as in Israel, Singapore, and Boston. The front-end application installed on users’ smartphones collects data from the GPS sensor, while the back-end of this sensing platform reconstructs users' travel diaries through Machine Learning (ML) algorithms that process the trajectories to detect mode and purpose of each trip. These diaries are then proposed to users for validation, in order to form the ground truth on these trips (https://www.mobilemarketmonitor.com).
TravelVu is currently one of the main smartphone-based travel surveys in Europe. Very similarly to Mobile Market Monitor, at least on the surface, is designed to collect ground truth on users trips and implements a similar smartphone sensing platform where data are collected passively from smartphones’ sensors, while ground truth is collected actively, by users (https://www.travelvu.app/).
Appendix 2 – Sensing Platform Requirement Specification
This appendix describes bike-longer sensing platform design and development, carried out within the project timeline constraints with a Scrum7 approach. Scrum is an iterative and incremental agile software development framework for managing product development. It is adopted in most innovative and complex software development companies. Each member of the development team is considered as a product owner. The requirements specification document that is listed and prioritized is the agile product backlog (see A.2.3)
The development team has a sprint planning periodically. Meetings and intervals between meetings are short. At each meeting, the requirements with highest priority are first pulled out as a sprint backlog before sharing the tasks to implement the software components involved. The choice to adopt the Scrum framework is motivated by its incremental and collaborative aspects. As complexity increases, breaking the system into pieces and incrementing one feature at the time allows early feedback from testers, while fulfilling the needs raised in the requirement document. Requirements are prioritised to avoid failure circumstances. The chosen technique is called MoSCoW 8, which stands for:
7 “Overview: What is Scrum?.” https://www.scrumalliance.org/about-scrum/overview. [Accessed: 24December-2020].
8 Scott Bradner, “rfc2119,” 1997.https://tools.ietf.org/html/rfc2119 [Accessed: 24-December-2020].
a. M - MUST have this. The requirements here are non-negotiable. If they are not delivered then the project is a failure, therefore it is important for the team to decide unanimously on what can be delivered and be useful.
b. S - SHOULD have this if at all possible. The “NICE TO HAVE” feature falls into this category.
c. C - COULD have this if it does not affect anything else.
d. W - WON’T have this time but would like in the future. The “WON’T” features are equally potentially as important as the “MUST” features. Classifying some of the features as “WON’T” acknowledges that they are likely part of a future release.
Consequently, after a literature review and analysis, the design and development process become a loop (see Figure 1), where the backlog is continuously updated and adapted to context and ultimate goal.
To describe the component of the system and the relationships among components, we use the objective of Unified Modelling Language (UML). This standard provides system architects, software engineers and software developers with the tool for analysis, design, and implementation of software-based systems as well as for modelling business and similar processes 9
UML is a standard modelling language, and it helps the project process to provide guidance as to order of the activities; specify what artefacts that needs to be developed; direct the tasks of each team members; offer criteria for monitoring and measuring the project activities. In particular, we describe the system through a class and context diagrams. The first shows the structure of the designed system at the level of classes and interfaces, presenting features, constraints and relationships. The second represents the static structure and dynamic behaviour of a system.

9 O. M. Group, 2010. “OMG Unified Modeling Language TM (OMG UML), Superstructure v.2.3”. [Accessed: 24-December-2020]
A2.1 Motivation and Concepts
This section provides the necessary background knowledge for the design, analysis and implementation analysis. It describes several research areas into which to organize the analysis, consisting of theories about identity and access management, smartphones and onboard sensors, and an overview of potential technologies to adopt in the implementation perspective.
A.2.1.1 Identity and Access management
This context is part of the implementation perspective and deals with privacy, identity management and personalization theories relevant for this project. With the popularity of web services, organizations are more than ever concerned about ways to uniquely identify users and ensure their privacy. Therefore, the concept of identity and personal data are reviewed to highlight methods to securely filter who can access and which information should be collected.
Robin Wilton defines Identity in the context of “digital identity” as ...“the relationship of identity between a person at enrolment time, and a person at authentication time”.. (Wilton, 2008). The first time one accesses a service provided via web or via app, during enrolment, this user provides a set of attributes to uniquely identify him/her. The following times one accesses this service, during the authentication, to be identified before accessing a service this user should provide at least one credential. Credentials contain attributes and entitlements, such as API key, or user ID and password. The user presents these credentials when he or she accesses the service; if these credentials correspond to those shared between user and service provider, which have been issued by the former to the latter, the service provider allows the user to access the service. The concept of digital identity, from this perspective, is rather a process than a state, entailing factors like supported identity assertions and difficulty to break the encrypted stored credentials (Dhotre et al., 2018).
Kim Cameron defines the digital identity as a set of claims made by one digital subject about itself or another digital subject (Cameron, 2015). “The Onion model clarifies some of the different types of identity data, and how they relate to the concept of credentials […] also reveals an item of identity-related data which is not only often overlooked” (Wilton, 2008). To converge toward privacy and minimal disclosure of information, the system should only ask for the information needed. This concept is evident in Figure 2, which shows the onion model in detail.

Figure 2. The onion model (source: Wilton, 2008).
Basic Identifier Set (BIS) represents a core of minimum attributes considered to be sufficient to link the identity of a person, and it does not change over time. Such information is likely to be Name, Date of Birth, Gender, social security number (SSN). BISs are also likely to be determined prior to one’s birth. Personally Identifiable Information (PII) refers to any information that can be used to trace an individual. PII may change over time. For example, address and email address. Information, such as medical and educational histories, are also part of PII that are used to link the identity. In “Strategy for trusted identities in cyberspace”, OECD specifies in its security principles that organizations should protect PII in all media through appropriate safeguards that prevent from unauthorized access or use, destruction modification or inappropriate disclosure. Moreover, organizations should only collect PII data directly relevant for the service to work properly (Wilton, 2008). Other attribute data refer to any information that, in the digital environment, is insufficient to link the identity of a subject.
To provide a personalized service and increase the personal value for the user, service providers should be able to know the user preferences, which are a set of personal information and include, e.g., profile settings and service consumption history. Brought to the context of interaction design, using collaborative methods to get users input can also lead to a personalized service. Collecting information about users is essential for developers to be able to build intelligent services that apply personalization criteria (Wilton, 2008).
There are generally two ways to personalise a service content: active or passive personalisation. Through active personalisation, personal data are collected by prompting users to enter their choice to be able to deliver a personalized profile. An advantage of this scenario is that users define how much information they disclose. Passive personalisation is another way to collect identity data by indirect means, e.g., through scanning online behaviour history; the outcome is valuable for both the user and the service provider. The main technical challenge about personalization is that the system should ask for users’ identity before accessing any resources. OAuth and OpenID are examples of solutions to allow users’ authorization without handling users’ identity, on the service provider side, and keep control on personal information, on the user side.
Privacy can be defined as the right of any user to control who knows what personal information. In the domain of this project, privacy is very important because to study cyclist travel behaviour we need sensitive information on users’ trajectories. An essential aspect of information privacy is ‘controlled disclosure’ where users can decide which information to give out. Since 24 May 2016, with the General Data Protection Regulation (GDPR), the EU regulatory framework can count on an harmonized set of rules to guarantee basic rights such as the right to be forgotten.
The separation between Identity Providers (IP) and Service Providers (SP) facilitates building a circle of trust, as users bring their own IP to access third party SPs. With this model, while BIC and user identity re mains on the IP side, the SP handles PII and other link-able informationת such as GPS trajectories and trip history. In this way, SPs can provide a personalized service with pseudonymised data, which is personal information of a user that is not directly link-able to his or her identity (Kaaniche et al., 2020).
Confidentiality, Integrity and Availability, which constitutes the CIA triad, are the foundation of any IT service (Deepika and Pandiaraja, 2013). Confidentiality is defined as the ability of a system to ensure that an asset is viewed only by authorized parties. Integrity is defined as the insurance that messages between user and
server are not manipulated; Availability is the ability of a system to ensure that any asset can be used by any authorized party at any time. A system should be designed to resist hacker attacks, such as man-in-themiddle, spyware or denial of service. The combination of Secure Socket Layer (SSL) certificates and shared secrets between user and service provider, achieved implementing cryptographic keys and signatures, can ensure that communications between user and server are genuine and information is not manipulated, while the service deployment over auto-scaling cloud architectures with the CIA triad, can protect from malicious data traffic.
SSL is one of the most widely deployed web security protocols in client-server communications. SSL purpose is twofold: it is used to establish an encrypted communication channel, and it is used to authenticate the server so that the client knows who it is communicating with. For encryption, the client begins the communication by sending a request and the server responds to the client’s request. In the SSL connection with a user agent, for example, this is the SSL Client and a website is the SSL Server. For authentication purposes, the client asks the server for its public key certificate, the server must answer with a Certificate message containing a certificate chain beginning with the server’s and ending with the Certificate Authority’s one; this is necessary for the client to trust the server in order to prevent masquerading attacks. The public key contained in the Certificate message is then used by the client to encrypt its own key information to send to the server; in this way, only the server with a corresponding private key could decrypt the message.
Users’ authentication is crucial to guarantee the aforementioned user rights in terms of both privacy and CIA. However, authentication can be defined as the ability to single out a user; authentication can be disjoint from the identification, intended as the ability of linking a user and his/her identity. Thus, identification and authorization can be handled separately, on the IP side, and not on the SP side. OAuth and tokens are some of the technologies that enable this separation. OAuth is a web standard for authorizing limited access to applications and data. It allows the users to grant third party service providers, to access resources that users own. For example, users can register to third party services using their existing account, e.g., Facebook, Google, Linkedin, and Apple. When the user, which is the resource owner, asks for a third-party service, he/she is redirected to an authorization page where he/she provides a consent for the third party service to acquire tokens from the Authorization Server (AS) maintained by the user’s Identity Provider. Consequently, the third-party service provider can bind the user unique pseudonym generated on its domain, with the user unique pseudonym available on the Identity Provider’s domain, which the service provider can access through the AS, as long as the user does not revoke the permission. OAuth standard dramatically reduces the complexity of managing users’ identity and access, as the third-party service provider should only assign a unique pseudonym to each user, and follow users' desiderata in compliance with GDPR, and enforced by the IP through the AS, both external to the third-party service.
A.2.1.2 Technologies involved throughout the communication stack
To handle PII generated by a smartphone-sensing platform and reduce complexity and security risks deriving from users’ identity and access management, this platform should be designed and implemented as the combination of multiple sub modules. Service Oriented Architectures (SOA), which refers to a collection of micro services able to communicate with each other to compose the service required, are the pattern we identify for this project. The main purpose of SOA is to establish a connection between multiple services to coordinate specific activities.
Each service exposes an application programming interface (API) to exchange messages, which can be exchanged as Simple Object Access Protocol (SOAP) or Representational State Transfer (REST). Web APIs allow an application developer to call a set of functions, without knowing the underlying source code in detail, to send request from the client to the server and get response in a specific message format called Extensible Markup Language (XML) or JavaScript Object Notation (JSON) over Hypertext Transfer Protocol (HTTP). Representational State Transfer (REST) refers to a set of architectural principles to design a Web Service over HTTP. The main focus of REST is to address the resources and transfer them over HTTP to a large number of clients written in different languages. The default RESTful behaviour involves a client sending a request to a server in order to get the appropriate resource in response.
REST lays on the following four principles: Resource Identification through Uniform Resource Identifier (URI); “Self-Descriptive” Message representations; Hyperlinks to define relationships between resources; and valid state transactions of the service interaction. Uniform interface for all resources, where every resource is uniquely addressable using a uniform and minimal set of HTTP methods over the Internet. Those HTTP methods are: GET, POST, PUT, DELETE. GET is used to retrieve a resource; POST, to create a resource on the server; PUT, to change or update the state of the resource; DELETE, to remove or delete a resource.
A2.2 Front- and back-end technologies
JavaScript is now the most widely deployed programming language in history. As a result, most of the familiar operating systems, including Firefox OS, Google’s Chrome OS and Windows 8 have adopted this language as the open web standard as a presentation layer for the native apps. Most popular mobile device operating systems (e.g. Android, iOS) also support web applications built on JavaScript, which is considered as the de facto standard for websites and web applications as well.
A.2.2.1. Front-end
To access sensors and low-level functions on Apple devices, it is necessary to use the API exposed by this proprietary platform, which requires to work with specific programming languages, such as Swift and Objective-C. Similarly, for any other smartphones provided with Android, the API to access these sensors and other hardware components requires Java. For the user interface, however, Facebook introduced a unifying framework: React Native (RN). This technology allows to design and implement one user interface and deploy this interface across different operating systems, such as Apple iOS and Google Android. RN is one of the JavaScript frameworks based on the Model View Controller (MVC) design pattern. MVC is used by RN to develop single page native applications, separated into three main classes based on domain, representation and instruction. The model manages data from the application domain, and to get requests from the View to display this data and get instructions from the Controller, which changes or updates the state. View deals with displaying the data to the smartphones’ screen. Controller illustrates the inputs from the clients and instructs the Model or the View to display or change the appropriate page.
A.2.2.2
Back-end
Node.js, is the only major back-end that is written almost entirely in JavaScript. It can be integrated with any other app written in JavaScript, and allows developers to implement easy, fast and scalable network service. Implementing a smartphone-sensing platform presents several requirements, such as, central data storage, and communication routing, which should be fulfilled by the back-end. Usually, the back-end is executed on one or more remote servers, which listen to the requests from the smartphone and respond with the required resource. Setting up a Node.js application is fast due to the many open source modules providing
useful and ready to use functions. One of the biggest advantages of Node.js is that it allows to write both server and client -side scripts in JavaScript, and potentially also the database query and routines. It is always complex to find the best trade-off when distributing a service logic between front and back -end. In case both front- and back-end share the same programming language, as with NodeJs and NativeReact.js, developers have the option of transfer and readapt the instructions between the two. Node.js applies a unique logic to handling web requests, as it uses a single threaded model, while traditional web servers, such as PHP or Python, use multiple threads. In the first case new web requests arriving to the server are processed despite the status of the previous requests; In the second case, new web requests must wait until previous requests are completed. Consequently, the same level of performance can be achieved more efficiently using Node.Js, with less performant hardware, thus with less resources.
A.2.2.3 Database management system
MongoDB is a database system which is totally different from traditional Relational Database Management System (RDBMS). MongoDB does not involve any concept of tables, schemas, or rows. The main motivations behind NoSQL are simplified designs, horizontal scaling, and finer control of the availability of data. MongoDB is document oriented: data is stored in a format called BSON, a binary form of JSON object, which is more efficient for the machine to parse because it is binary. At the same time, it is easy to translate to JSON for the client.
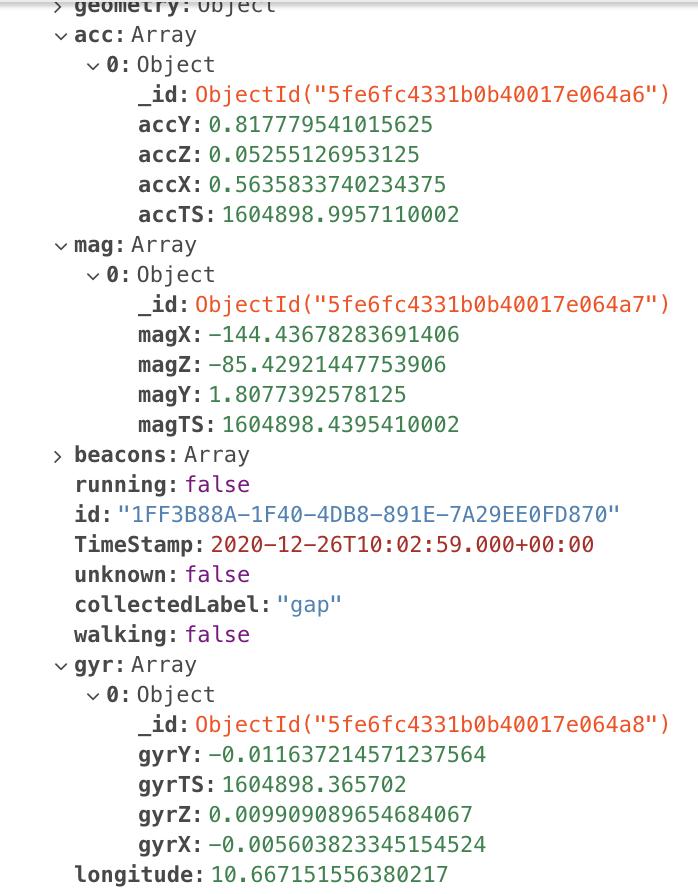
The optimal smartphone data stream to study users behaviour includes four sensors: GPS, Accelerometer, Magnetometer, and Gyroscope. While the optimal sampling frequency of the GPS is 1Hz, the other three sensors should be sampled at 30Hz minimum. Multiplying such a data stream for the number of users active on the platform requires the top technologies available. The database should support heavy traffic and automatic vertical and horizontal scalability. If the data model does not contain many relationships, as in this case, JSON and MongoDB represent one of the top performing available databases and data organization. MongoDB can offer high scalability because of its structure, which can be scaled horizontally by fragmenting data across various servers. Since MongoDB’s replication model allows fast scalability, it can assure high availability of data too. To compare it with another popular Relational Database Management System like SQL, which does not allow, e.g., auto-sharding (fragmenting data into multiple servers) and flexible data models, Mongodb represent the natural choice for projects that might require continuous improvement, optimization and deployment in different countries. Moreover, Mongodb is also based on Javascript. It is worthwhile mentioning that MongoDB offers a geo-query feature for GPS trajectories that enables building value for both cyclists and researchers, for example to compute flexible origin-destination matrices, through simple geo-queries.
A.2.2.4 Cloud computing
In order to deploy the stack of solutions necessary to compose a smartphone sensing platform, Cloud Computing platform as a service (PaaS) can be a solution. The National Institute of Standards and Technologies (NIST) defines cloud computing as: “a model for enabling ubiquitous, convenient, on-demand network access to a shared pool of configurable computing resources (e.g., networks, servers, storage, applications, and services) that can be rapidly provisioned and released with minimal management effort or service provider interaction” (Mell and Grance, 2011). According to NIST, there are three levels of cloud service provisioning. Software as a Service (SaaS): Users can access the application from anywhere from any device through a browser or client interface even though the consumer does not need to control or manage underlying cloud infrastructure including server, storage, operating systems etc. (ibid.). Microsoft 365 is one
of the examples of SaaS. Platform as a Service (PaaS): It refers to providing a platform with relevant tools to deploy consumers created applications. Here consumers have control over the deployed application. Amazon Web Service, Heroku or Mongo Atlas can be the examples of PaaS. Infrastructure as a Service (IaaS): The goal is to provide networks, storage, server and other computing resources to the consumers to deploy arbitrary software including operating systems and applications. Here consumers have control on operating systems, storage, and deployed applications. Amazon can be an example of IaaS.
A.2.2.5 Digital map and Geographic Information System
Digital maps are necessary to encapsulate a very large amount of information on the geospatial context where users travel, in this case cyclists. There are several proprietary and open-source alternatives, such as Google Map and OpenStreetMap. The challenge related to digital maps consumption from a portable device in this project is two-fold. On the one hand, we want the possibility of accessing and updating any relevant information for cyclists. On the other hand, we want to display this information in an efficient way. While the interaction with GIS is possible in different ways, serving this information on portable devices requires specialized servers able to provide images at multiple resolutions, and mapped with coordinate systems, such as GPS. The customization and maintenance of these services is not trivial, and only few suppliers are available on the market. An interesting commercial alternative, which allows high customization, is Mapbox. Mapbox is mostly based on OpenStreetMap data, and maintains several open-source APIs, offered conveniently as a cloud service.
A.2.3 Requirement specification scheme
This section lists the requirements identified in the analysis using FURPS+ (Grady, 1992), and prioritized using the MoSCoW method.
Requirement Description
Functional Requirements
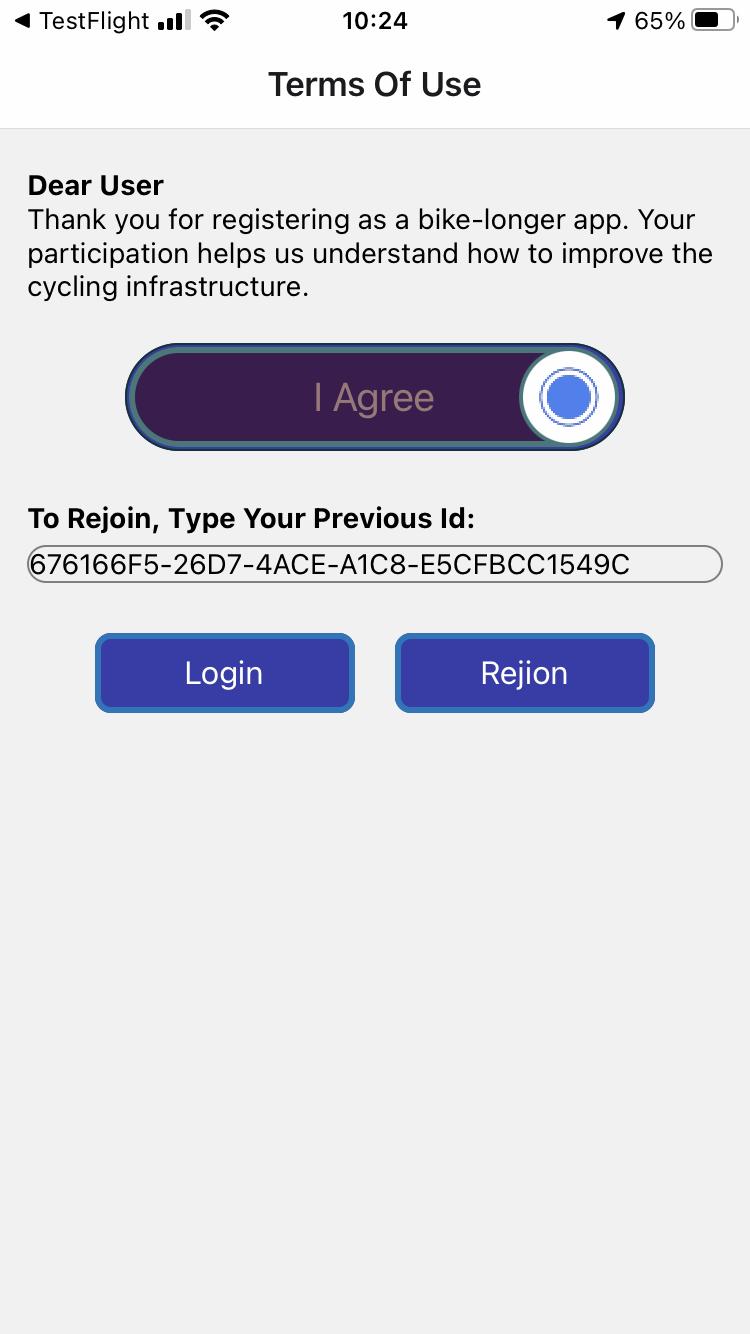
FR_01 The system requires the user to sign up and login via a form.
FR_02 The user accesses the system with his or her existing account, e.g., on Google, Facebook, Apple.
FR_03 To authorize users first access to the app, the system allows the assignment of a unique shared secret.
FR_04 The user can rejoin and access his or her personal information, for example in case of
This requirement is derived from section A.2.1. It won’t be implemented as it is considered redundant with the OAuth standard, and it would prevent collecting user permission on sensor access.
This requirement is derived from section A.2.1. Although it is considered the best way to enable users’ control over their personal information, and gain speed for the user to rejoin the service in case of substitution of the phone, or uninstallation of the app, it won’t be implemented at this stage.
This requirement is derived from section A.2.1.
This feature must be implemented in order to allow correct storage of users’ personal information, and to exercise the users right to be forgotten.
Won’t
This requirement is derived from section A.2.1
This feature must be implemented independently from the users’ identity and access management.
Won’t
Must
Must
smartphone substitution or temporary application call off.
FR_05 The system informs the user beforehand on what personal information could be collected, for what purpose, and what procedure is available to put the user in control of his or her personal information.
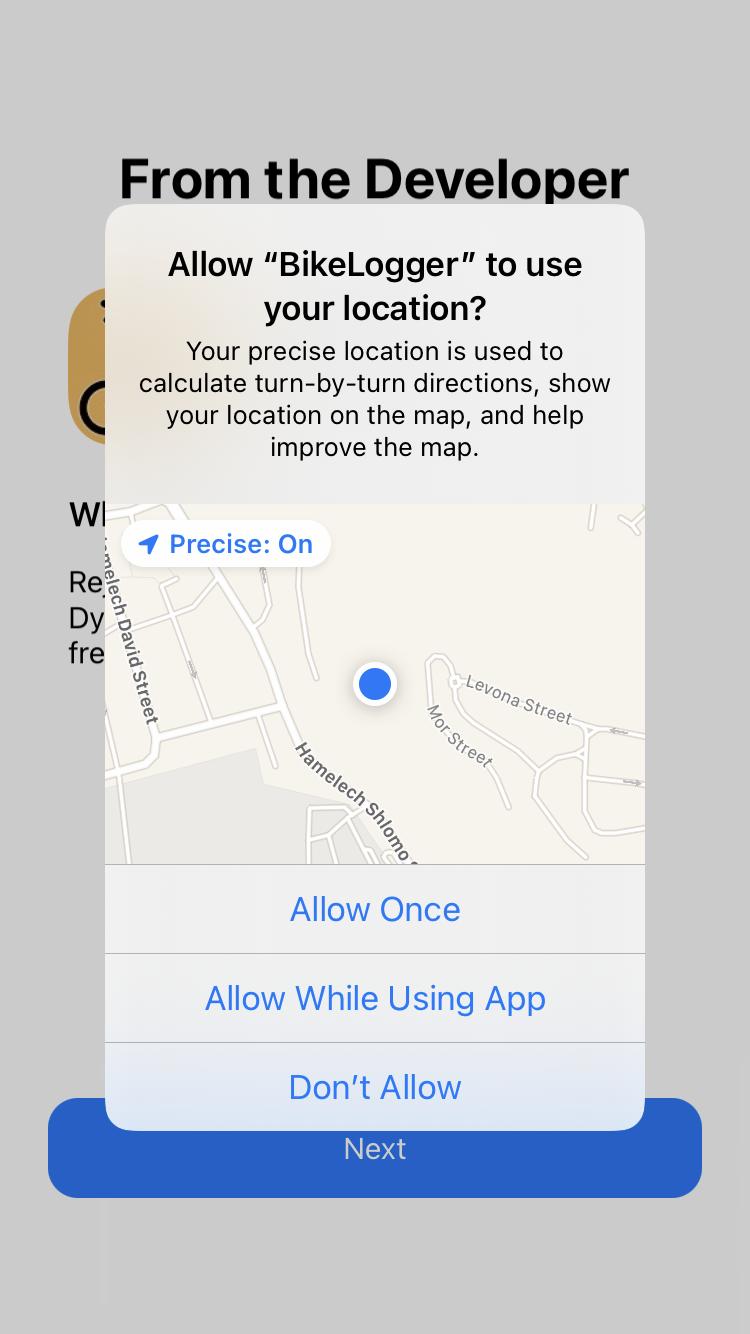
FR_06 The system requires explicit consent for data collection and access to GPS, Acceleromet er, Gyroscope and Magnetome ter.
This requirement is derived from the section A.2.1.
This feature must be implemented to comply with the General Data Protection Regulation. Must
This requirement is derived from Sec. 2
To enable the study of users' travel behaviour, the system must access the sensors’ stream, which will be collected and stored for this purpose. Must
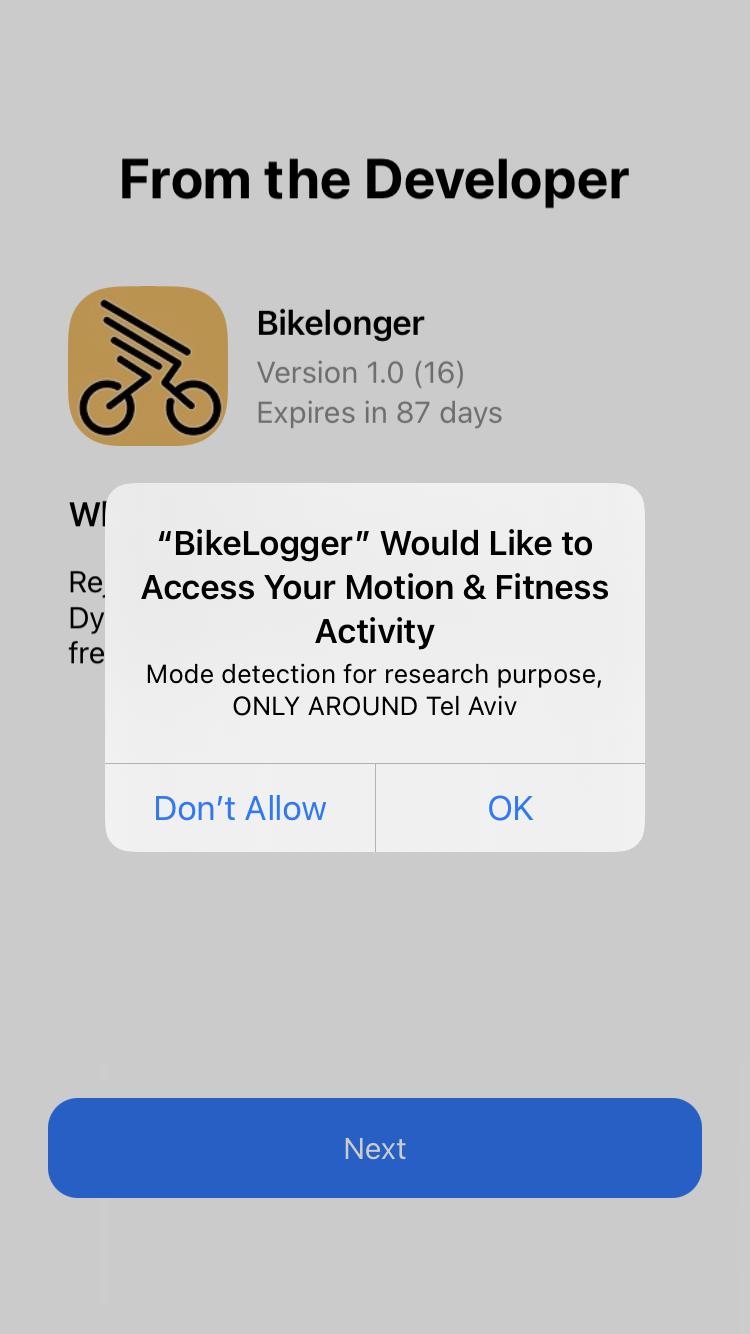
FR_07 The system requires explicit consent for activity monitoring online.
This requirement is derived from Sec. A.2.1.
To enable trip segmentation and smartphone battery optimization, thus to allow the study of travel behaviour while improving the user experience, the system must monitor users activity online, such as walking, cycling, stationary, vehicle - to name a few.
Must
FR_08 The system collects and stores user's trips history.
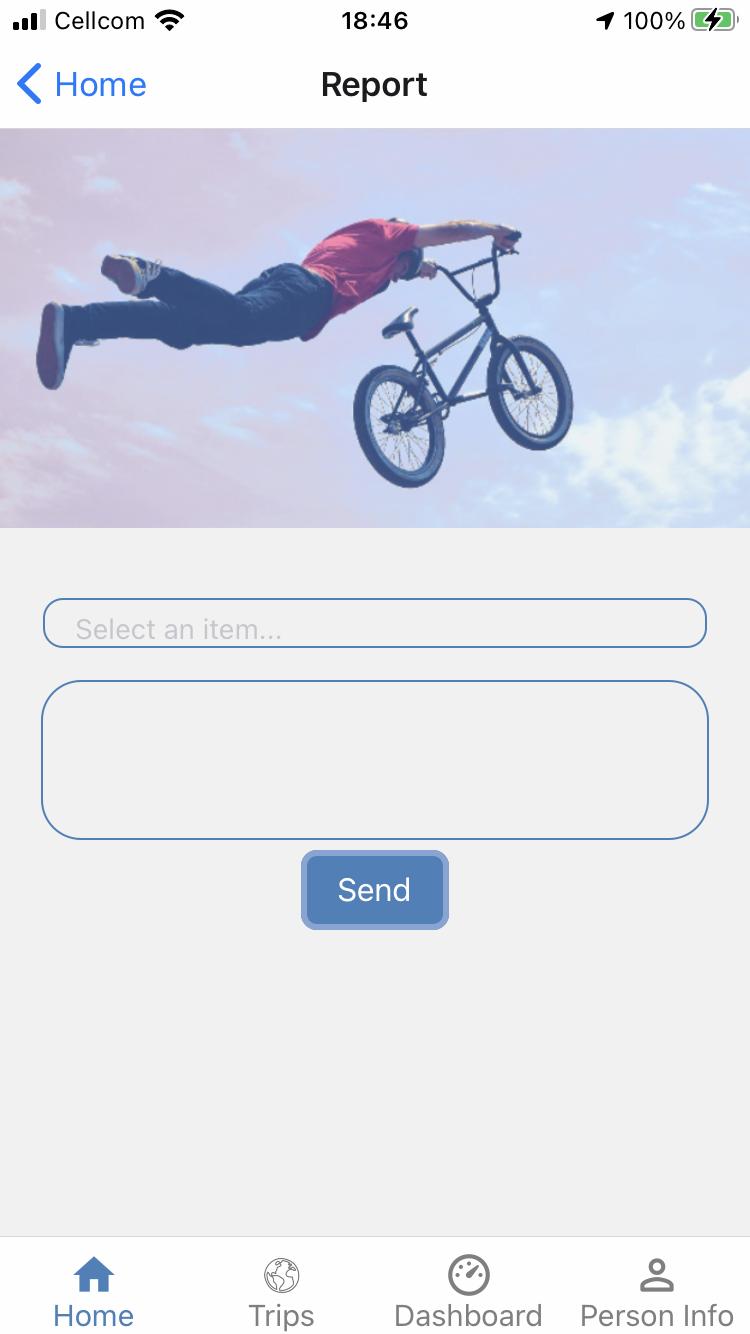
FR_09 The system allows collection and storage of geocontextual reports on the status of the road network infrastructur e.
FR_10 The system collects ground truth on users' bike trips.
This requirement is derived from Sec. A.2.1.
This feature is the foundation of a value creation model aiming to engage the user on the one hand, and to enable longitudinal survey of his or her cycling behaviour on the other hand.
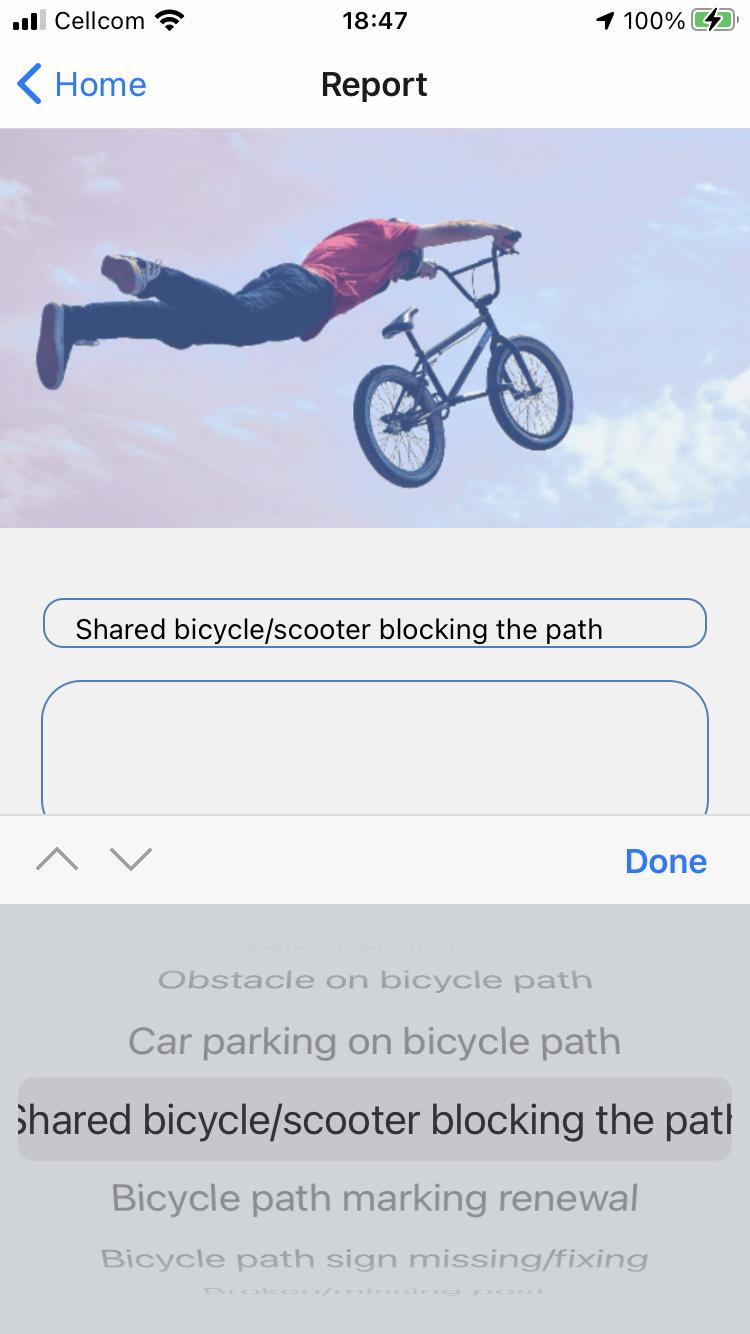
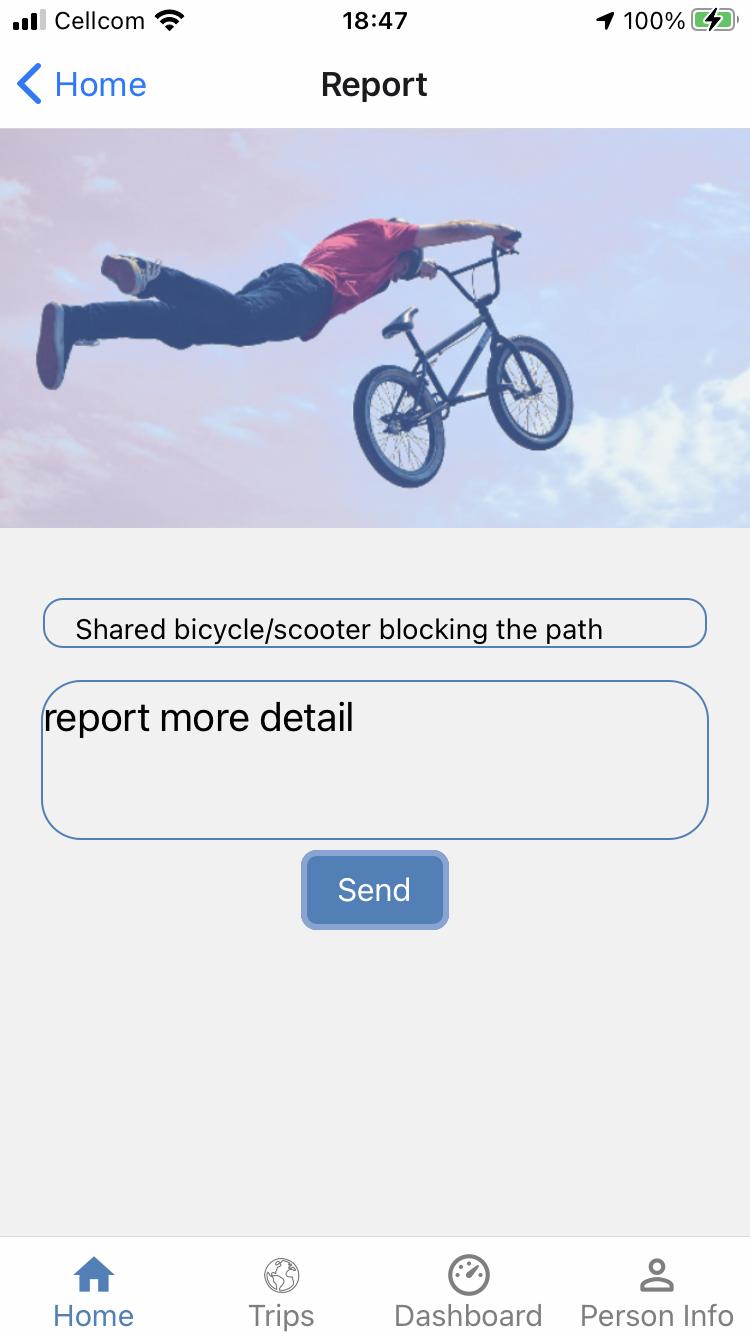
This requirement is derived from Sec. 2.2 This feature aims at empowering the users both as individuals and as community, towards the public authority. Reports must provide a label on the nature of the report, a time stamp, and a location. The report must include a text and could include an image.
Must
Must
FR_11 The system provides cyclist
This requirement is derived from Appendix 1
This feature must allow users to actively label their bike trips. To pinpoint users' bike trips, an independent measurement besides the sensors’ stream must be collected and stored in the form of labels and timestamps.
This requirement is derived from Appendix 1
Must
Must
friendly information, on map, about the road infrastructur e available.
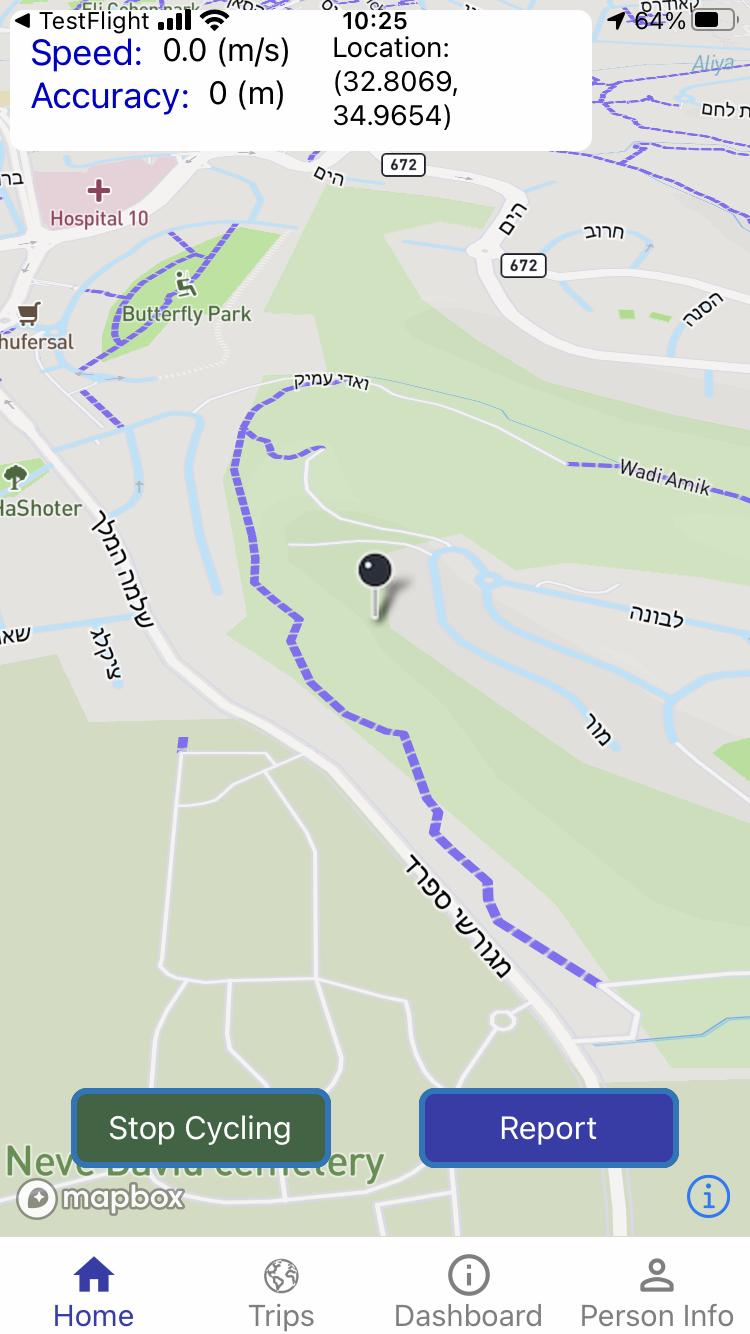
FR_12 The system provides a dashboard with trips’ speed and location on the map, in real time.
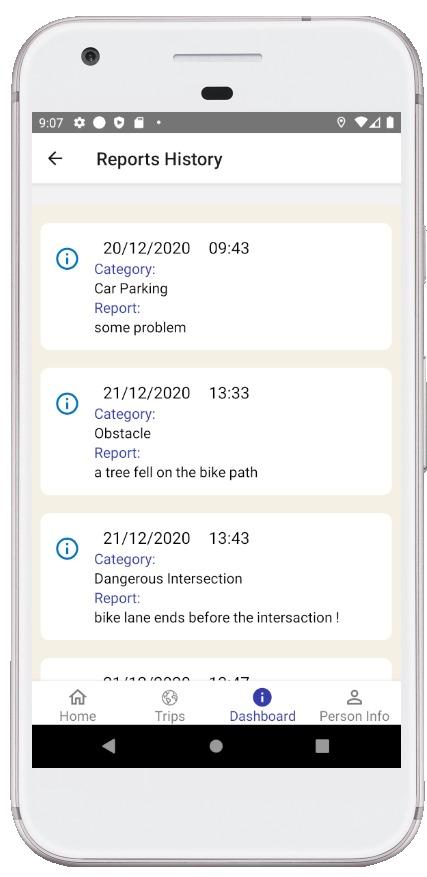
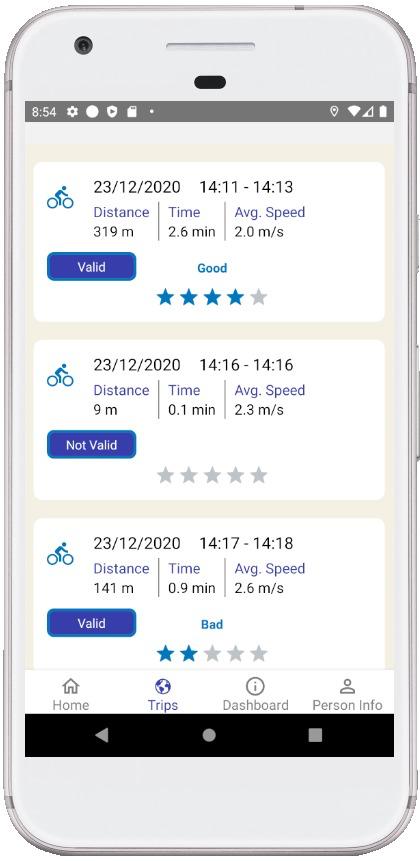
FR_13 The system presents users' trips history, including some principal features (statistics) of these trips.
FR_14 The system collects and stores optional users’ personal characteristi cs.
The feature must provide any information available on, e.g., OpenStreetMap, concerning bike dedicated infrastructure, or bike friendly infrastructure, to support users’ informed and independent route choices.
This requirement is derived from Appendix 1
To support the experience of users that keep the smartphone on the bicycle handlebar, to ease the interaction with the phone during trips, this feature must provide information on, e.g., current speed and position on the map.
This requirement is derived from Appendix 1
To improve users engagement and perceived utility of the application, this feature must organize users trips on the smartphone screen, presenting, for example, trip length, duration, startend-time, and average speed.
Must
Must
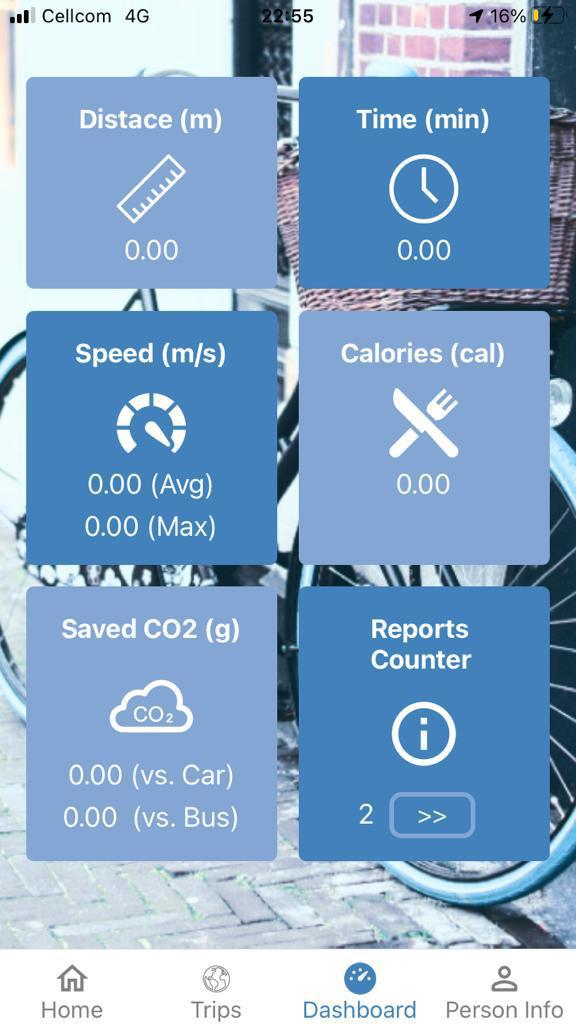
FR_15 The system computes a synthetic
This requirement is derived from Appendix 1
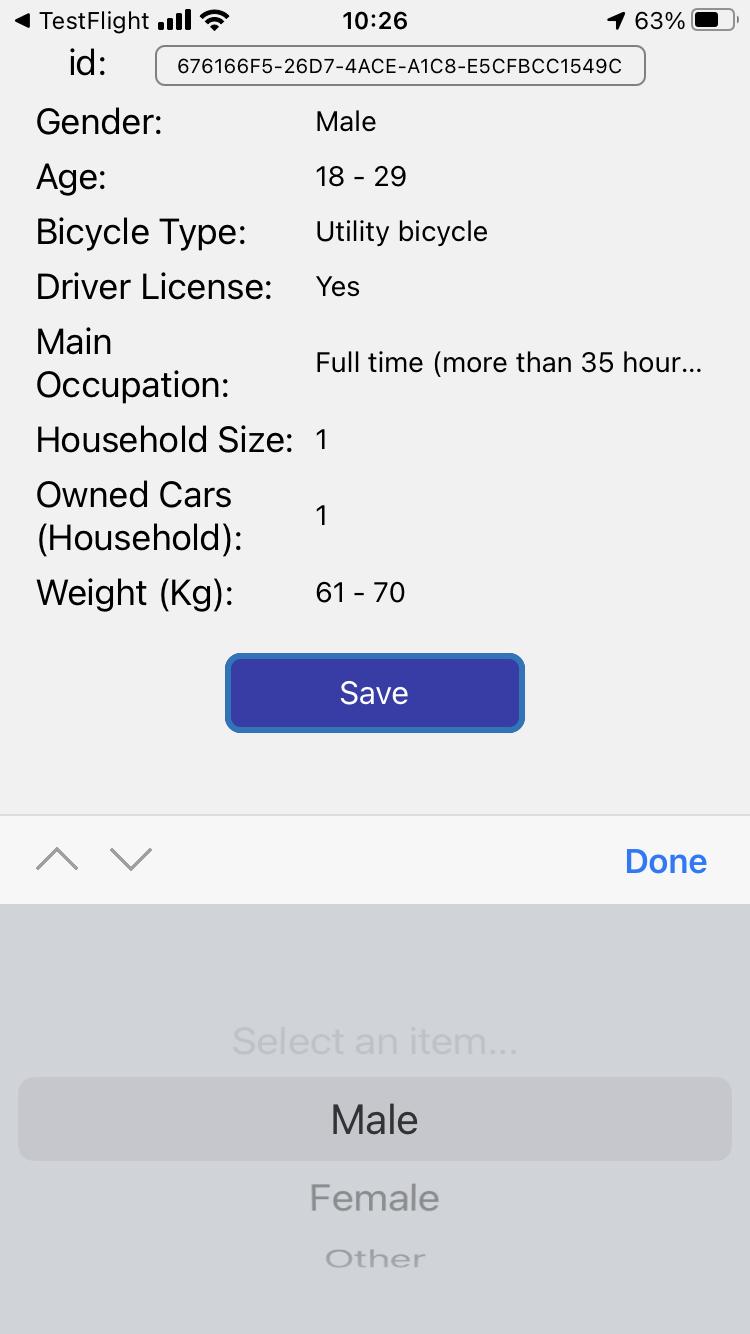
To provide the scientific community with meaningful information, thus enabling more accurate behavioural analysis, and to provide the users with better statistics on, e.g., calories burned, and CO2 impact reduction, this feature must allow users to specify optional personal attributes, such as age and weight fascia, bike type and gender.
This requirement is derived from Appendix 1
Must
Must
index based on multiple KPIs, over all user trips.
FR_16 The system collects GPS, Acceleromet er, Magnetome ter, and Gyroscope sensor data.
FR_17 The system allows sensors sampling setting variation, online, from the backend.
To engage the user in a sort of gamification of his or her contribution towards the improvement of both bike infrastructure and personal performance, this feature must allow computation of personal KPI, such as CO2 saved, calories burned, reports filed.
This requirement is derived from Appendix 1
To allow study of users' travel behavior via mode detection, purpose imputation and map-matching, this feature must enable collection and storage of GPS data up to 1Hz, and other sensors up to 50Hz.
This requirement is derived from Appendix 1
To allow optimal tuning of the sensors sampling frequency, which means maximum flexibility in sensors sampling collection at any time, for example to perform different studies on different subsets of users, and to reduce the load on the smartphone battery, this feature must allow dynamic variations on smartphone settings, seamlessly.
Must
Must
FR_18 The system allows automatic start and stop logging, when users’ trips start or end.
FR_19 In case of system termination, missing internet
This requirement is derived from Appendix 1.
To allow optimal trade off between data collected and battery discharge, this feature must enable automatic trip start and stop detection (e.g., stationary), and sensors must be turned on/off accordingly.
This requirement is derived from the Appendix 1, A.2.1, A.2.2.
To reduce trajectory gaps in case of voluntary, or accidental app termination, as well as in case of temporary internet
Must
Must
Security
Design and Usability
connection, or similar inconvenien te, the system allows local storage of the data.
NFR_01 The sensing platform components communicat e exclusively on encrypted channels, with official SSL certificates.
NFR_02 The content must be organized in a stack structure where screens are accessible from a main menu.
NFR_04 Content localization
unavailability, this feature must allow a limited data buffer to be stored on the smartphone device.
Supportabi lity
NFR_05
The system supports natively both iOS and Android
This constraint is derived from the Sec. A.2.2.
To protect users' privacy, and pursue CIA triad, this feature must be implemented across any communication channel among any module of the system.
Must
This constraint is derived from Appendix 1
It represents one of the core interaction design conclusions and it must be implemented.
Must
This constraint derives from Appendix 1. It represents one of the main challenges in order to achieve the browsing feature. It must be implemented and a Black Box Test will be performed on it.
This requirement derives from Appendix 1.
To enable the largest possible representativity of the users sample, this
Won’t
Must
mobile platforms. feature must guarantee that both iOS and Android can support the application.
NFR_06 The system is compatible with the software version iOS > 12.2 and Android > 22.
NFR_07 The system supports scalability and balance intensive loads.
This requirement derives from Appendix 1.
To enable the largest possible representativity of the users sample, this feature must guarantee that older versions of iOS and Android are supported.
Must
Implement ation
NFR_08 The system is divided into backand frontend components .
Interface NFR_09 The interface allows trajectory ground truth collection.
Legal NFR_10 The prototype includes detailed
This requirement derives from Appendix 1, A.2.1, A.2.2..
Intensive data collection and variable users load must be handled with a scalable architecture for both back-end and database. Both services must be PaaS, such as Heroky for the back-end and Mongo Atlas for the front-end.
This requirement derives from A.2.2 The service must be splitted in the two parts in order to allow specialization and distribution of the processing power between the two components, handling different operations.
This requirement derives from Appendix 1.
The user interface must include a button to allow users labelling bike trips, thus ground truth collection.
This requirement derives from Appendix 1.
Must
Must
Must
Conformity to GDPR will be considered for larger scale deployment, while Won’t
Help
GDPR information.
information will be provided via email during beta testing.
Will be considered for future development. N/A
Appendix 3 – Sensing platform design and deployment
The following sections present the solution selected and combined to fulfill the requirement specification: a) we present an overview of the high level architecture that supports the service pipeline, b) we describe the data model, and c) we present the front- and back- end infrastructure.
A.3.1 – High Level Architecture
Most of the functional and nonfunctional requirements demand a high-availability architecture in the backend and low level control of sensors on the smartphones. The implementation and management of the first can be avoided by leveraging on PaaS solutions, which we choose to host a Node.JS back-end, MongoDB database and Map tiles server. For the second, we design and implement sensors, data management and automatic trip detection algorithms, specifically for native iOS and Android platforms. For the User Interface (UI), we rely on Native React, which allows development of a cross platform interface, suitable for both operating systems (iOS and Android) smartphones. This architecture, depicted in Figure 3, fulfills the requirements specified in FR_08, FR_09, FR_11, FR_14, FR_15, FR_16, FR_17, FR_18, FR_19, NFR_01, NFR_05, NFR_07, NFR_08.

A.3.2 – Data Model
To support the transport behavioural studies, which include passive collection of users’ trips, the active collection of trips’ ground truth, reports on the infrastructure, and optional personal identifiable information, we design and implement the data model described in the following Figure 4. This model fulfills the requirements described in FR_08, FR_09, FR_10, FR_12, FR_13, FR_14, FR_15, FR_16, FR_17, FR_18, FR_19.

A.3.3
– Front-end
This component is confined in the executable application that can be downloaded and installed on smartphones from Appstore for iOS, and from Google Play for Android. Each application is the hybrid combination of two subcomponents:
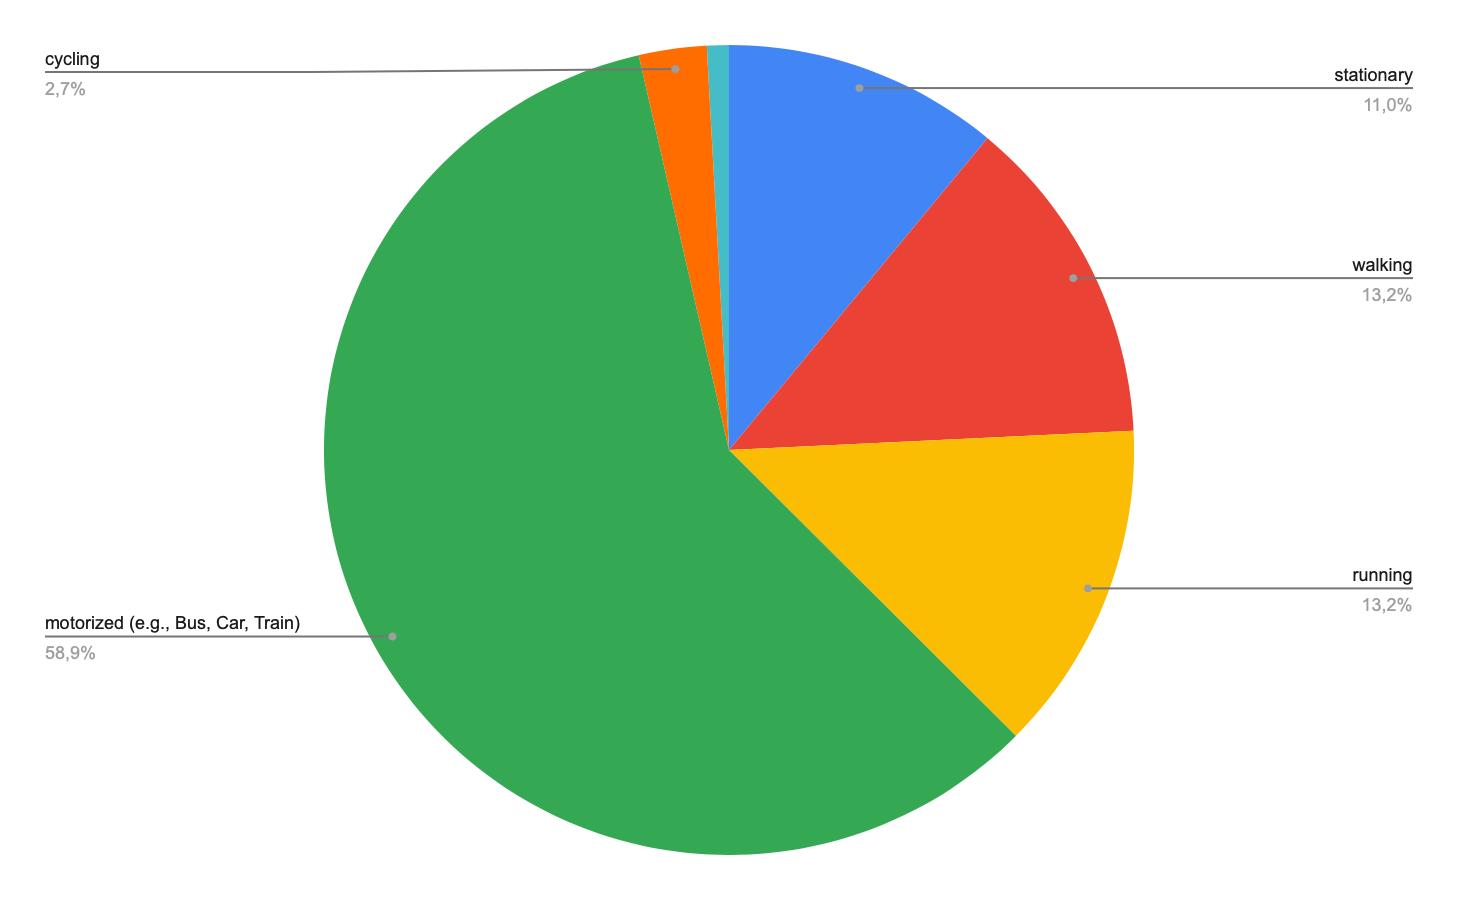
a. Low level algorithms that manage sensors, and sensor data, including both local storage and transfer to database through the back-end. This core functionality is identified by the Trip Logging Manager (see context diagram and information flow diagram), which is specific for each smartphone operating system. This manager classifies all the points online according to one of these transport mode labels: walk, cycling, automotive, running, stationary, unknown (see class diagram). Mode detection allows automatic switching on and off the logger. When the logger is being switched off, either after 40 seconds of inactivity, or upon request of the operating system, the algorithm assigns a geofence centered in the last position of the smartphone, with 30 meters of radius. The operating system is able to detect whether the smartphone exits this geofence, even when the application is
terminated. In case the smartphone exits the geofence, the smartphone operating system activates the application and performs the logging operations in the background. In these phases, any logged data not yet transferred to the back-end is stored locally, and retrieved as soon as the application restarts.
b. User interface, which allows any active interaction between users and system (see Fig. 5).
To allow cross compatible user interface, all functionalities exposed to the user, and described in the context diagram in Figure 5, are implemented in Native React, and fulfill the following requirements: FR_03, FR_04, FR_05, FR_06, FR_07, FR_08, FR_09, FR_10, FR_11, FR_12, FR_13, FR_14, FR_15, FR_18, FR_19, NFR_05, NFR_08, NFR_09, NFR_10.

A.3.4 – Back-end
The back-end exposes the APIs necessary for the front-end to perform the functions described in the context diagram, which fulfill all requirements specification. Specifically, these API’s - see information flow diagram in Figure 6 - perform the following tasks:
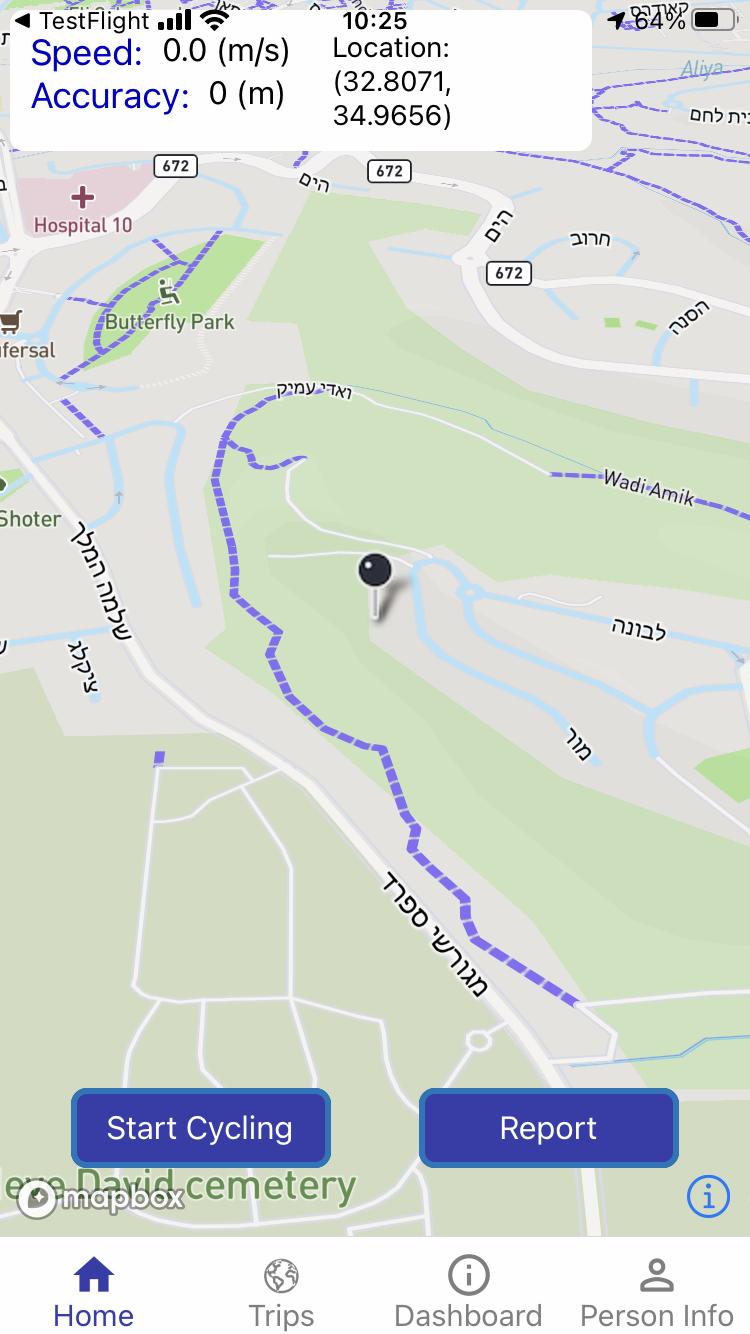
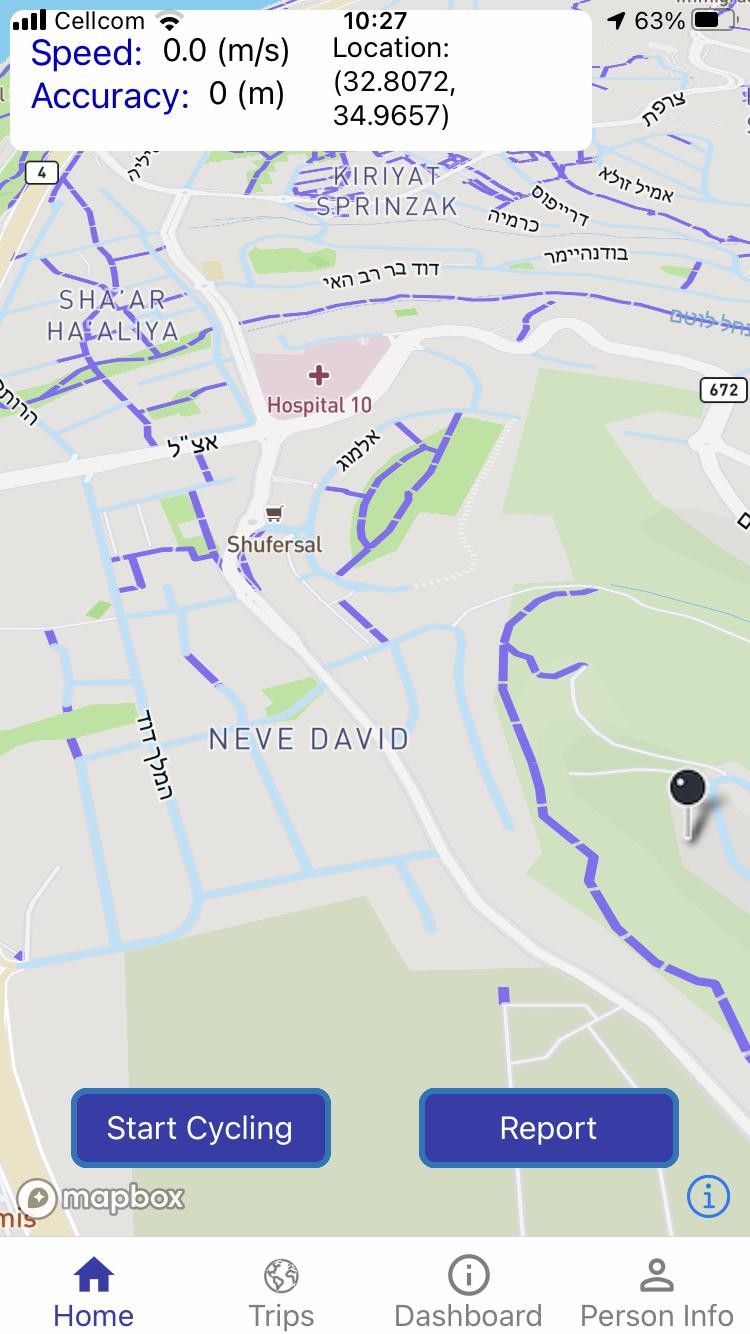
a. Trip Logging API: this task is responsible for collecting trip data from all the active smartphones, and handling the data and information to the database. This API provides GPS trajectories, filtered by trip mode, and temporal, spatial, and user identifiers, when the front-end requires it to present the data and information on the user interface.
b. Reports API: this task collects reports that users can provide on the state of the road infrastructure (see data model). The API also counts and lists the reports for the front-end, to be displayed on the user interface.
c. Trip segmentation API: this task collects from the database the raw trajectories classified as cycling beforehand, online, on the smartphone device. These trajectories are segmented whenever the time
gap between two GPS points (in a single trajectory) exceeds the 60 seconds threshold. For every trip, the API computes total travelled kilometers, trip duration, average- max- and min- speed, calories burned and CO2 saved with respect to car and bus trips. For calories and CO2, the API assumes default values, which are substituted by real values presented by the front-end and fetched from personal information (see data model) whenever available.
d. Personal Information API: this task allows the collection of optional personal information useful to improve precision on calories and CO2 performance of the trip, as well as following behavioural studies. This information is available on the user interface. To save some unnecessary data traffic with the back-end, which could be triggered by the front-end any time the user accesses his/her trip performance score and ranking, this information is stored also on the smartphones.
e. First Access API: this task is responsible to authorize the user access. Since no user identity is necessary for the service to work, this API is triggered after the user authorizes the front-end access to smartphone sensors and activity detection, and verifies whether the user already has an assigned pseudonym. In case this pseudonym exists, the API retrieves the user’s history. The user pseudonym is like a shared secret and allows access to all the APIs. To ease the user access with standard login/signup procedures, while avoiding any identity management, in future development this API can be connected to external Identity Providers (e.g., OAuth standard).

Information flow diagram.
6.