
LINC Project: Autonomous public transport and urban planning
Self-driving shuttles
– well on the way or slightly in the way?
User perspectives and interactions with other road users

Project acronym LINC-TUPPAC (UIA02-227)
Project name Transforming Urban Planning; Providing Autonomous Collective Mobility
Project management Gate 21
Duration 2018‒21
Website https://lincproject.dk/
Deliverable number Output 5.1.1
Work package Work Package 5: Test-bed experiments, data gathering and analysis
Responsible partner Roskilde University (RUC)
Contact person: Thomas Budde Christensen
Contributing partners Technical University of Denmark (DTU), Nobina Denmark A/S, IBM Danmark ApS
Authors Hannah Villadsen (RUC), Thomas Budde Christensen (RUC), Dan Roland Persson (DTU), Valentino Servizi (DTU)
Date 27.11.2021
Self-driving shuttles
– well on the way or slightly in the way?
Research report on user perspectives and interactions with other road users during testing of self-driving shuttles in mixed traffic on the DTU campus, April–November 2021
Hannah Villadsen
Thomas Budde Christensen
Dan Roland Persson
Valentino Servizi
1 F OR EW ORD
The testing of self-driving vehicles in Denmark has been a challenge for authorities, companies, and research institutions These bodies had to move onto new ground to build the knowledge and capacity necessary for society to make informed decisions about how, when, and whether self-driving technology should be implemented in traffic in Denmark.
LINC is one of a handful of Danish projects that in recent years have tested autonomous public transport – a prospect which, depending on how the technology and its implementation develop, may contribute to the strengthening of public transport and to a greener and more inclusive transport system.
The LINC project has been a collaboration between seven public and private partners, who for three and a half years have investigated the potential for a self-driving first and last mile solution in connection with the forthcoming Copenhagen Light Rail Those partners are: Albertslund Municipality, Gladsaxe Municipality, Nobina Danmark A/S, IBM Danmark ApS, Technical University of Denmark (DTU), Roskilde University (RUC), and Gate 21. The project is funded by the partners and by the EU programme, Urban Innovative Actions (UIA), which contributed 25 million Danish kroner.
This report describes experiences from the road test carried out on the DTU campus. The data collection and data analysis were undertaken collaboratively between the partners, and drew on competencies from several professional specialities and fields, which contributed in various ways to the overall knowledge-building in the LINC project.
1.1 THE AUTHORS
Hannah Villadsen, post-doc at the Department of People and Technology, METRIK group (Environment, Energy, Transport – Regulation, Innovation and Climate Policy) at RUC. Hannah has a background in behavioural science and her research focuses on the interplay of technology, organisation, physical planning and people in transforming the transport sector. She was responsible for the development, implementation, and analysis of the questionnaire surveys, for stewards’ education in data collection, test bed observations, interviews and focus group interviews on the DTU campus, and contextual interpretation of data from the digital platforms. Hannah is the lead author on the compilation of observations, data, and analyses in this report.
Thomas Budde Christensen, Associate Professor at the Department of Humanities and Technology, METRIK Group (Environment, Energy, Transport – Regulation, Innovation and Climate Policy) at RUC He was responsible for the overall project management of the LINC project’s work package 5, which includes the study of user perspectives and interaction with other road users.
Dan Roland Persson, PhD student at the Department of Applied Mathematics and Computer Science – Cognitive Systems, DTU. Dan’s research focuses on user experience, context-aware technologies, and micro-interventions. Previously, he worked for the LINC project as a research assistant and full-stack developer. As a research assistant he built several of LINC’s software solutions and much of the infrastructure, including the steward app and backend used to collect events data
Valentino Servizi, PhD candidate at DTU, in the Machine Learning for Smart Mobility (MLSM) group. His research focuses on smartphone-based travel surveys. In particular, he is interested in machine learning methods for classification of time-series data generated by smartphones in combination with the Internet of Things. Valentino was a member of the LINC team that designed and implemented the smartphone sensing platform, and its integration with the self-driving shuttles’ telemetry. Using collected data, he worked on methods for detecting the presence of passengers aboard LINC shuttles.
Rawmobility, a traffic analysis company in Copenhagen, was responsible for video recording and digital video analysis of traffic conflicts and near-conflicts in the interaction between the self-driving shuttles and other road users.
2 I NTRODUCTION
In 2018, construction work began on Copenhagen’s Light Rail, with the expectation that the first passengers will board in 2025. Its success will depend on people who today take the bus or drive their own cars choosing instead to use the new line. One way to encourage this is to develop efficient and comfortable ways to get from homes and workplaces to a Light Rail stop.
The LINC came about after Nobina Denmark contacted Gate21, with a view to establishing a consortium of partners who saw advantages in a project to develop the foundation for a self-driving first and last mile solution for Copenhagen Light Rail.
In the autumn of 2017 the partner group received funding from UIA to launch the LINC project In addition to the testing of self-driving shuttles in mixed traffic, it includes studies of the potential of collective self-driving mobility and options for supporting data and infrastructure development.
A central objective of the LINC project is to build a Danish experience base in the operation of self-driving public transport. To this end, two test beds were selected: the DTU campus in Lundtofte and the Hersted Industrial Park in Albertslund. They would be the sites for the testing of three self-driving shuttles The two test beds are very different, and are both within the potential catchment area of the Copenhagen Light Rail.
2.1 TEST AT THE DTU CAMPUS
The road testing of the self-driving shuttles on the DTU campus took place from 19 April to 5 November 2021. The test elements ranged from the vehicle scale to the technical challenges of making the self-driving shuttles operate properly over a prolonged period to the urban planning scale. The project’s experiences contribute to analysis of what perspectives the new vehicle type has for urban development and public transport.
This report specifically describes: experiences from operation of the self-driving shuttles on the DTU campus; their effects in a specific traffic context; where there are potential customers for a self-driving bus operation; and where many different uses and users coexist in a small, delimited area. By describing in detail how they were put into operation, and the reactions and effects they caused, a detailed picture can be drawn of how self-driving shuttles at their current technical stage are experienced by the people who use them, and how they affect and are affected by other road users.
We call this layer in the project “user perspectives”, and by “ users ” we mean both passengers on the selfdriving shuttles and other users of the area in which they operate. The applied survey design was developed to illuminate user perspectives from two angles: 1) the expectations and requirements that potential passengers at DTU have for a collective self-driving transport solution, and how this matches their actual experience of the self-driving shuttles, and; 2) a more traffic-oriented quantitative and qualitative description of characteristics and challenges in the interactions that took place between the self-driving shuttles and the other road users – pedestrians, cyclists and motorists – on the campus during the test
As mentioned, the original intention was to test in two very different traffic context, namely the DTU campus and Hersted Industrial Park. As it took longer than expected to obtain a permit from the Danish Transport Authority and the Danish Road Directorate, the road test could be carried out only on the DTU campus within the project timetable. The intention was to use experiences from DTU, where traffic speeds are low, as a starting point for putting the self-driving shuttles into operation in Hersted, where traffic speeds are higher and there is a larger proportion of heavy vehicles. As this remains an important next step for the development of self-driving public transport, we have maintained this focus on user expectations and traffic conflicts despite the cancellation of the road test at Hersted Industrial Park. The analytical approach in the
work described in this report therefore seeks to provide a thorough description of the potential traffic conflicts and users ’ expectations of the technology. These aspects together form an important basis for understanding how the shuttle would function in a less protected traffic environment.
This report describes the methodological approaches developed in the project to investigate the interactions between self-driving shuttles and other road users, and the project’s findings in the form of observations, user expectations, and experiences.
2.2 CORONAVIRUS RESTRICTION AND CLOSURE OF CAMPUS DURING SPRING 2021
As mentioned above, the test was carried out from April to November 2021, in part during a period when both the education sector and public transport were subject to restrictions because of the coronavirus pandemic. The DTU campus was almost entirely depopulated from the spring of 2021 until the beginning of the autumn semester on 1 September 2021.
In the period before the road test, and before the suspension of on-campus teaching, more than 400 people signed up for the LINC project’s user panel as test passengers. Since most were either students or employees at DTU, the transition to virtual teaching resulted in fewer opportunities to use the self-driving shuttles after they were put into operation.
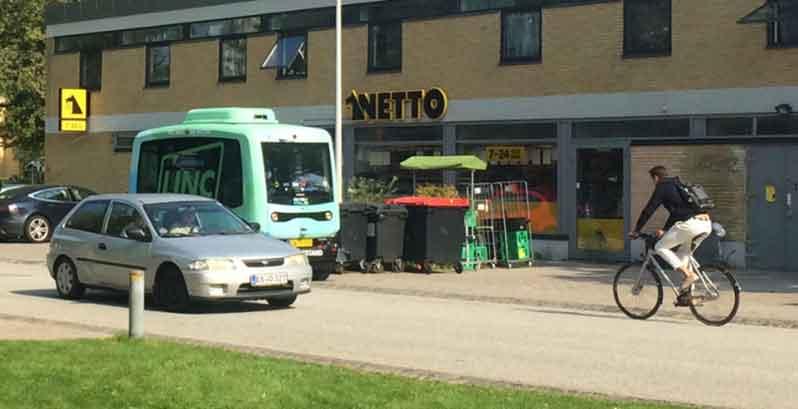
Potential passengers and informants therefore had to be sought during this period from among those on the campus despite the closure of the physical university. Several small private companies on campus did not close, and despite the closure there was also a lot of traffic, with construction vehicles and vans that had errands on campus. Some of the residents of the dormitories on campus departed, but there was still some traffic to and from the dormitories and around the on-campus grocery store, Netto.
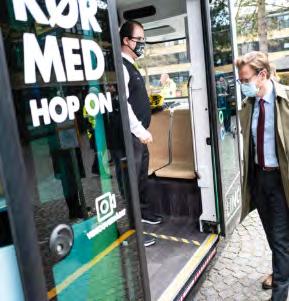
Despite the coronavirus restrictions on public transport in the spring of 2021, interested parties were invited to board the self-driving shuttles free of charge at any of the route’s stops throughout the test period. However, the restrictions required that we take a maximum of only three passengers on board at a time, and that passengers and stewards wear masks
Despite the reopening of society over the summer, it was not until the start of the new semester around 1 September 2021, that students started to return to campus in numbers. Thereafter, there was a marked increase in activity on campus in terms of walking, cycling, and motorised traffic.
3 M ET HOD
The partner group behind the LINC project reflects that the implementation of self-driving collective mobility presupposes competencies in several fields. They include urban and transport planning, IT infrastructure, bus operation economy, traffic safety, and user acceptance. To be able to present as nuanced and accurate a picture as possible of the different user perspectives, we have drawn on competencies within the project consortium and developed methods based on the development of a digital platform for data collection in real time, questionnaire surveys, and fieldwork. In particular, it was necessary to develop methods to describe how the interactions between a self-driving vehicle, other road users, and the specific geographical context unfold concretely and over time.
3.1 MAPPING OF TRAFFIC INTERACTIONS
The self-driving shuttles used in the project were assisted by a steward, whose primary task was to supervise the driving and take control of the shuttle whenever the self-driving technology could not independently solve the driving task. The presence of stewards on the shuttles also made it possible to identify and record traffic situations in which the self-driving shuttles were challenged. (See chapter 6 for a detailed description of the stewards’ function.)
To document the many observations that the stewards made on the route, it was important to develop a method of recording them without too much delay. Ideally, the stewards should be able to report each experience as soon as it happened, describing it as closely as possible. For this purpose, a special app was developed in the project for use by the stewards. The app was to be used in real time to categorize and time-stamp particularly noteworthy or problematic events. The categories were selected based on observations from the route, and were developed in collaboration with the stewards in the first weeks after operations commenced
The registrations took place on a smartphone placed next to the shuttle’s control panel. Figure 3.1 shows the screen that was active when driving Events are recorded with a single tap on the screen. In addition to the ability to register an event in one of the fixed categories, the steward can add a written or spoken comment to a registered event, using the app. Comments can be written or recorded only when the shuttle arrives at a turning point, as the stewards must give their full attention to the traffic while driving.
F IELD WORK


Throughout the road test, researchers were present in and around the self-driving shuttles. They observed and noted conditions regarding operation, safety, and traffic, and were in regular dialogue with the stewards. These observations were documented in the form of field notes, photos, and sound clips. They were integrated into the work of adapting operations, routes, and data collection.
In addition to interviews with stewards in the shuttles during operation, a focus group interview was held with all active stewards one month after the shuttles were put into operation. Its purpose was to provide an early insight into the difficulties the stewards experienced on the route, and to gain collective validation of the relevance of the categories of events that all the stewards were trained to register
F IGURE 3.1 S TEWARD APP
LINC report: User perspectives and interaction with other road users at the DTU campus
G EOLOCATION OF EVENT REGISTRATIONS IN THE STEWARD APP
As data were collected, it became clear that the registrations in the steward app ran into many hundreds, and that there was often no time to give a detailed explanation of a registration. To form an overview of the connection between the registrations and the specific traffic, infrastructure, and social context, it was decided to compare the registrations in the steward app with the self-driving shuttles’ GPS data. By locating the records on a map and noting the density of records on different route sections during different periods, the project was able to analyse how categories of events were distributed spatially and temporally on the route.
V IDEO ANALYSIS OF TRAFFIC AND INTERACTIONS WITH O THER ROAD USERS
From the stewards’ observations and the geolocations of problematic interactions with other road users, a central intersection where there appeared to be a particularly high number of conflicts and unclear situations was selected for video analysis. A camera was installed to record all interactions on a single day. The video was subsequently digitally processed by Rawmobility, a traffic analysis company. All road users’ routes through the intersection were tracked and printed as individual lines on a photo of the area. This showed how road users negotiated the intersection. The digital processing of the video also mapped the speeds and duration of stops. From these data it was possible to identify atypical or problematic situations, which were extracted for independent qualitative analysis.
3.2 INSIGHT OF POTENTIAL PASSENGERS’ EXPECTATIONS AND WISHES, USING QUESTIONNAIRE AND INTERVIEWS
In parallel with the study of how the interaction with other road users on the DTU campus developed, we wanted to know the attitudes of the potential passengers and their requirements of a self-driving shuttle service. Data were collected partly through questionnaire surveys sent to LINC’s user panel, and partly through travel-along interviews with passengers whom we met in the self-driving shuttles. Early in the planning of the project, we conducted a focus group interview with DTU employees and students. Its purpose was to aid the design of the road test by learning about potential users’ views on the need for mobility on campus and their understanding of the potential of self-driving technology. Insights from the focus group interview were used to develop the questionnaire surveys.
QUESTIONNAIRE SURVEYS
LINC’s user panel answered four questionnaire surveys during the project period. Three of these had RUS as leader, and addressed: 1) the user panel’s mobility at DTU, their attitudes to new technology and their expectations of self-driving vehicles; 2) the user panel’s views on how self-driving mobility could be implemented in everyday transport, and; 3) the user panel’s experiences with the self-driving shuttles on campus. Finally, DTU conducted a Stated Preference study to estimate the user panel’s willingness to pay and the self-driving shuttles’ potential market share in competition with other forms of mobility. The results of the Stated Preference study are reported separately.
T RAVEL - ALONG INTERVIEWS
Throughout the road test period the researchers spent time on campus, riding on the self-driving shuttles and talking to passengers and interested passers-by. To maintain the impressions from conversations and observations, we engaged in travel-along interviews. This interview form is well suited to the short conversations that are practicable with passengers on the self-driving shuttles. These conversations were not guided by a formal interview guide, but unfolded around the topics that seem to interest the passengers in relation to the shuttles, and which came up in informal conversation. The interviews were subsequently documented in diary form, where the interview is reproduced with the researcher’s reflections.
Vehicle characteristics and the operational set-up
4
T HE CHARACTERISTICS OF THE SHUTTELS AND THE OPERATIONAL SET - UP

4.2 TECHNOLOGY AND PROPERTIES
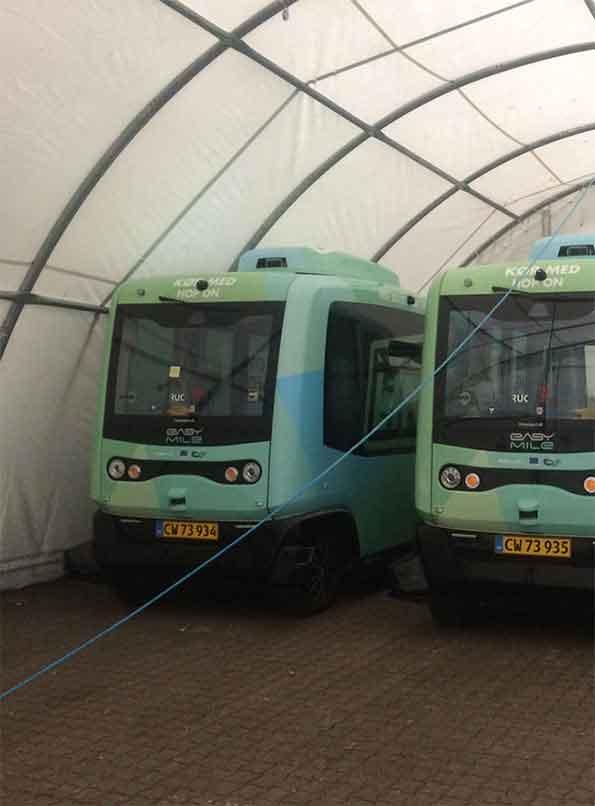
The self-driving shuttles used in the LINC project are EZ10 models from the French manufacturer, EasyMile. During the test at DTU, they were operated at SAE level 3 1 The SAE levels range from 1 to 5 and describe the degree of autonomy. At level 3, the vehicle handles the driving task under certain conditions; e.g., on a special route. At level 3 it is necessary to have a person in the vehicle who, at any time, can assume control of it
4.1 THE INTERIOR OF THE SHUTTLE
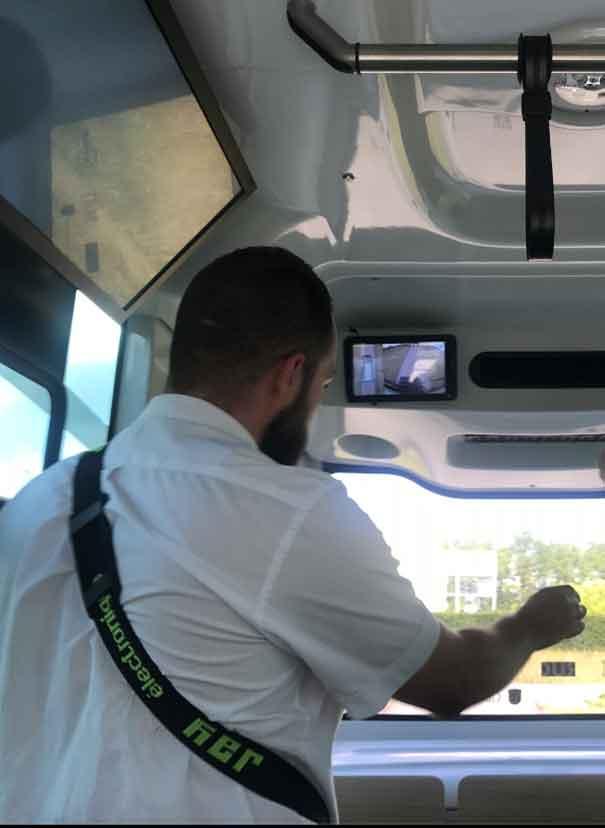
There is no driver’s seat or steering wheel in the shuttle, as it is designed to be used exclusively as a self-driving vehicle. It is operated through a control panel in the shuttle. It has six seats, placed in groups of three in the front and rear (Photo 4.1). As the shuttle can run in both directions, it is front–rear symmetrical For standing passengers there are handles in the ceiling. The seats are not equipped with seat belts or upholstery. The steward is instructed to stand in the middle of the shuttle, with a full view of the traffic in front of the shuttles and of a monitor above the windscreen, which continuously shows a realtime simulation of other road users all around the shuttle, based on footage from cameras mounted on the shuttle. We have been unable to accommodate wheelchairs.
A basic premise of testing a technology not yet fully mature is that its specific characteristics at a given stage affect any predictions of the potential and weaknesses of a future service employing a future, fully matured technology. The test at DTU (as in other tests of self-driving vehicles) partly reflects the characteristics of the specific self-driving vehicles and their current maturity, and partly the social, traffic-related, and infrastructural characteristics of the specific context in which they are deployed
The shuttle’s self-driving properties can be divided into three basic elements: 1) location and orientation, which ensure that the shuttle will not run except on its designated route; 2) detection of surroundings and possible obstacles, which ensures that it will not run into something or someone, and; 3) observation of coded rules for each selection of the route (e.g., speed and requirement for place-specific verifications from a security person, to ensure that operation is in accordance with the conditions and with the authorities’ approval.
To be able to make sense of the shuttles’ driving pattern, two principles in particular must be described in more detail: the labelling of potential obstacles, and the dependence on driving on a fixed track. When the
1 https://www.sae.org/blog/sae-j3016-update
P H OTO 4.1 S HUTTLE S ’ INTERIOR
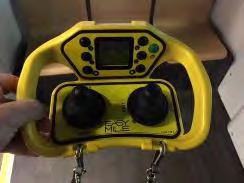
route is decided upon, the shuttle is driven around the route in manual mode by means of a device resembling a joystick. While moving around the track, characteristics of the surroundings are mapped by the shuttle’s sensors and GPS. This mapping of the surroundings is used to establish a reference map, from which the vehicle can subsequently compare inputs from sensors during operation in autonomous mode to confirm its exact position.
In addition to the use of complex mapping of the surroundings, the self-driving shuttles can detect objects in their vicinity. An obstacle entering the nearest safety zone around the shuttle while it is moving in autonomous mode will cause the shuttle to make an emergency stop. Objects that are detected more peripherally, but still within the range that the shuttle’s sensors monitor in order to avoid collisions, will result in its speed being reduced.

The technological set-up of the shuttles used in the LINC test means that they move on a virtual track, which is programmed and from which the shuttles cannot deviate while in self-driving mode. Thus, if for traffic reasons there is a need to deviate from the programmed track, the onboard steward must switch to manual mode and direct the shuttle around the obstacle with the joystick. Once the obstacle has been passed, the shuttle must be driven back onto the virtual track and switched back to autonomous mode.
As part of the safety protocol, a series of points were included where the steward was required to confirm that there was a clear lane before the shuttle drove out at an intersection or made a turn. If the steward did not do this, the shuttle would automatically stop and wait. Thus, there were situations where it became a matter of definition as to whether the shuttle was self-driving, if “self-driving” is taken to imply that the vehicle makes safety-sensitive traffic decisions autonomously.
4.3 SIGNAGE
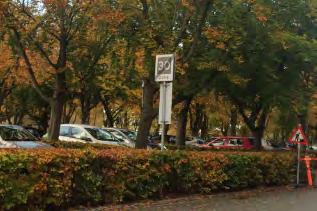
During the project’s test period, various small signs were erected.
1)Signs at the entrance and exit of the test area, indicating a speed limit of 30 km/h (Photo 4.2).
2)Signs informing road users that self-driving shuttles are being tested. These signs also function as reflectors, providing additional reference points for the shuttles’ sensors (Photo 4.4).
3)Signs limiting stopping and parking, where there is insufficient space for the shuttles to pass if vehicles are parked at the kerb
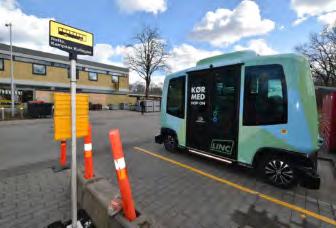
4)Signs at shuttle stops. Their design is similar to public transport signage in Denmark (Photo 4.5).
The signage contributes to route safety. Speed limits, information for other road users, and the LIDAR reflectors are all elements that EasyMile recommends in its analysis and safety assessment of the test route, and which form part of the basis for the authorities’ approval of the project.
P HOTO 4.2 S PEED LIMIT – SIGNS AT CAMPUS ENTRANCES AND EXITS
P HOTO 4.3 LINC EVENT 2021
4.4 THE USER APP, AND THE INVOLVEMENT OF PASSENGERS AND OTHER INTERESTED PARTIES
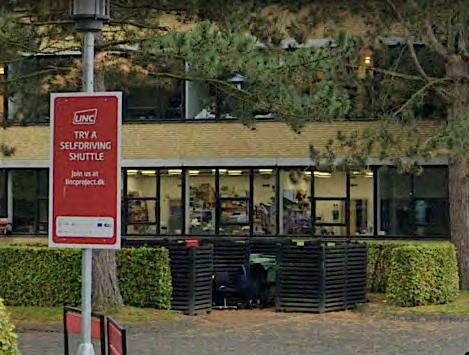
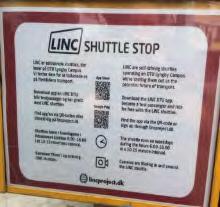
Information about the project’s website was made available to those on campus via information signs, through DTU’s information channels. Passers-by could read about the project at the eight stops (Photo 4.6). All interested parties were invited to register as test passengers and join the user panel, which received news updates and questionnaires. It was also possible to download a user app, developed to offer passengers information about the route. In the app, it is also possible to track the position of the self-driving shuttles in real time. Users of the app who had accepted the privacy terms for tracking on campus also contributed data on the use of the self-driving shuttles.
The shuttles were free of charge, and anybody was welcome to test them.
P HOTO 4.4 I NFORMATION AND REFLECTOR SIGN P HOTO 4.5 S HUTTLE STOP AT N ETTO /K OLLEGIEBAKKEN
P HOTO 4.6 INFORMATION TEXT AT SHUTTLE STOP S

The test bed – the infrastructural and social context
5 T HE TEST BED – THE INFRASTRUCTURAL AND SOCIAL CONTEXT

The specific context around the chosen route both defines and delimits what we can observe during the test, as it is these factors that determine the types of situations that the self-driving shuttles must navigate. A thorough description of the context is therefore necessary in order to assess what conclusions can be drawn, both internally in the project, and externally in relation to future projects, analyses, and perspectives for implementation DTU’s main campus is located north of Copenhagen, near Lyngby. There are more than 100 buildings in an area of just over one square kilometre, divided into four quadrants – originally intended as a reference to a co-ordinate system. When determining the test route, there were many possibilities and many considerations. For practical reasons it was a priority to avoid – as far as possible – the many areas where road work was planned due to the construction of the Light Rail
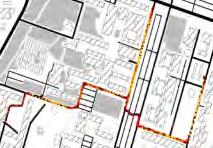
It was decided at an early stage not to pass Anker Engelunds vej, which runs east–west and is the busiest road on campus. This was because there are no light regulations that could have simplified the shuttles’ passage. As the road is relatively wide and busy, the partner group concluded that it would be too difficult to obtain approval of a route connecting north and south on campus. Due to the many planned road works north of Anker Engelunds vej, it was decided that the test route should connect points in the third and fourth quadrants, south of Anker Engelunds vej. The two quadrants are marked with a blue oval on Map 5.1.
One outcome of the focus group interview with potential users on campus was that a north–south route might be convenient from a user perspective. As the best compromise, the project chose to place a shuttle stop relatively close to the central building 101 on Anker Engelunds vej and in the immediate vicinity of bus stops used by commuters travelling to and from DTU.
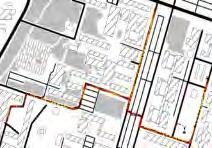
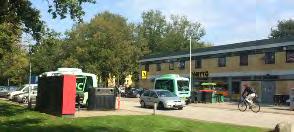
The final route (Map 5.2) approved by the Danish Transport Authority connects DTU Skylab (1); Anker Engelunds vej, where there are stops for five scheduled buses (2); and Netto (3). It passes through areas with varying traffic characteristics; e.g., crossing traffic and activities along the road.
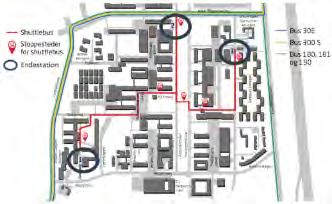
M AP 5.1 DTU CAMPUS AND THE TE STIN G AREA
5.1 TRAFFIC PLANNING IN THE TEST BED
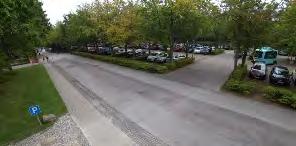
The campus layout provides easy access to buildings by car and parking options are distributed across the campus, so that cars may be parked close to most buildings. Parking areas are therefore small and distributed, and in many places there are roadside parking bays. This means that the campus area, especially in the morning and at around noon, is characterised by vehicles whose drivers are looking for a parking space, or parking, or about to leave a parking space.
In many places along the route it is not marked where pedestrians are supposed to walk, but there are many openings in hedges, etc., which make it possible for pedestrians to move a little crosswise depending on need. On the stretches where there are pavements, they are narrow and on only one side of the road. When many students walk together, they often walk in the roadway as well as on the pavement.
The absence of clear pedestrian routes is also evident when pedestrians cross Niels Koppels Allé and Asmussens Allé, two continuous avenues in the centre of the test area that separates the third and fourth quadrants. Between them there is a parking zone with entrances and exits mainly to Niels Koppels Alle, and a high wall which absorbs a terrain drop between the parking lots and the southern end of Asmussens Allé, towards Anker Engelunds vej. The section where the shuttle runs across the parking area therefore acts as a corridor for cars, bicycles, and pedestrians travelling between the third and fourth quadrants.
Service and delivery vehicles form a substantial part of the traffic in some parts of campus. These vehicles are typically allowed to park briefly anywhere on the entire campus.
Total cars through crossing per period F IGUR E 5.1 C OUNT OF CARS ON 14 SEPTEMBER 2021
A count made at the intersection where Elektrovej meets Asmussens Allé on 14 September 2021, between 7.15 and 16.56, counted 2,306 cars. As can be seen from Figure 5.1, the most crossings were at around 8.00 and around noon, with a maximum of about 10 passes per minute. These two particularly busy periods correspond to the stewards’ descriptions of the traffic throughout the day.
The role of the steward
6 T HE ROLE OF THE STEWARD
It may seem paradoxical to describe the role of the steward when the purpose of testing self-driving public transport is to have an unmanned service. But the fact is that the stewards currently have an active and central role, both technically (in relation to the operation and driving) and socially (in relation to communication with passengers and other road users). This means that the steward’s role and actions affect in several ways how smoothly the service runs and how the shuttle is experienced by passengers and road users. In order to understand what the test on campus reveals about automated driving, we must describe what functions in traffic – formal and informal – the steward performs on behalf of the vehicle. In other words, the implementation of self-driving shuttles that is possible with current legislation and technology is in practice a hybrid between a driven and a self-driving vehicle. A description of the changeovers between the two modalities is necessary for an understanding of the maturity and potential of self-driving shuttles that the road test can impart.
6.1 STEWARDS’ EDUCATION AND BACKGROUND
It is a condition of the licence to test the self-driving shuttles at DTU that the driving is monitored by a driver responsible for safety. As this person is formally the driver of the vehicle, it is also a requirement that he or she must have a commercial bus driver’s licence. In the LINC project, the term “steward” is used for the drivers who perform this function. All stewards who have contributed to the LINC project have a background in passenger transport and customer service. Some work as bus drivers alongside their LINC project tasks
Due to the many hours that the stewards spent monitoring the operation, it was clear early on that they had built up a large experience base, both in relation to the operational and technical aspects of the road test and in relation to the interaction with other road users and passengers. It was therefore a priority in the data collection to include the stewards where relevant.
6.2 THE STEWARD APPROVES THE SHUTTLE’S DECISIONS IN TRAFFIC
The steward must at all times be ready to intervene if the need arises. The steward must stand in the middle of the shuttle, watching what is going on ahead of the shuttle There are no mirrors mounted on the shuttles. A monitor is mounted to the left of the windscreen, showing the image from a rear-facing camera and a real-time simulation of the shuttles seen from above, where road users around the shuttle can be seen.
The route has a total of 11 turns with a duty to give way. Here, the steward must confirm that the vehicle is to move forward. This is done by pressing a small arrow which appears on the control screen whenever the steward’s approval is required. If the steward at these places does not verify that there is a free lane, then the shuttle will not move forward. Thus, since the steward in practice makes the decisions about situations involving the duty to give way, the test did not show the extent to which the shuttle can safely perform these types of manoeuvres.
6.3 SWITCH TO MANUAL MODE
Whenever there is an obstacle on the route, the shuttle either stops until the obstacle is removed, or the steward switches to manual mode and steers around the obstacle. In practice, the steward makes several evaluations when switching to manual mode. One example is an assessment of whether a car that has stopped can be expected to continue driving so soon that it is most efficient to wait for it to do so. In practice, the steward often chooses at what distance to the obstacle the shuttle is stopped when switching to manual. By anticipation, the steward can avoid the shuttle getting so close to an obstacle that it becomes
necessary to reverse in manual mode with the joystick before the shuttle can be manoeuvred around the obstacle. Or the steward may, with gestures and body language, inform a road user who is blocking the route that the shuttle is unable to get past, and it would therefore be helpful if space was made.
6.4 COMMUNICATION TO PASSENGERS AND OTHER ROAD USERS
The steward has a key role in communicating with both passengers and other road users. With passengers, communication is about answering their questions and instructing them to hold on while driving for the sake of their safety. With the rest of the traffic, the stewards often take on a social role to avert conflicts and misunderstandings by communicating with gestures and seeking eye contact when ambiguity arises. Some of the stewards also made other road users aware of the changed rules for parking and stopping during the project, when needed
6.5 REGISTRATION OF PROBLEMATIC SITUATIONS
The steward registers reasons for downtime in the shuttle’s built-in control panel. But since the project also sought to document observations of misunderstandings, ambiguities, and potential traffic conflicts – situations that do not necessarily involve downtime – part of the steward’s work was to tell RUC researchers about their observations, and to record problematic traffic situations in the steward app, which is installed on a smartphone mounted in the shuttle. In the registration and categorisation of events, the steward had to evaluate whether an event was of such a nature that it should be registered.
P H OTO 6 1 J OYSTICK FOR MANUEL MODE

The profile, attitudes, and expectations of potential users
7 T HE PROFILE , ATTITUDES , AND EXPECTATIONS OF POTENTIAL USERS
To form an impression of potential users, their experience of the traffic on campus today, and their requirements for a self-driving service, in August 2021 we issued the online questionnaire, “Getting to know our passengers ” (see appendix). It was sent to members of the user panel. The findings are based on 212 answers.
7.1 WHO REGISTERED FOR THE USER PANEL?
The users who answered the questionnaire – our respondents – were between 16 and 75 years old. Significantly more men (73%) than women (26%) answered the questionnaire, while some refrained from stating their gender (Figure 7.1). Most (94%) of the answers were from students (65%) and employees (29%) on campus / DTU. The remaining 6% indicated their affiliation with DTU as visitors, neighbours, residents of dormitories, and curious (Figure 7.2)
7.2 HOW DO USER
PANEL
IGURE 7 .1
MEMBERS TRANSPORT THEMSELVES?
We asked the user panel how they typically arrive at DTU. Most typically arrive by bike or e-bike (55%). The second most stated mode of transport is public transport (33%), while cars constitute the typical means of transport to and from campus for 23% of the respondents. Twenty-five percent stated that they typically arrive on foot (e.g., from the dormitories located on campus). Note that it was permitted to specify more than one typical way of arriving at campus, which is why the sum of the percentages exceeds 100%.
We also asked panel members how often they need to transport themselves between buildings on campus, whether they have daily activities in the area where the self-driving shuttles were being tested, and how they currently transport themselves between buildings at DTU.
Due to the coronavirus lockdown when the questionnaire was sent out, the question about transport internally on campus was accompanied by a support text: “The autonomous shuttles run on campus April–July 20212. Please answer based on whether you expect to need to transport yourself between buildings on the DTU campus during this period. You have the option to specify if this depends on whether the corona restrictions on campus are relaxed.”
Sixteen percent of the respondents expected to have a daily need to move between buildings on campus, while 19% expected to have a weekly transport need at campus. Forty-four percent stated that they expected “occasionally” or “rarely” or “ never ” to have a transport need between buildings on the DTU campus during the test period. Finally, 19% expected that they would need to transport themselves only if the restrictions were eased. Overall, the responses indicated that not everyone who signed up as a test passenger would have a natural opportunity to use the self-driving shuttles as part of their daily transport during the period when the test was planned, due to closure of the campus.
2 Operation was extended later to November 2021.
When those respondents who needed to transport themselves around campus stated their means of transport, 82% said that they walked, while only 6% used a car. Forty-one percent cycled. As it was permitted to state more than one means of transport, the sum exceeds 100%.
O the 212 respondents, 200 stated that they expected to come to campus during the test period, although for some it would be only rarely. Among the 200, 163 (82%) stated that they typically or often have errands in the area south of Anker Engelunds vej, where the self-driving shuttles were tested.
7.3 CAMPUS ACCESSIBILITY
When we asked the respondents to what extent they agreed with the statement, “Getting around campus is easy”, 54% answered that they agreed or strongly agreed (Figure 7.3). In the comment field for the question we received 61 comments, of which 60 describe the nature of the challenges of getting around that were experienced. Experiences of road work in particular posed a challenge to accessibility (25 comments). The absence of pavements and cycle paths, and jumps in terrain heights without passages or only passable via stairs, were mentioned (19 comments). Finally, 18 comments described the long distances and time spent getting around as a challenge, which in some cases was exacerbated by the lack of direct routes or good signage.
7.4 EXPECTED USE OF SHUTTLES
As for how useful the respondents expect the automated shuttles will be for them, 81% answered that they agree or strongly agree with the statement, “Self-driving shuttles between central buildings at DTU will make it easier for me to get around” (Figure 7.4 a).
I will use the autonomous shuttles if their route suits my needs
Strongly agree
Agree
Nighter agree nor disagree
Disagree
Strongly disagree
When the questionnaire was sent out on 15 April 2021, the road test had barely started and the associated app indicating routes and departures was not yet available. It is unlikely that the respondents had a clear picture of the route of the self-driving shuttles or the timetable. Their answers must therefore be seen as an expression of their expectation in relation to an abstract service that connects points that are central, but without a direct link to their personal needs. We therefore subsequently asked how much the respondents agreed with the statement, “I will use the self-driving shuttles if their route suits my needs” Ninety-four percent of the respondents agreed or strongly agreed with it (Figure 7.4 b).
7.5 TIME SENSITIVITY
We then tried to identify what it meant more specifically for the route and timetable to meet users’ needs, and therefore asked how long the respondents estimated they would be willing to wait for the shuttle. Eleven percent were not willing to wait at all, or would wait for a maximum of 2–3 minutes. Most (66%) would wait for up to five minutes, while 22% were willing to wait for up to 10 minutes (Figure 7.5a). Very few were willing to wait more than 10 minutes.
to wait
I expect that the autonomous shuttles on campus will be faster than: Yes No
We also asked our respondents how well they expected the self-driving shuttles to perform in relation to cycling, walking, or driving on campus (Figure 7.5b). Ninety-three percent expected it will be faster to transport oneself by self-driving shuttle than to walk, 27% expected that it would be faster than taking the car and parking, but only 13% expected the self-driving shuttles to be faster than cycling.
7.6 PANELISTS’ VIEWS ON THE PERSPECTIVES FOR SELF-DRIVING TRANSPORT
Overall, respondents were positive about the prospects for self-driving transport in the future: 67% agreed or strongly agreed that self-driving cars within 15 years will be the safest choice, 69% agreed or strongly agreed that they will be the most comfortable choice, while 54% agreed or strongly agreed that self-driving vehicles will be the most common.
Thirty respondents (14%) answered that they had previously tried a self-driving vehicle (Copenhagen Metro not included).
F
7.7 INTEREST IN NEW TECHNOLOGY
Participants in the user panel for the LINC project were very interested and positive about new technology: 94% agreed or strongly agreed with the statement, “I have a great interest in new technology in general”. Figure 7.6 shows the distribution of answers to the question, “Are you typically among the last or the first to use and/or recommend new technology?” Here, 90% rated themselves 7 or higher on a scale of 1 to 10 (1 = last; 10 = first).
7.8 SUMMARY OF THE PROFILE OF POTENTIAL USERS, THEIR ATTITUDES AND REQUIREMENTS
Are you typically among the last or the first to use and/or recommend new technology?
Unsurprisingly, users at a technical university are interested in technology. The students, employees, and others who signed up as test users in the user panel were generally positive about self-driving technology, optimistic that self-driving vehicles will undertake a large part of the traffic tasks within the foreseeable future, and that they will be able to do so better than traditional vehicles. In other words, our users would probably not be sceptical about the road test and the self-driving shuttles, but may have expectations exceeding what the technology in the project can achieve
The potential passengers are interested in getting around campus easily and quickly and are willing to use a self-driving shuttle, provided they do not have to wait too long for it. As many students need to get from one class to another during the same breaks, and as we expect to be able to run at a maximum frequency of departures every 15 minutes, we may have difficulty meeting users ’ expectations and their need for immediate and direct transport.
Analysis of the self-driving shuttles’ driving pattern on the DTU campus
8 THE SELF - DRIVING SHUTTLES ’ DRIVING PATTERN ON THE DTU CAMPUS
To provide a thorough description of the characteristics of the automated shuttles’ driving patterns, we collected data on the traffic environment, the characteristics of the route, and interactions with other road users throughout the test period and on all sections of the route. These records consist of registrations in the steward app and observations and travel-along interviews with stewards. In addition to this continuing data collection, we used video analysis of a single intersection on a single day, to maintain and illustrate concrete examples of driving patterns and interactions.
Figure 8.1 shows all registrations in the steward app broken down by operation days. The number of registrations was affected both by the number of operating hours on a given day and by the number of other road users in the area. As the number of operating hours in early summer and autumn do not differ much,3 the increase in registrations after the summer break is most likely a result of the increased activity on campus because of the reopening.
Figure 8.2 shows a count of all registrations recorded on the steward app, broken down by category. As can be seen, the most frequently registered category is “switch to manual due to obstacle”, which was registered 1,750 times between 26 May and 5 November 2021. The registrations are with high certainty under-reported. For example, a parked car or blockage remaining in the same place for an entire day may be recorded only a few times, with an attached comment that the switch to manual was repeated at this place on each pass. In addition, not all stewards used the app on all shifts. Over the summer there was a period (23 July to 20 August 2021) when the app seems not to have been in operation.
Total steward app registrations per operation day
Total steward app registrations per category
Obstruction,switchtomanualPedestrian,problematicsituationBike,problematicsituationCar,problematicsituationAcute,unexpectedstop
3 Operation hours at DTU: May 385 hours; June 501 hours; July 455 hours; August 531 hours; September 399 hours; October 503 hours Source: Jacobsen, Lindberg & Servizi. 2021. Summaries of service and performance reports for DTU campus LINC WP4 deliverable
F
F IGURE 8 2
From the operation reports based on figures from the shuttles’ own monitoring system, we can see that approximately 90% of active driving time was conducted in self-driving mode while the remaining 10% was done in manual mode 4
The stewards experienced the many switches to manual mode as a frustration, as they slow down the service and create impatience in interactions with other road users, who must wait to pass until the shuttle is directed back onto its track. In the following, areas with many shifts for manual driving will be examined in more detail. The other steward app categories will be included in analysis of the interactions with pedestrians, cyclists, motorists, and passengers, and analysis of unexpected harsh braking in the following chapters.
8.1 DISTRIBUTED RELATIVE DENSITY OF REGISTRATIONS OF SWITCH TO MANUAL MODE DUE TO OBSTRUCTION
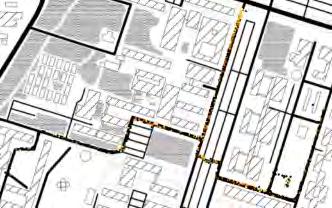
On Map 8.1 below, the position of the shuttles when registering “handwriting due to obstruction” is printed on a map of the route. Since the many registrations make it impossible to distinguish individual registrations, the relative density of registrations is colour-coded. Dark dots represent one or two registrations at a given position, while red, orange, and yellow dots represent increasing density. The yellow dots thus indicate positions where within a small area there were many registrations of shifts to manual mode.

As can be seen on Map 8.1, there were obstacles on all parts of the route which necessitated a change to manual. According to the stewards, most shifts to manual mode were due to illegally or improperly parked vehicles or minor road works. Based on the data printed on the figure, it is possible to identify areas with a particularly high density of shifts. But to be able to suggest the reasons for these differences in density, it is necessary to describe the interplay between the requirements of the self-driving shuttles in terms of road space and the specific spatial and social characteristics of different sections of the route.
4 Jacobsen, Lindberg & Servizi. 2021. Summaries of service and performance reports for DTU campus LINC WP4 deliverable
8.2 THE SELF-DRIVING SHUTTLE’S SPEED AND TRACK LINE
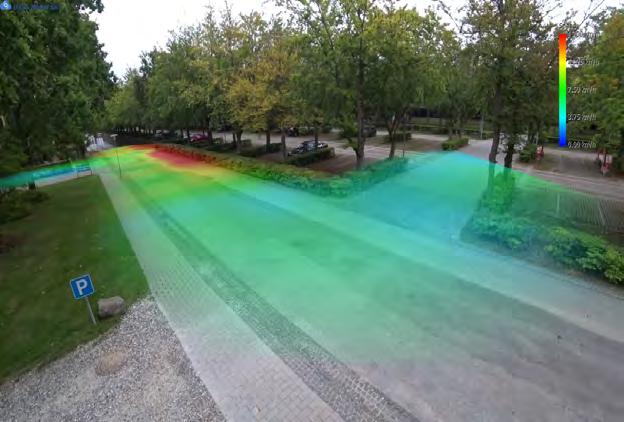
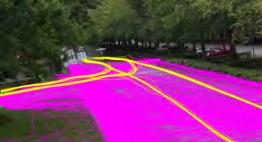
Figure 8.3 below shows the part of Asmussens Allé where video analysis was carried out. To the right in the picture is the turn towards Elektrovej, and to the left is the passage over the parking area towards Vagn Aa. Jeppesen’s road (the camera angle is shown on Map 8.2). The coloured tracks are the tracks that individual road users followed through the intersections on 14 September 2021, between 7.15 and 16.56. The light green tracks represent cars, the blue tracks are bicycles, and the pink are pedestrians. The tracks from the individual modalities gather in bundles, but have some variation in where the road users positioned themselves.


The yellow tracks represent the 63 runs made by self-driving shuttles through the intersection on this day. As can be seen, the tracks lie so much on top of each other that they appear to be single tracks. This illustrates the precision of the location and sensor system by which the position and direction of shuttles are determined. The contrast to the other road users ’ tracks illustrates that this way of moving differs from that of other traffic. In short, the route of the shuttles is predictable, but not foreseeing or responsive. Road users can be confident that they will follow the trajectory they are programmed to follow, but conversely, they will not vary their trajectory due to any traffic situations that arise.
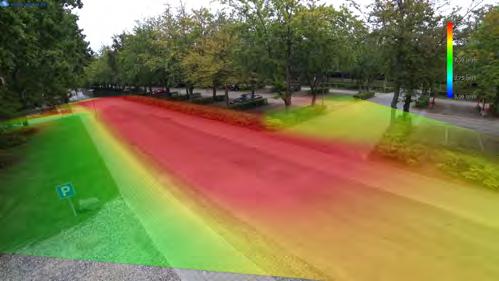
Just as the trajectory of the shuttle on the road is programmed, its speed on each road section is also programmed, but with the central difference that the speed is adjusted if the system detects objects or people in the vicinity of the shuttle. Figure 8.4 is a representation of the average speed of the shuttle at different positions, measured over the 63 passages. The blue colours on the scale indicate low speed, while red indicates a speed approaching the shuttle’s top speed, which during the road test was 15 km/h. As can be seen, the shuttle moves through the intersections at an average speed of 3‒4 km/h (blue-green), while acceleration occurs when the shuttle exits the intersection and drives towards Anker Engelund’s vej at the top of the picture.


Shuttle speed
All tracks
F IGURE 8 . 3
Bikes pedestr Cars
Shuttles
M AP 8 2 C AMERA ANGLE ON MAP OF ROUTE
F IGURE 8 4 AVERAGE SHUTTL E SPEED
The variation in the average speed of the shuttles through the intersection is seen in Figures 8.5 and 8.6, where the 63 passages are plotted individually and in intervals. As can be seen, there are quite large variations in the completed speed through the intersection, indicating waiting times; e.g., when observing the obligation to give way.
Number of passages per speed intervals
F IGURE 8 . 5
8.3 THE DIFFERENT TYPES OF ENVIRONMENTS
By comparing speeds when different types of interactions were recorded in the steward app on different sections of the route with the observations, interviews, and video from the intersection of Asmussens Allé and Elektrovej, we can form a picture of the different section-types’ characteristics and differences. The description of these characteristics in the remaining part of this chapter allows for a delimitation of different route typologies. As the interactions differ in character depending on the infrastructural and traffic context in which they occur, the typologies form the basis for the analysis of interactions with other road users in the following chapters
To describe the variation in speed on different sections of the route, we plotted the speed of the shuttle at times when events were recorded in the steward app (Map 8.3 A‒C). The image which thus appears of the speed on the route reflects partly the programmed speed, as this defines the maximum speed on the various sections, and partly the realised speed in connection with interactions with other road users.

3
‒


Based on these maps of the speed, as well as on observations and interviews, we have delimited three types of sections with different traffic and social characteristics. The three section types are shown in green, purple, and blue on Map 8.4 A high-speed section type, marked in green, consists of three route segments where the road is relatively wide and straight and where the speed approaches the maximum 15 km/h There is a medium-speed section type with shuttle stops, many activities close to the road, and intersecting
F IGURE 8 6
road users (purple). There is a low-speed segment type which includes the three end points of the route and segments where there is not much space for the shuttle, with a crossing or high-speed traffic (blue).


In the overview on the following pages, the characteristics of the individual section types are described in more detail. The colours in the overview refer to the sections on Map 8.4.
M AP 8 . 4
Parking area with shuttle stop
Route end point, Diplomvej
Route end point, Netto
Route end point, Anker Engelundvej
The continuous and straight sections with good road width
It is on the relatively straight and wide stretches that the shuttle runs at its fastest, but it is also on these stretches of the route that other road users – typically cars and bicycles – run at their fastest.

Temporary shortening of the route due to road work

On Map 8.4, a blue arrow and a dotted line have been inserted at the westernmost part of Elektrovej. The line indicates a place where the route was blocked for a period due to road work. The route was shortened, and the shuttle stop at DTU Skylab / Diplomvej was not served. Therefore, a temporary turning point was created. The change in the route is important because the new turning point caused many situations, which during the period of the blockage were marked in the steward app.
The busy sections with stops and activities
On the route sections on Vagn Aa. Jeppesen’s vej and the first part of Elektrovej there are stalls selling street food and there are entrances to office and teaching facilities. Especially on Elektrovej, vehicles often stop at the kerb in connection with servicing campus functions and food sales.
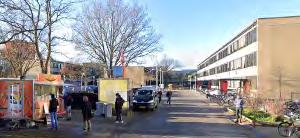
Elektrovej, first part
Vagn Aa. Jeppesen’s vej
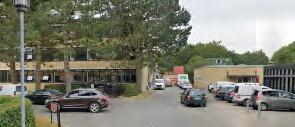
Elektrovej, second part (Photo: Google Maps 2021)
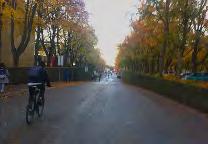
Kollegiebakken (Photo: Google Maps 2021)
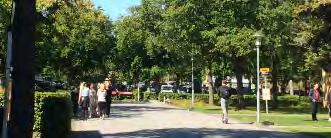
Asmussens Allé
The particularly complex places with low speed, stops, and many manoeuvres
The three route end points and the intersections at Asmussens Allé and Elektrovej are places where the traffic complexity challenges the self-driving shuttles.
Diplomvej / DTU Skylab
Asmussens Allé / Anker Engelunds vej
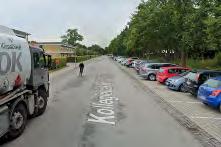
Kollegiebakken / Netto
On Diplomvej the road is narrow. When there are cars parked in the stalls on the side of the road, two vehicles can pass each other only with difficulty. This means that traffic is often negotiated more informally, and demands that road users decode each other’s intentions and adapt their speed and trajectory
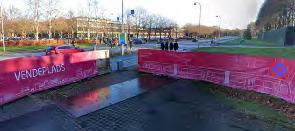
At the turning point at Anker Engelunds vej, traffic is blocked due to road work. Many pedestrians pass here, for example on their way from the bus stop on Anker Engelunds vej to lecture halls on Asmussens Allé. Stewards see the barrier being pushed aside so that pedestrians can take a more direct path across the turning area.
From the turning area at Netto, the self-driving shuttles back out of the parking stall and merge into the traffic, which is characterised here by cars and bicycles passing at relatively high speeds. Trucks delivering goods and drivers using the red parcel delivery box next to the stop often interfere with the shuttle’s track and cause stops and delays.
Parking area with stop: Close-up of intersections at Asmussens Allé
Asmussens Allé / Elektrovej First part / Parking
At the passage of the parking area, the shuttles meet cars being driven in and out of parking lots, traffic crossing the parking area, and through traffic on Asmussens Allé. The shuttle makes several turns on this stretch, and in many situations has a duty to give way. Interactions with pedestrians, bicycles and cars at this location have been closely investigated using video and video analysis.
8.4 PROBLEMS WITH HEAVY RAIN, WIND, PLANT BOXES AND FALLING LEAVES
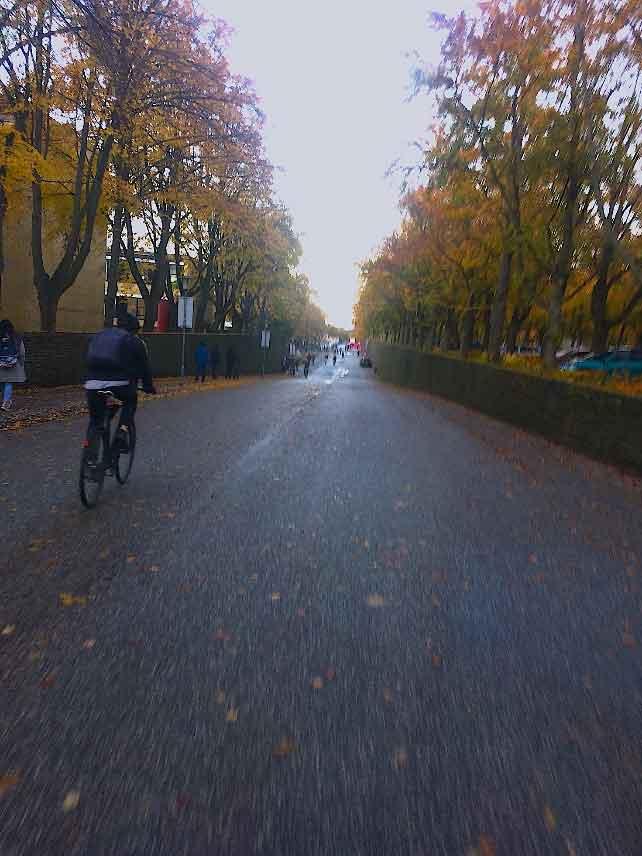
In addition to the characteristics of the self-driving shuttles’ driving pattern and the route environment, which are described above, there were days where the weather caused difficulties. The stewards’ descriptions and operating data both show that particularly heavy rain, strong winds and falling leaves cause problems. Heavy rain can cause the shuttle to stop every few meters and to travel very slowly. Rain and falling leaves can both cause emergency braking events, which are perceived as arbitrary and without warning for passengers in the shuttle and for road users in the vicinity. Arrangements at the roadside, such as the placing of plant boxes, has also caused problems as they were not present when the route was digitally mapped. These types of disturbances and abrupt decelerations are discussed in Chapter 13.
Interaction with pedestrians
“Strange that it does not overtake, but stays behind me.”
Male employee, 52 years.
“It slowed down even though I was walking on the side of the road It was not uncomfortable for me, but it was apparently uncomfortable for the security man driving it. At least, he indicated that I should keep my distance. I thought afterwards that it is not me who has to keep my distance Ordinary cars just bet that no one jumps out in front of them. ”
DTU employee, 30 years.
“I think they work well.”
Female employee, 73 years.
9 I NTERA C TION WITH PEDESTRIANS
In September 2021, with the reopening of the campus and the start of a new academic year, there was a marked increase in the number of pedestrians. Whereas during the coronavirus lockdown it was especially individuals walking to and from parked vehicles or customers around the two outdoor food outlets whom we met, with the reopening came larger groups of pedestrians walking together, and waves of students and staff arriving on campus by public transport. Figure 9.1 shows an increase in registrations in the steward app of problematic interactions with pedestrians in the days around the start of the semester. This supports the notion that there was a marked change in the volume of traffic at that time.
9.1 SPEED AND USE OF ROAD SPACE
Pedestian events, registrations per operation day
At intersections and on route sections with shuttle stops and narrow passages, pedestrians walk almost as fast as the shuttle, while on straight stretches with plenty of space the shuttle is faster. Figures 9.2 and 9.3 show the speeds of pedestrians and shuttles at an intersection. The colours indicate the average speed for all passages over a single day. By comparing the colours on the two figures, it can be seen that pedestrians and the shuttle on average move approximately equally fast through the intersection, but that the shuttle accelerates after the intersection.
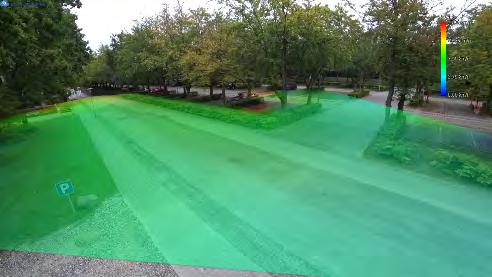

Figure 9.4 is an overview of pedestrian traffic at the same intersection at Asmussens Allé. Each pink line represents a pedestrian. As can be seen, many pedestrians use the sidewalk on the western side of Asmussens Alle (the left side of the picture), and naturally move on the roadway in places where there are no pavements In some places there is not sufficient space for both pedestrians and cars to move at the same time, which in practice means that cars and pedestrians move in and out of the space in more informal ways than would have been the case with a more stringent division of the road space. As can be seen in Figure 9.4, it is especially the pedestrians

F IGURE 9 1 (23 JULY TO 20 AUGUST : MISSING DATA )
Selvkørende bus med fodgængere
F IGURE 9 4 S HUTTLE ( YELLOW ) AND P EDESTRIANS ( PINK )
F IGURE 9 3
F IGURE 9 2
Pedestrian speed Shuttle speed
crossing Asmussens Allé, where there are no pavements, who cross the shuttle’s tracks and make use of the entire road width.
The pavements are mostly narrow, and especially when many pedestrians are on campus, they use both sides of the road. Pedestrians walking alongside walls, hedges, and parked cars have difficulty moving smoothly out of the shuttle’s safety zone Also, the self-driving shuttles are rather quiet, and pedestrians do not always notice that a shuttle is driving behind them. Furthermore, the safety distance required by the shuttle appears to be greater than pedestrians expect or consider necessary.
On straight stretches of road, the shuttles typically need to overtake pedestrians walking in the same direction – whether they are walking on the road, at the roadside, or on a pavement. As the shuttle cannot deviate from its programmed virtual track, difficulties can arise if the distance from pedestrians on the roadside is too narrow for the shuttle to pass. As a change to manual mode takes time, and since the speed of manual driving is very low, the shuttle can in practice not overtake pedestrians walking in front of it or near it on the roadside.
9.2 PEDESTRIANS’ PERCEPTION OF SAFETY AND THE READABILITY OF THE SELF-DRIVING SHUTTLES’ INTENT
A questionnaire survey of the LINC user panel’s experiences with the self-driving shuttles, dispatched in October 2021, received 66 responses from individuals who had experience of interacting with the self-driving shuttles as pedestrians. Fifty-four respondents (82%) agreed or strongly agreed with a statement that it felt safe be a pedestrian in the vicinity of the self-driving shuttles (Figure 9.5). Among the remaining 12 respondents (18%), four stated that they disagreed and two that they strongly disagreed with the statement Six respondents neither agreed nor disagreed
I feel it is safe to be a pedestrian in the vicinity of the shuttle
Twelve respondents qualified their answers with written comments, three of which related to the experience of safety. One respondent wrote that the unsafe experiences were linked to the number of other activities taking place on and near the road, and to the unpredictability that can occur when the shuttle is controlled manually.5 Another respondent pointed out that the absence of a driver’s body language, which one can read as a road user, in some situations leads to ambiguity about the intention of the shuttle.6 Finally, one respondent described how fallen leaves, which were blown around in front of the shuttle’s sensors, resulted in an unexpected stop 7 Of the three respondents who wrote safety-related comments, only the respondent who saw a shuttle stop due to leaves in front of the sensor was in the group of respondents
5 “Many of the uncertain experiences occurred at the turning point on Diplomvej by Scion, as the space is also used for the entrance to the building, and the vehicle is controlled manually (flashing with catastrophic flashing)”. (Translated from Danish by the authors.)
6 “What is a bit different. There is no driver you can look at, and read the body language. This makes it a bit unclear sometimes...”
7 “There were problems when it stops, because leaves were blown up in front of the car.”
who stated that they felt less safe in traffic with the self-driving shuttles. The two other respondents described unclear or unsafe experiences but generally perceived it as safe to be a pedestrian around the shuttle.
The three descriptions correspond with observations from the route, and with the stewards’ experiences of where and when unclear or less safe situations arise in interactions with pedestrians. The stewards all describe their experience that the self-driving shuttles consistently detect obstacles and road users correctly, and brake correctly when in normal operation. However, ambiguities in the interaction with pedestrians can arise; for example, when the shuttle has held back or has slowed down for other road users, and, when speeding up again, an informal negotiation takes place about who acts first. This is reinforced by the slight delay that occurs between the steward reactivating the shuttle and the shuttle starting to move. Since the pedestrians and the shuttle are both moving slowly, these situations are typically unclear and messy, although posing no direct risk to pedestrians. According to the stewards’ unequivocal statements, the shuttle consistently stops before contact.
Experience of braking
Has a self-driving shuttle failed to brake in situations where you, as a pedestrian on campus, think it should have slowed down or stoped?
Has a self-driving shuttle braked harshly or unexpectedly in a way that was uncomfortable for you as a pedestrian in its vicinity?
We asked pedestrians if they had concrete experiences of a shuttle either braking in an unpleasant way or failing to brake when they felt it should have done so. A small number of pedestrians reported having this type of experience, while most had not (Figure 9.6)
Figure 9.7 shows differing attitudes among the respondents about how easy or difficult it is to read the shuttle’s intention in traffic. Forty-two percent agreed or strongly agreed that it can seem inexplicable for the the shuttle to slow down when it passes. Most found it easy to read the shuttle’s intention to make a
Pedestrians experience of shuttles' signals
As a pedestrian, I have become better at reading the shuttle's signals after interacting with it a few times
It sometimes seems inexplicable that the shuttle stops or slows down when it has to pass me
It is easy as a pedestrian to assess when the self-driving shuttle will drive forward or give way in traffic
As a pedestrian, it is easy to read the signals of the selfdriving shuttle when it is about to turn
turn or give way, but a large minority disagreed or strongly disagreed that the two types of intention are easy to assess (turn: 17%; give way: 29%)
The answers about the readability of the shuttle’s signals adds to a picture of the shuttle as an unfamiliar actor on campus, which has difficulty with the negotiated way in which other road users occupy the road space and move in and out between each other. As an observer on campus, one could often observe a steward trying to compensate for the shuttle’s inability to signal intent by being very clear with gestures and body language in otherwise ambiguous situations. When asked, the stewards agreed that they do this, and that it is a way to compensate for the shuttle being perceived as clumsy in its limited capacity to adapt to the informal negotiation that characterises many traffic situations on campus.
9.3 PROBLEMATIC ENCOUNTERS WITH PEDESTRIANS REGISTERED IN THE STEWARD APP
During the nearly 2,800 operating hours on campus, 1,305 problematic situations were recorded that involved pedestrians. The definition of a “problematic situation” is one that delayed or made driving difficult, or that could have developed into a dangerous situation. On Maps 9.1 and 9.2, the position of the shuttle at around the time the steward registered a situation is printed as a small dot. Since there are several dots in some places, the density is indicated by a colour change from dark to light. Dark dots indicate a low density of registrations, while bright orange to yellow colours indicate an increasingly high density of registrations in an area

M AP 9 .1 I NTERACTIONS WITH PEDESTRIANS

M AP 9 .2 I NTERACTIONS WITH PEDESTRIANS , HOTSPOTS


The maps show registrations on all route sections, but the highest density of registrations (the hotspots on Map 9.2) are on Asmussens Allé, especially around the turning area at Anker Engelunds vej (1) and at the intersection with Elektrovej (5). The areas around the food trucks on Vagn Aa. Jeppesen’s vej (3) and Elektrovej (4) also show a relatively high density. Finally, a high local concentration is seen at the temporary turning point on Elektrovej, second part (2). Below, traffic situations in the four areas highlighted as hotspots due to high densities of registered passenger events are described in more detail.
Both the temporary turning area on Elektrovej and the turning area by Anker Engelunds vej are places where the traffic structure and road layout partly ceased due to road works At the same time, these are places used by
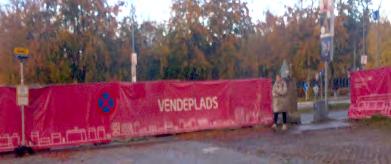
P HOTO 9 1 ROUTE END POINT AT A NKER E NGELUNDS VEJ
many pedestrians, who seek the most direct path through the road works. In both places the self-driving shuttle must make a three-point turn, which means that it moves slowly and stops several times. When pedestrians walk across the turning area and cross the shuttle’s path, both in front and behind, the shuttle is forced to wait for a stop in the flow of pedestrians before moving on. Several stewards mentioned these situations. One describes it this way: “They just go. As if we are not there!”8
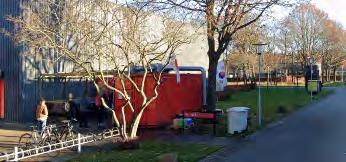
There is an accumulation of registrations, on both sides of the road, around the area where the food outlets on Vagn Aa. Jeppesen’s vej and Elektrovej are situated Many people gather there, especially at lunchtime. Sometimes there is a queue all the way out onto the road. Often, people wait there to meet friends The area is designed for cars, but the road space at these times is occupied by pedestrians, who do not move promptly for vehicle traffic. These conditions can obstruct the self-driving shuttles, partly because they do not have the capability to twist their way through, and partly because they act more hesitantly than other road users. Pedestrians on the road and the roadside are often immersed in conversation or looking at their mobile phones. They are not oriented towards the shuttle, which stops and waits at a distance
At the intersection between Asmussens Allé and Elektrovej, pedestrian traffic from many directions meets. When many pedestrians, cyclists and drivers are moving among each other, the shuttle is limited by its long reaction time and few navigation options. This is further described in the example below bremsede op selvom jeg gik i siden af vejen. Det var ikke ubehageligt for mig, men det v
Video analysis: Example of a shuttle stopping several times
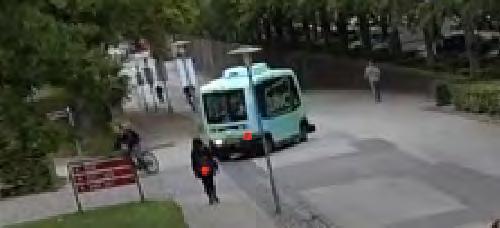
In the picture, the shuttle is turning right onto Elektrovej. An oncoming pedestrian apparently deliberately walks slowly, to give the shuttle time to turn in front of her. But a cyclist driving on the inside of the shuttle triggers emergency braking. The shuttle hesitates for several seconds before starting again.
P HOTO 9 2 S TREET F OOD SALE AT V AGN A A J
’ S VEJ
P HOTO 9 3 S HUTTLE AND PEDESTRIAN TRACKS

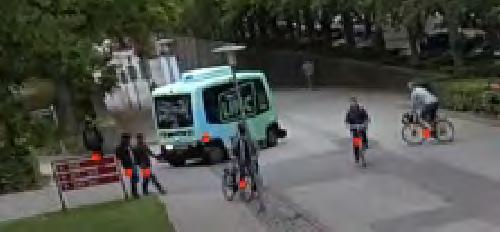

Meanwhile, the waiting pedestrian decides to cross the road. The shuttle stops again, to comply with its obligation to give way. Behind the shuttle, a cyclist is riding up Asmussens Allé
While the shuttle is giving way to the pedestrian, a cyclist waiting to turn onto Elektrovej tries to stay upright, without putting a foot down, even though he is almost stationary. The other cyclist on his way up the hill passes behind the shuttle, at a large distance.
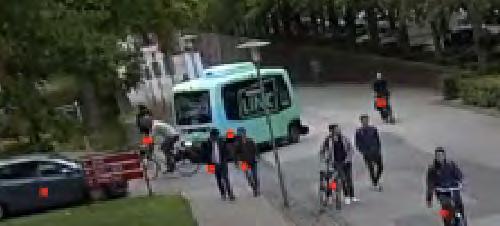
As soon as the oncoming cyclist has passed, the waiting cyclist rides onto Elektrovej, passing close by the shuttle, which thereby stops again. Now a car and several pedestrians have joined the small traffic jam, which is quickly resolved
After all the other road users have moved on, the shuttle can finally finish the turn and enter Elektrovej.
9.4 SUMMARY OF THE INTERACTION WITH PEDESTRIANS
The conflicts that arise between shuttles and pedestrians are undramatic, due to the shuttle’s low speed and its safety zone, which makes even inattentive pedestrians feel safe that it will not run them over. The disadvantage of this traffic behaviour, for the shuttle and its passengers, is that the operation becomes very slow, with many stops. This limits the quality of the service offered to passengers. Conflicts arise predominantly on stretches where there is competition for road space, and where pedestrians generally win some of the space from the motor traffic. (The planning of the infrastructure seems to have prioritised car driving.) When pedestrians do not move off the road, the shuttles can become trapped behind the pedestrians until they do move aside, as it has no option to overtake. This slows the shuttle and seems awkward both for pedestrians and for the steward on board. Often, the steward will intervene by trying to catch the attention of pedestrians and asking them to step aside
Interaction with cyclists
“I just drive in a big arc around it It’s easier as a cyclist because you ride much faster than it does.”
Student and cyclist, 23 years
“It can be a little difficult sometimes to overtake it – either around it, or if there is room, to dare to pass on the inside. You hold back more for it than for other vehicles.”
Cyclist with access to car, 46 years.
10 I NTERACTION WITH CYCLISTS
We have not counted the number of cyclists on campus, but especially after the reopening of the campus, there have been many interactions with bicycles. Out of 77 questionnaire responses about experiences with the self-driving shuttles, 22 respondents stated that they had met the self-driving shuttles as cyclists. As can be read from Figure 10.1, which shows registrations of problematic encounters involving bikes broken down by operating days, there was a large increase around the start of the semester on 1 September, compared with levels during the coronavirus lockdown and over the summer
10.1 SPEEDS
Cyclists, registrations per operation day
When we compare the average speeds of cyclists (Figure 10.2) and the self-driving shuttles (Figure 10.3) at the intersection at Asmussens Allé, we see a big difference. The cyclists are much faster on all sections of the area we investigated with video.
The depiction of a big speed difference corresponds with the stewards’ experiences of the entire route and with the responses we received from campus users. In addition, the cyclists are much more agile and move quickly from side to side on the road, while the self-driving shuttle does not have the same freedom to quickly adapt to traffic situations. The stewards’ experience was that many cyclists are –from the stewards' point of view – worryingly prone to risk-

F IGURE 10 1 (23 JULY TO 20 AUGUST : MISSING DATA )
Cyclist speed
F IGURE 10 .2
Shuttle speed
F IGURE 10 .3
Self-driving shuttle with cyclists
F IGURE 10 .4 C YCLISTS ’ AND SH UTTLES ’ TRACKS
taking and often inattentive. The cyclists’ experience of the self-driving shuttles is that they require patience in traffic 9
Figure 10.4 shows the tracks of bicycles and the shuttles. It can be seen that there is a lot of straight-ahead bicycle traffic at the intersection. These are situations where the bikes pass at a relatively high speed and where the shuttle has to merge
10.2 CYCLISTS’ PERCEPTION OF SAFETY AND OF THE READABILITY OF THE SHUTTLES’ INTENT
Of the 22 responses received from cyclists with experience with the self-driving shuttles, most (77%) stated that they experienced it as safe (Figure 10.5). Five respondents (23%) stated that they did not unequivocally experience it as safe. Two respondents neither agreed nor disagreed that it was perceived as safe, while three disagreed or strongly disagreed that it felt safe. As there were relatively few respondents, this is not a sufficient basis for concluding that relatively many cyclists perceive it as being less safe to cycle around self-driving shuttles of the type tested on the DTU campus. However, there is reason to state that it cannot be said unequivocally that self-driving shuttles are perceived as safe by cyclists – even at speeds below 15 km/h.
We asked cyclists how easy or difficult they found it to decode the shuttle’s signals. As with pedestrians, there was a mixed picture (Figure 10.6). Only 10 respondents (45%) agreed or strongly agreed that it was easy to assess when the shuttle would drive forward or hold back, while 13 respondents (59%) agreed or strongly agreed that it can seem inexplicable when the shuttles slow down or stop as they drive past.
feel it is safe to be a cyklist in the vicinity of the shuttle Strongly
Cyclists' experience of shuttles' signals
As a cyclist, I have become better at reading the shuttle's signals after interacting with it a few times
It sometimes seems inexplicable that the shuttle stops or slows down when I pass it on my bike
It is easy as a cyclist to assess when the self-driving shuttle will drive forward or give way in traffic
As a cyclist, it is easy to read the signals of the self-driving shuttle when it is about to turn
Strongly agree Agree Neither agree or disagree Disagree Strongly disagree
9 68% completely or predominantly agree with the statement: “As a cyclist, it takes more patience to get around in traffic when there is a self-driving shuttle on the road ”
In general, stewards described how cyclists (and other road users) tend to keep a lesser distance from the shuttle than the distance that the shuttle’s safety zones delimit as necessary. This results in the shuttle slowing down or stopping in situations that are not perceived by cyclists as unsafe
Exactly half of the respondents agreed or strongly agreed that they became better at reading the shuttles’ signals over time. This corresponds with the stewards’ assessment and with observations made on the route In the final weeks of the test, many cyclists kept themselves at a large distance from the self-driving shuttles, compared to the distance they kept from other road users
10.3 INTERACTIONS WITH BICYCLES REGISTERED IN THE STEWARD APP
A total of 1,015 problematic situations relating to cyclists were recorded. The definition of a “problematic situation” includes encounters that simply delayed people, or made driving difficult, and situations that could have become dangerous.


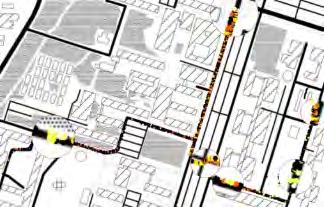

Maps 10.1 and 10.2 show that such situations arose over the entire route, but with higher density on Asmussens Allé (where the shuttle ran most frequently), and at turning areas (1, 2, and 3) and shuttle stops (4, 5). Finally, there was a high density of events on Kollegiebakken (6), just after the shuttle turned onto the road from a side road (from Vagn Aa. Jeppesen’s road). Experiences from these areas are described below
A temporary roadblock caused the regular route to be rerouted, and the self-driving shuttles had to be operated manually, with the joystick. To the right of the roadblock there was a narrow passage for cyclists and pedestrians. As the passage was close to the shuttle’s virtual tracks, this led to many situations where the shuttle stopped completely due to fast-moving bicycles passing close to the shuttle.
The end points of the route were described by the stewards as the areas where problems most often arose. Some problems were of a technical nature; the shuttles did not always seem to find the virtual track when exiting the stopping areas in reverse, partly due to the obligation to give way. The shuttles’ hesitant and slow driving pattern when entering the road resulted in frequent overtaking and informal negotiation of who was to drive forward. Observations suggest that it is not always possible for the steward to predict the shuttle’s hesitation, or the short stops that lead to the shuttle being overtaken or getting in the way of other road users.
The shuttle’s stops at bus stops and hesitant driving style in and out of the stops delayed cyclists, who had difficulty getting around them and appeared to become impatient when they stayed behind. As cyclists can quickly decide to drive around the shuttle, situations arose when entering and leaving the stops; for example, when a shuttle starts off from the kerb but
M AP 10 .2 I NTERA C TION S WITH CYCLISTS , HOTSPOT
M
immediately stops again because a cyclist rides around it on the outside or slips inside, which in turn slows down the traffic further.
On the longer straight sections, the speeds of both the cyclists and the cars were higher. Difficulties in timing the interaction were characterized by the fact that the cyclists must orientate themselves to fast oncoming traffic when they overtake the shuttle. The need to make room for oncoming vehicles causes cyclists to pass close by when overtaking the shuttle, and to pull in front of it immediately after overtaking. Further, other cyclists riding along close behind the shuttle are exposed if the overtaking bike causes the shuttle to brake unexpectedly.10
Video analysis: Example of a cyclist overtaking and causing emergency braking

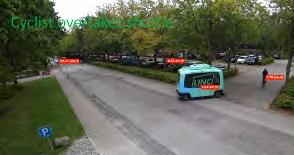
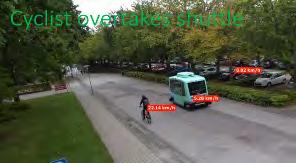
A cyclist is riding away from the camera at a speed close to the 30 km/h limit Another cyclist is seen behind the shuttle, waiting for the shuttle to turn right at a speed of 0.7 km/h.
As the shuttle drives forward, the cyclist prepares to overtake, pulling out to the left before turning onto Asmussens Allé. The cyclist (7.8 km/h) is already moving faster than the shuttle (5.6 km/h) at this time.
The shuttle makes the turn at a stable speed. The cyclist reaches a speed of 22.1 km/h and passes the shuttle, maintaining a large distance from it
10 Sound note: “Episode med to cycler” (episode with two bikes) interview with stewards, 22 April 2021
P HOTO 10 1
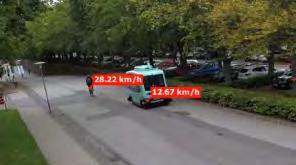

The shuttle accelerates. It has reached a speed of 12.7 km/h when the cyclist pulls in front of it after overtaking. The cyclist’s speed is now 28.2 km/h.
The overtaking is completed, from the cyclist’s perspective. He slows to 14.6 km/h immediately after pulling in front of the shuttle. This causes the shuttle to activate emergency braking; within a few meters its speed is reduced from 13 km/h to zero. The cyclist apparently does not notice this emergency braking as he is now far ahead
10.4 SUMMARY OF THE INTERACTION WITH CYCLISTS
The interaction with cyclists is contradictory, because these two types of road user are in many ways opposites. The shuttle follows identical tracks, round after round. Cyclists move far more effortlessly across the width of the road and across the shuttle track. It is difficult for the stewards to time encounters and merging, partly because cyclists can move and accelerate quickly, and partly because there is a delay between a steward confirming that the shuttle can drive forward and the actual forward movement.
Furthermore, there is a mismatch between the cyclists’ immediate perception of what constitutes a safe distance from the shuttle and the shuttle’s programmed safety distance and manner of detecting obstacles. In other words, it is not natural for cyclists to keep the distance required by the self-driving shuttles, and at the same time they find it somewhat difficult to read the shuttles’ intentions. The frequency of these potential traffic conflicts might decrease if the self-driving shuttles were a part of the traffic picture for a longer period, as the cyclists at DTU increasingly rode at distances compatible with the self-driving shuttles’ safety zone.
Interaction with motorists
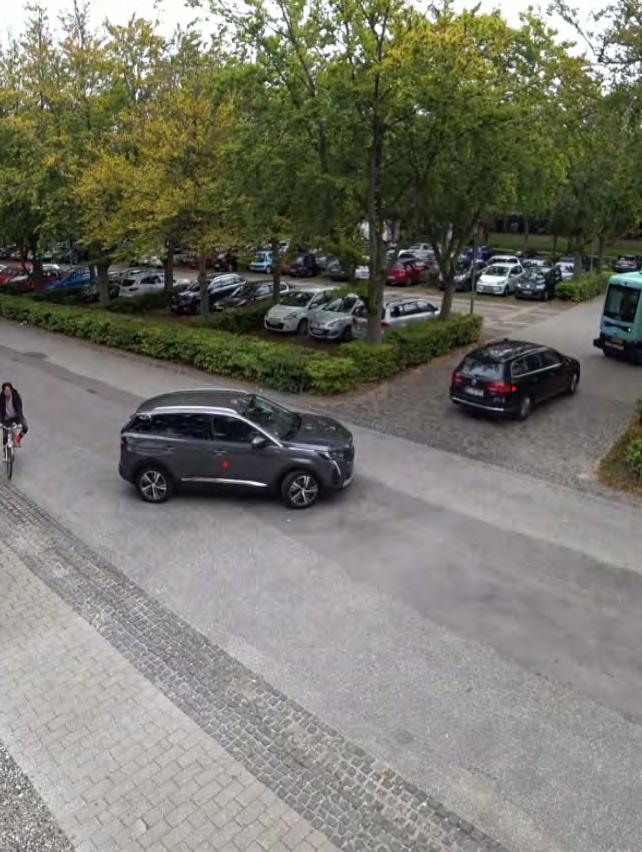
“It can be difficult to assess when to overtake - I have received signals from the ‘driver’ a couple of times.”
Motorist on DTU campus
“I feel that they are too many They do not drive, they just stand and block all intersections at the same time. I know it’s not true, but that’s the way it seems.”
Motorist on DTU campus
“I think the power of habit is great And if you have observed the shuttle a few times – five or 10 times – well, then you get more used to it and its movement pattern.”
Male motorist, 55 years
11 I NTERACTION WITH MOTORIST S
The DTU campus seems to be largely designed with car traffic in mind. After it reopened, there were many busy days when it was difficult to find a parking space and there was a lot of car traffic. The campus therefore provided an opportunity to investigate how the self-driving shuttles interacted with cars at low speeds.
11.1 SPEED AND USE OF ROAD SPACE
The self-driving shuttles and cars place themselves similarly on the road But Figure 11.1 shows that motorists most often flatten the curve when they turn, while the self-driving shuttle always makes room for oncoming traffic, whether there is any or not. It shows that few cars drove straight ahead on Asmussens Allé, which was due to the road being blocked for vehicles other than construction vehicles immediately before the section shown in the figure; i e., opposite Anker Engelunds vej.
Selvkørende bus med personbiler
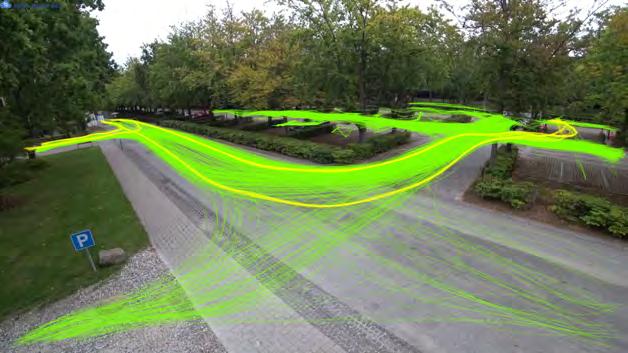
The distributed acceleration pattern of the cars is similar to that of the shuttles, except that the cars drive through the intersection at a speed about 5 km/h higher than that of the shuttle (Figures 11.2 and 11.3). Like the shuttles, the cars go slowly when drivers observe their duty to give way at intersections, and accelerate upon exiting the intersection.
A recurring observation from the stewards on all parts of the route is the experience of being the cause of impatience. The shuttle’s lower speed, hesitant driving pattern, and periodic starting difficulties at turning

areas made stewards conscious of the hindrances felt by other drivers. One steward put it this way: “Especially at Netto, there are many problems. Sometimes there are many who wait. The shuttle drives back and forth, back and forth, but just can’t find the melody. Then I sometimes switch to manual so we can get on our way. They get impatient, of course. They are friendly, they wait – and then nothing happens! We do not drive! Then they think, “What?’ ...”11 There were cases when impatience became so pronounced that it led
11 Travel-along interview, 30 August 2021
F IGURE 11 1 SHUTTLE TRACKS AND CAR TRACKS
F IGURE 11 .2
F IGURE 11 .3
to situations perceived by some stewards as intimidating; e.g., when a shuttle was caught between commercial vehicles, which had to wait for the process of switching to manual mode 12
11.2 DRIVERS’ PERCEPTION OF SAFETY AND OF THE READABILITY OF THE SHUTTLE’S INTENT
There were 29 respondents to the questionnaire survey who stated that they had interacted with the shuttles as motorists. Compared with the other road user groups – cyclists and pedestrians – motorists agreed more than cyclists but less than pedestrians that it feels safe to move around the selfdriving shuttles. A total of 80% of motorists either agreed or strongly agreed that it felt safe. Five (17%) of the 29 drivers disagreed or strongly disagreed that it felt safe (Figure 11.4)
I feel it is safe to be driving a car in the vicinity of the shuttle
Strongly agree
Agree
Neither agree or disagree
Disagree
Strongly disagree
Three respondents stated that they had experienced a self-driving shuttle either braking in a way that was uncomfortable for them as motorists (two respondents) or that it failed to brake in situations where they felt that it should have slowed down (one respondent). In one comment on the experience of uncomfortable braking, reference was made to the shuttle’s sensitivity to objects in the safety field: “The shuttle is very sensitive to driving close by.” Results are based on the small number of respondents who had these experiences. They correspond with the stewards’ experience that there were situations when the shuttle slowed down in a way that they did not always consider to be safe in relation to nearby road users.13
Eight drivers provided detailed comments. Four of them dealt with either overtaking or the experience of the shuttles running very slowly. One comment was also about the experience of safety: “It runs so slowly that it is difficult to overtake and pass. It seems unsafe to have to overtake it; e.g., on Diplomvej, and it gets stuck if freight deliverers or the like are just a little ‘creatively’ parked.” Three comments expressed goodwill about the testing of the self-driving shuttles, but one of those respondents also stated that the self-driving shuttles test drivers’ patience by “driving so, so slowly”.
In the questionnaire survey we asked the three groups of road users the same question about impatience: “To what extend do you agree with the following statements: As a [pedestrian] [cyclist] [motorist], it takes more patience to get around in traffic when there is a self-driving shuttle on the road.” As Figure 11.5 shows, a majority in all three groups agreed or strongly agreed that this was so, but the agreement was particularly pronounced among motorists: more than half of them strongly agreed that it required more patience, and a total of 86% either agreed or strongly agreed
12 Travel-along sound note, 30 June 2021
13 Sound note, “Stewards om blade og opbremsninger”(Stewards on leaves and braking), 22 April 2021
Road users' patience
As a motorist, it takes more patience to get around in traffic when there is a self-…
As a cyclist, it takes more patience to get around in traffic when there is a self-…
As a pedestrian, it takes more patience to get around in traffic when there is a self-…
As was the case for pedestrians and cyclists, there was large variation in the experience of how easy it was to decode the shuttle’s signals in traffic (Figure 11.6).
Slightly fewer than onethird of respondents disagreed or strongly disagreed that it was easy to read whether the shuttle will turn (27%), or that it was easy to read whether it will give way or drive forward (31%).
Some respondents found a problem reading the shuttle when it was manoeuvred manually, as hazard lights are activated One respondent described his experience of the shuttle signalling shortly before turning: “I cannot understand why it does not start signalling until it reaches the turn. It only starts signalling when it is ready to turn It’s annoying that you cannot see which way it will go. As a car driver, you learn to show intent. The shuttle does not.”
Motorists' experience of shuttles' signals
As a motorist, I have become better at reading the shuttle's signals after interacting with it a few times
It sometimes seems inexplicable that the shuttle stops or slows down when I drive pass it
It is easy as a motorist to assess when the self-driving shuttle will drive forward or give way in traffic
As a motorist, it is easy to read the signals of the self-driving shuttle when it is about to turn
Slightly fewer than 60% of respondents agreed or strongly agreed that they became better at reading the shuttles after encountering them a few times. Four respondents, corresponding to 14%, disagreed or strongly disagreed with this. There were minor differences between pedestrians, cyclists, and motorists about whether they found that it helped to have encountered the shuttles a few times, but overall, many experience that this was the case (motorists 59%; cyclists 50%; pedestrians 58%).
11.3
CAR INTERACTIONS RECORDED IN THE STEWARD APP
There were 1,487 records of interactions with cars that a steward rated as problematic, spread over 92 operating days. The number of registrations on the individual days over the period (Figure 11.6) was affected by the number of operating hours, the volume of traffic, and differences between individual stewards' assessments, but overall an intensification can be seen after the summer break. For cars, the difference between early summer and autumn is less pronounced than for bicycles and pedestrians
Motorists, Registrations per operation day
Maps 11.1 and 11.2 show that there were records of problematic interactions with cars on all sections of the route (in both directions). On Map 11.2, areas with a particularly high density of events are designated as hotspots
AP 11 .1 I NTERACTIONS WITH MOTORISTS

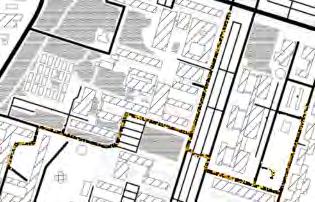

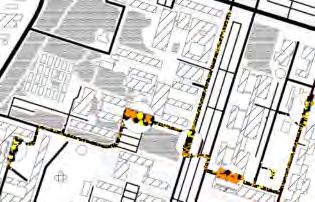

The following describes experiences from hotspots
Diplomvej was mentioned by several respondents and was described by the stewards as a challenging area. As previously mentioned, there is not much space for two vehicles to pass each other, and if a vehicle in a parking bay is parked a little skewed, the shuttle cannot drive past. On Diplomvej, a stationary shuttle quickly gets in the way and becomes a nuisance. This makes some motorists drive in a manner that the stewards describe as aggressive.14 One steward described how contractors who often visited the campus became more restrained over time, so that the shuttle’s safety system would not cause it to stop: “They know that once they stop us, it will take time before we are running again.”15
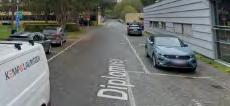

14 Sound note, “Aggressiv lastbil” (Aggressive lorry), 30 June 2021
15 Sound note, “Problemer på ruten” (Challenges on the route), 07 September 2021
M AP 11 .2 I NTERACTIONS WITH MOTORISTS , HOTSPOTS
M
F IGUR E 11 . 7
P H OTO 11 . 1 D IPLOMVE J (G OOGLE MAPS , NOVEMBER 2021)
The situations that arise at the entrance and exit of the shuttle stop at Netto have similarities to the difficulties on Diplomvej, except that the road conditions differ. Here, the scale is larger but the traffic is heavier and faster. As on Diplomvej, the competition for space on and along the road means that the existing traffic flow presupposes flexibility, both spatial and temporal, for which the shuttle has limited capacity
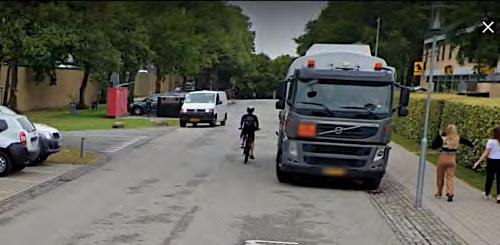
On the busy sections, Elektrovej first part and Vagn Aa. Jeppesen’s vej, problematic situations arise in overtaking. They typically occur when pedestrians or parked cars slow down the shuttle. This causes motorists to try to overtake, or overtake in ways that result in the shuttle making emergency stops.
Problematic situations are reported at left turns. Surprisingly often, the shuttles are overtaken while turning, by both bicycles and cars. There may be several reasons for this, which could be investigated further. One explanation could be that motorists do not notice that the shuttle is turning. Another possibility is that the shuttle is not fully perceived as a car in line with other cars, and that road users expect it to stay on the right side until there is a clear lane for passing vehicles. Finally, there is a possibility that the cause is impatience.
Video analysis: Example where a car tries to overtake, but stops when the shuttle signals a left turn.
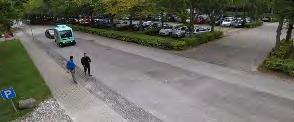
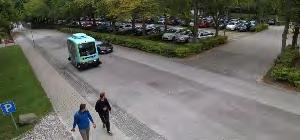
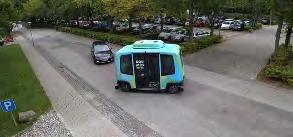
A car follows the shuttle up Asmussens Allé. At this point, it has been behind the shuttle for about 10 seconds.
As the shuttle approaches the intersection, the car pulls out to overtake. When the car is on the left side of the shuttle and about to overtake, the shuttle signals a left turn
The motorist notices the shuttle’s turn signal, falls back behind the shuttle, and follows it into the turn. The shuttle continues into the passage between Asmussens Allé and Niels Koppels Allé, where there is a shuttle stop after another turn.
P HOTO 11 2 K OLLEGIEBAKKEN

After just over 40 seconds, the shuttle reaches the stop The car continues straight ahead. This example shows a situation where ambiguity arises around a left turn. It also illustrates how the shuttle can test motorists’ patience. With no shuttle in front, this stretch takes about 13 seconds for a passenger car being driven within the speed limit.
11.4 SUMMARY OF INTERACTIONS WITH CARS
Car drivers have a harder time overtaking the self-driving shuttles than cyclists do, as cars require more space. We observed that many of the car interactions on campus – both between cars and between a car and a shuttle – are about finding space: space to park, space to pass, and space to overtake. Motorists were the group of road users who had to adjust their speed the most during the test, especially on the sections where cars can otherwise be legally driven at 30 km/h. It is therefore unsurprising that it was motorists who, to the highest degree, stated that the self-driving shuttles tested their patience.
The stewards’ experience was that workers who drive on campus often adopted a more restrained way of driving when near the shuttles. This is described as an expression of a common understanding that it is faster for everyone if emergency stops, and the consequent delay when resuming the self-driving mode, are avoided. However, there were also examples of motorists whom stewards described as aggressive drivers. Aggressive drivers pose a problem for the shuttle, as passing close by a shuttle while overtaking triggers emergency braking, and because conflicts can arise when it is not understood or accepted that the shuttle does not have the capacity to move quickly when traffic congestion occurs
Passengers’ use of and assessment of the self-driving shuttles
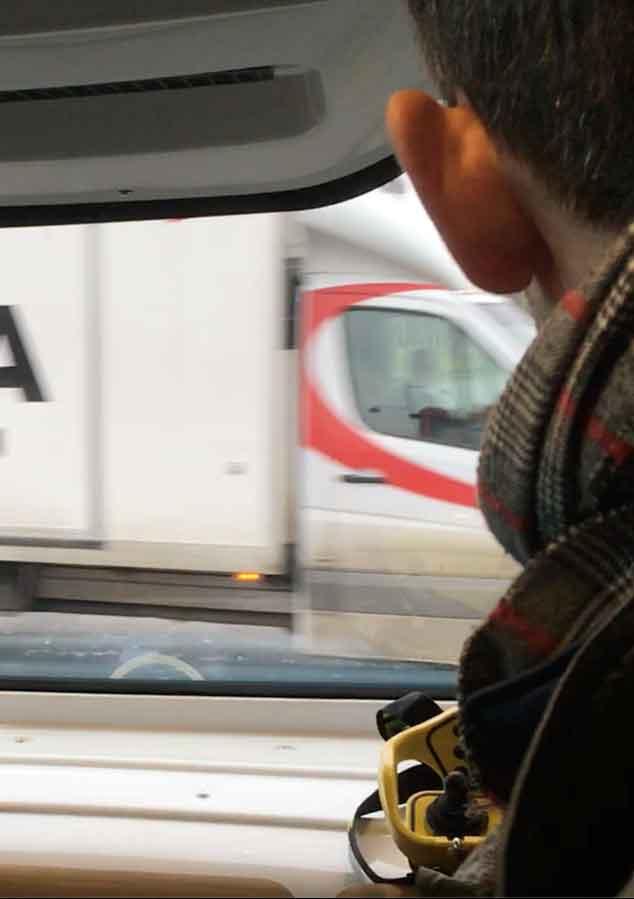
“Driving experience is very nice.”
Male passenger, 55 years
“When there is a driver, the experience is probably a lot different than without. I have only tried with a driver.”
Administrative employee, DTU
“It runs very slowly, and that makes me probably just prefer to walk, because it is faster on the routes I use.”
Student, 23 years
12 P ASSENGERS ’ USE OF AND ASSESSMENT OF THE SELF - DRIVING SHUTTLES
Even though many staff and students on campus have expressed interest in and support for the road test, few chose to use the shuttle as a means of transport. We have been unable to collect unambiguous data for the number of passengers, but we have different counts that can be used to give an estimate
12.1 ESTIMATE OF NUMBER OF PASSENGERS
We counted all boarding and alighting for the three shuttles throughout the project, but since the shuttle only has one door, this number also includes the stewards boarding and alighting. The figure “All alighting at stops” in Figure 12.1 includes alighting within 10 meters of a shuttle stop throughout the test period. The 1,991 counted alightings correspond to just over 13 per day on average, spread over 151 operating days. Another user count in the LINC project is the number of passengers that we registered on board the self-driving shuttles because they had installed the LINC user app with tracking activated. We registered 300 trips where a LINC app user travelled on the shuttle. If we look at how many users took the shuttle more than once, we find 97 unique app users who have taken trips with one of the self-driving shuttles with the app installed and active
Counts of users
All alighting at shuttle stops
Trips with user app activated
Unique users with app activated


F IGUR E 12 1
Since many passengers took the shuttle without having installed the app or without having accepted tracking, the accurate number of passenger journeys in total will be higher than the count of passenger journeys with the app activated
12.2 OBSERVED USE
Disregarding the limitation of demand at the beginning of the road test due to the coronavirus lockdown, the ability of the self-driving shuttles in the specific geographical context at DTU has proved difficult to reconcile with the expectations expressed by potential users. The shuttles on the route, including planned and unplanned stops, do not travel much faster than a walking pace.16 There are also waiting times between departures, and the fact that the route will often deviate from potential users ’ specific transport needs. This means that we have been unable to provide a service that meets the user panel’s expectations that the shuttle would be faster than walking (Chapter 7, Figure 7.5b) and that the maximum waiting time should be less than 10 minutes (Chapter 7, Figure 7.5a).
Based on these impressions from travel-along interviews with passengers, and recognising that not many people used the shuttle for transport purposes, we focused the study of the passengers’ experience on the concrete experience of the self-driving shuttle as a vehicle, rather than as an overall mobility service. Despite
16 Average speed per day in automatic mode is 4.1‒5.4 km/h. The fastest average was measured for June, and the lowest in September. The corresponding speeds with the doors closed (i e., excluding boarding and alighting durations) were 4.7 km/h (September and October) and 5.9 4.7 km/h (June). 2021, Jacobsen, Lindberg & Servizi. Summaries of service and performance reports for DTU campus LINC WP4 deliverable.
the difficult starting point, 43 passengers have expressed their opinions in the questionnaire survey of user experiences with the self-driving shuttles.
12.3 PASSENGERS’ ASSESSMENT OF THE SELF-DRIVING SHUTTLES
Forty-three of the 75 respondents who answered the questionnaire had travelled on the shuttles as passengers. We asked four questions about the specific experience.
1. To what extent do you agree with the statement: “I find it safe to ride in the shuttle”?
(Response options: 1‒5; 1 = Strongly agree, 5 = Strongly disagree)
2. To what extent do you agree with the statement: “I am satisfied with the interior design of the shuttle”? (Response options: 1‒5; 1 = Strongly agree, 5 = Strongly disagree)
3. To what extent do you agree with the statement: “I am satisfied with the speed of the shuttle”?
(Response options: 1‒5; 1 = Strongly agree, 5 = Strongly disagree)
4. “As a passenger in the shuttle, have you experienced the shuttle braking harshly?”
(Response options: Yes / No)
Passengers satisfaction of the automated shuttles
When asked about satisfaction with the interior design of the shuttle, the trend is the same: most (70%) agreed or strongly agreed that the interior is satisfactory. In the group that either disagreed or strongly disagreed (19%), there was a large overlap with the group of respondents who did not experience it as safe to ride in the shuttle. One respondent mentioned that the seats were slippery and made it difficult to F IGURE 12 2
As shown in Figure 12.2, most respondents (60%) strongly agreed that riding in the shuttle felt safe; a total of 72% either agreed or strongly agreed. However, seven respondents indicated that they disagreed or strongly disagreed. Of those seven, five elaborated on their responses with comments indicating that abrupt braking may result in falls and injury to passengers.
Respondents
secure oneself 17 As shown in Figure 12.3, respondents’ satisfaction with the design differ between those who considered the shuttles safe and those who did not. Since the absolute number of answers on which the figure is based is small, correlation must be considered tentative.
As for the speed of the shuttle, satisfaction was, as expected, somewhat mixed (Figure 12.2) Forty-seven percent disagreed or strongly disagreed that they were satisfied with its speed
Passengers who largely experienced the shuttle as safe were generally more dissatisfied with its speed than passengers who did not experience the shuttles as safe. The distributions are shown in Figure 12.4. As can be seen from the labels in the figure, there was only a small number of respondents and a correlation must therefore be considered tentative. But it indicates – supported by the qualitative picture drawn from travelalong interviews – that wishes and expectations may vary depending on perceived safety
Satisfaction with speed of shuttle, per perceived safety
Respondents who experience shuttle as mainly unsafe
Respondents who experience shuttle as mainly safe
12.4 SUMMARY OF PASSENGERS’ EXPERIENCE OF THE SELF-DRIVING SHUTTLES ON THE DTU CAMPUS
Throughout, conversations with passengers were characterised by goodwill and curiosity, but also by a common recognition that those who travel on campus in connection with studies or work must typically reach their destinations faster than the self-driving shuttles were able to accommodate. It is likely that the picture would be more positive if it had been possible to adjust the route and, for example, drive on a straighter route connecting the main building with some of the more remote bus stops. However, the lengthy and complicated process to obtain permission to change the route meant that it was not a realistic option.
A small number of campus users with reduced mobility were returning passengers, as they have particular difficulty in getting around due to road works and relatively large distances. For them, the shuttle’s low speed is of less significance
Despite the road works and the coronavirus shutdown, with the passengers who did use the self-driving shuttles, we have found that challenges with harsh unexpected braking seems to constitute a significant barrier to maintaining a high level of perceived and actual safety for passengers Abrupt stops are therefore dealt with in more detail in the next chapter.
17 “Even an electric motor can be stopped slowly. This should be worked on vigorously. Especially when it has such slippery seats and surfaces that you are glued to the windscreen when it stops abruptly.” (Original comment in Danish, translated by the authors.)
F IGUR E 12 4
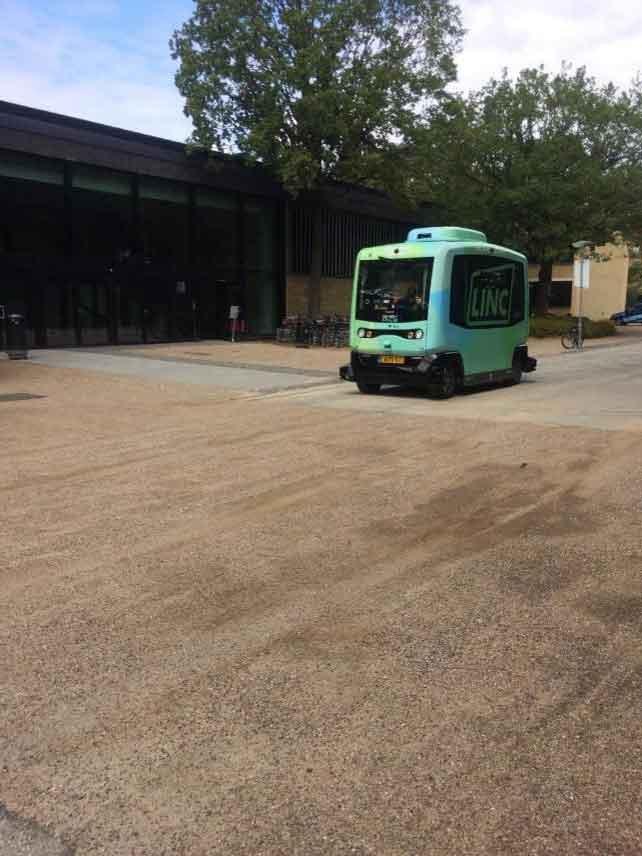
Experiences with unexpected abrupt stops
13 E XPERIENCES WITH UNEXPECTED ABRUPT STOPS
During the road test there were numerous cases of harsh braking and abrupt stops. Early on these were identified as something that stewards must be prepared for, for their own safety and because it was imperative to instruct passengers to hold on to the handles inside the shuttle. The stewards developed a practice of proposing that infirm passengers, and passengers occupied with activities that prevented them from holding the handles, sit with their backs to the direction of travel. In that way, an abrupt stop would push them into the seat rather than throw them forward.
A group of 19 passengers (44% of the questionnaire responses from respondents who had been passengers) have experienced harsh braking events (Figure 13.1). It is likely that passengers who experienced hard braking, to a greater extent than other passengers, felt motivated to answer the questionnaire.
As a passenger in the shuttle, have you experienced the shuttle braking harshly? yes No
To understand how these abrupt stops were assessed by the passengers, we asked the respondents who reported having experienced it: 1) to what extent the stop was unexpected; 2) whether it was perceived as unpleasant, and 3) whether they experienced the situation to involve a risk of injury to persons or luggage. As seen in Figure 13.2, most experienced the deceleration as completely unexpected or predominantly unexpected. The assessment of how uncomfortable it was varies between the 19 respondents, with a predominance of the middle answer option, which lies between “ very uncomfortable” and “not at all uncomfortable” (Figure 13.3). A small group of passengers describe their experience as very unpleasant or quite unpleasant.
Did you experience the braking incident at uncomfortable?
Do you think that the braking incident posed a risk of injury to persons or luggage on board the shuttle?


On the question of whether the braking was assessed by the passenger as incurring a risk of injury, two respondents assessed that there was no risk, while the remaining respondents assessed different degrees of risk (Figure 13.4). Nine passengers assessed that the braking posed a large or serious risk of injury.
The respondents’ experience of harsh unexpected braking does not give a measure of how severe the braking was in an absolute sense, but the answers give the impression that for some it seemed sever e. This is supported by comments from users about the experience 18,19
13.1 RECORDINGS OF “ACUTE UNEXPECTED STOPS” IN THE STEWARD APP
Since the start of the road test, hard braking was the subject of much of the stewards’ conversations about their work, as it posed a challenge in at least three ways: because the risk required constant vigilance in remembering to secure themselves; because it was imperative that they remember to inform all passengers about the importance of holding on tight; and because the stewards must assist passengers who had a bad experience or, in the worst case, fell as a result of an abrupt unexpected stop
The stewards described how, as they build up a routine of operating the self-driving shuttles, they learned to be prepared for stops without thinking about it, so that it happened only rarely that they fell or hit the seats hard during abrupt stops. The stewards agreed that standing upright and at the same time securing themselves in case of an unexpected stop made the work more tiring. Some mentioned that they had bruises on their lower legs from hitting the seats when braking occurred. Several said that they did not like being on duty on days when, for example, heavy rain caused many unexpected stops.
The hard stops fall into two categories: 1) stops due to the proximity of other road users, as described in the chapters on interaction with other road users, and; 2) stops due to other types of disturbances, such as heavy rain, birds, or leaves, which enter in front of the shuttle’s sensors and cause an emergency stop. As seen in Figure 13.5, there is daily variation in the number of acute unexpected stops registered in the steward app. The registrations include both categories of causes
Some of the days when there were many unexpected hard stops can be related to weather conditions, with strong winds or heavy rain, especially in combination with leaf fall. On days with cloudbursts or heavy rain, it was in some cases necessary to stop operation. Other known reasons include a lack of asphalt surfacing due to road works at a specific location, which repeatedly caused stops in late summer. In the fall, winds combined with leaf fall have resulted in many extra stops. The steward app ’ s comment field also describes situations where birds caused emergency braking. In addition to these known causes of unexpected stops, the stewards reported that
Acute unexpected stops per operation day
IGURE 13 5
18 “The braking was so harsh that I fell on the floor. It was raining so the floor was dirty, and I got very dirty. It was not nice and very unsafe ”
19 “If one has a bad knee and is standing up and the shuttle stops suddenly, it can actually lead to an injury. So it is best to sit down, but you can easily fall on the floor anyway. Old, frail people will probably not like such treatment – risk of bone fractures.” (Original comment in Danish, translated by the authors.)
LINC report: User perspectives and interaction with other road users at the DTU campus
there were occasional stops for which they have no explanation.
Maps 13.1 and 13.2 show the geographical distribution of the acute stops. Especially near the turning areas at Anker Engelunds vej (1) and on Elektrovej second part (2) there are densifications in the registrations, which can be tied to onsite observations and points made in interviews.
Experiences from the highlighted hotspots are reviewed under the maps.

AP 13 .1 A CUTE UNEXPECTED STOPS
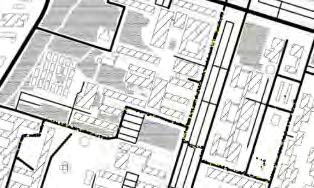
AP 13 .2 A CUTE UNEXPECTED STOPS , HO TSPOTS
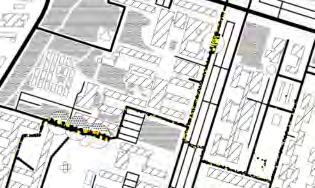
On the stretch of road before the turning area at Anker Engelunds vej, asphalt had been removed and replaced with gravel. Apparently this change in paving material challenged the shuttle and resulted in unexpected evergency stops. As the shuttles is driving at up to 15 km/h in this section of the route, the stewards typically chose to stop the shuttle beforehand, so that the stops could be prevented or took place at low speed
Elektrovej second part is a section where few problematic interactions were registered, if one disregards temporary difficulties with a roadblock. The many acute stops on this section of the route can, according to interviews with the stewards, be linked to falling leaves and the many overhanging trees
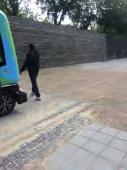


M
M
P HOTO 13 1 M ISSING ASPHALT
P HOTO 13 2 T REES AT E LEKTROVEJ SECO ND PART
14 D IS C USSION
The vision of supporting the forthcoming Copenhagen Light Rail with a self-driving first and last mile service depends on at least two criteria being met Firstly, such a service will be profitable only if monitoring can take place virtually, rather than requiring a steward to be physically present in each vehicle. Secondly, the technological maturity must be sufficiently developed for passengers to experience that the service can meet a transport need efficiently and safely. Considering these criteria, the test on the DTU campus shows that with the technology used, there is much to do before self-driving collective mobility is business-ready. The test also shows that the degree of complexity of the context in which the vehicles are deployed is crucial to how well they perform
14.1 MATURITY AND APPLICABILITY OF SELF-DRIVING TECHNOLOGY ON THE DTU CAMPUS
Experience from observations on the route, interviews with the stewards, and video analysis of the shuttles’ tracks confirms that when a shuttle is operated in self-driving mode, it runs consistently and with high precision on the planned track and on the planned route. Similarly, we have recorded no evidence suggesting that the shuttle will not reliably stop in the event of objects or persons being within the safety zone while driving. We asked the stewards if they experienced any situations where there was a risk of collision because the shuttle did not stop for an obstacle; they all answered that they had not. Therefore, within the limitations of data collection on the DTU campus, no examples were found of situations where there was a risk of collision because of a failure to detect objects – including other road users – on or along the route.
In other words, the shuttle can reliably run on a programmed route, and follow the rules defined for the route in the shuttle’s programming. It gradually reduces speed if there are mobile objects close to the route but not directly overlapping with the near safety zone. The data we collected during the test show that the shuttle, when in operation and with access to the necessary networks, orients itself convincingly in its physical and geographical context. The map and the route itself thus do not seem to cause the self-driving shuttle’s insoluble problems under normal operating conditions.
When the self-driving shuttles are challenged by traffic and challenging to traffic on campus, it is due to two other factors that are both distinct and related
1) The driving patterns and characteristics of the shuttle: The characteristics and driving patterns of the selfdriving shuttles differ from those of bicycles and cars. Therefore, they cannot simply step into the established traffic pattern on campus. As can be seen from the analyses of the interactions with other road users, they in practice constitute a separate category, which is treated differently from other vehicles and which creates new types of traffic situations. As they are slower than bicycles and cars, and as they – including the safety zone – require a full lane, they often gather traffic behind and around them. This increases the number of interactions and the rate of overtaking in situations where the safety zone is activated, leading to stops and delays.
2) The shuttle’s inability to read and signal intention in traffic: As described above, the self-driving shuttles can orient themselves in relation to the physical and geographical context, which makes them well suited to interactions that are fully defined by formal rules. But as they are not well oriented in relation to the social context, they are less suited to situations where the interaction is partly regulated informally and socially, through reading and signalling of intention and response. The other road users make extensive use of their ability to adjust their speed and position on the road so that traffic can flow, even when there are many other road users and limited space. Furthermore, cyclists, car drivers and pedestrians foresee potential accumulations of traffic and adjust their speed, thus largely avoiding conflicts and stops. The self-driving shuttles do not have these two types of flexibility in their repertoire, and thus cannot take part in this implicit negotiation of who takes space and who gives space, as well as the pace at which this takes place. This results in
situations where the shuttle is perceived to take up too much space and situations where it is perceived to take up too little space, relative to what other road users seem to intuitively expect. It typically seems to take up too much space in situations where it cannot let road users pass (typically bicycles and cars), and too little space in situations where it cannot pass other road users (typically parked vehicles and pedestrians).
As a result of the absence of social responsiveness in the adaptation of speed, and the absence of both responsiveness and technical ability to adapt its position on the road to the traffic situation, the self-driving shuttle behaves in ways that in the social context are interpreted as overly dominant or as excessively hesitant towards the collective task of having traffic flowing smoothly and efficiently. When users, after a few interactions, decode that the deviating pattern of the self-driving shuttles is due to technical limitations, they are interpreted to a lesser extent as dominant or hesitant and to a greater extent as “stupid” or “technically immature”.20
14.2 DELAYS, HESITATION, AND STOPS CAUSED BY RISK MANAGEMENT MEASURES
A known challenge with self-driving vehicles at SAE level 3 – where a driver is responsible for following the driving and taking over if necessary – concerns the ambiguities that can arise at the intersections between tasks solved by the driver and tasks solved by the self-driving vehicle’s software. In the LINC test there were several situations where the stewards influenced or determined the timing of the shuttles’ interactions. This applied, for example. when switching between manual and self-driving modes, when the steward approved the shuttle to continue into an intersection or turn, and when the shuttle had stopped due to an irregularity and had disengaged from self-driving mode. In the latter situation, the steward must reactivate the shuttle and verify that it is safe to recommence
Common to these situations is that it takes time to switch between the two types of decision-making, which in practice leads to shorter or longer delays, which are partly inexplicable to other road users. In these situations it is not primarily the self-driving properties of the shuttle that lead to ambiguities in traffic, but the extra precautions that are taken to protect against more serious accidents and collisions. When analysing traffic situations, it is in practice difficult to distinguish between the two causes of ambiguity (i e., causes due to characteristics of the self-driving vehicle and causes due to the practical safety-approved implementation) as other road users must necessarily react to the overall driving pattern that they experience. However, it seems analytically relevant to emphasize that these different layers exist. It affects how mature the vehicles appear to be, both in relation to autonomous decision-making in traffic and in relation to the elementary driving characteristics. Technological development of the vehicles and changed implementation also affect the perceived properties of the vehicles, but on completely different grounds.
14.3 THE ACUTE UNEXPECTED STOPS
An emergency stop from 13‒15 km/h does not sound dramatic, but in practice the risk of these stops is a great challenge. It is hard to devise a plan to do away with the problems of abrupt unintended stops. The proportion of these stops that are caused by other road users can be prevented, but the stops caused by birds or leaves seem difficult to prevent in the implementation. These appear to be problems which require further development of the technology and adjustments to the interior of the shuttles, so that the steward responsible for safety and the passengers can be better secured in the event of abrupt braking. During the test, a notice fixed on the back of the shuttles warned following road users to keep their distance, but cyclists in particular did not seem to respond well to the warning.
20 Comments in travel-along interviews and survey 3.
14.4 WHAT DO THE LINC
PROJECT RESULTS TELL US ABOUT IMPLEMENTING AUTONOMOUS COLLECTIVE MOBILITY?
Due to the complex traffic environment on campus, the road test shows what characterises the situations where the self-driving shuttles are challenged. Leaving aside the problems with abrupt stops, which seem to be disabling to an operating situation, one lesson from the test is that the perceived maturity of the technology to a certain extent depends on the specific transport task it is employed to solve. Many turns, narrow streets, informal merging situations, crowding of busy road users, loosely regulated parking practices and many overhanging trees are elements that – perhaps unsurprisingly – make it difficult to insert an automated shuttle smoothly into traffic. If the situations are broken down into elemental components, one can identify four areas where even minor improvements would indicate a more mature technology.
1) Less and more suitable emergency braking: It is obvious that emergency braking can be vital in cases where it prevents accidents. Concerns about abrupt braking must therefore be balanced with the necessity of a “safety first” approach. At the same time, emergency braking poses a risk of collisions. With no seat belts fitted, or padding of equipment, the risk of passenger injury becomes particularly problematic. A sign of a higher degree of maturity will thus be that these various problems have been taken care of, either by systems being developed such that there are fewer false positives (i.e., situations where something that poses no risk of collision is interpreted as hazardous), or by developing measures that prevent unintended consequences of braking
2) Ability to read and be part of the social pattern in traffic: Traffic training of people typically revolves around knowing and complying with rules. Perhaps that is why it is easy to overlook that progress in mixed traffic is based on a degree of social responsiveness 21 “Social responsiveness” is in this context an expression of a basic form of communication, based on the ability to read and express intention and expectation. In traffic at DTU, this basic communication between road users enables a mutual adaptation – a form of negotiated taking and giving of time and space in traffic. It can be experienced as an expression of consensus and as an expression of conflict, but in both cases it constitutes a concluded negotiation, once two vehicles have passed each other in a place where the layout and the traffic meant that they had to take each other into account in order to move forward and avoid collision. The experience from the DTU campus shows that the self-driving shuttles are far from being able to be part of these basic but deeply social responsive interactions. A hypothesis could be that seamless interaction in traffic presupposes that automated and human road users act according to roughly the same mix of formal rules and mutual adaptation. A step towards a more seamless interaction could take the form of the shuttle being able to imitate some of the signs that human road users read; e.g., by pulling to the right on the roadway when you wish to signal that the oncoming car must pass first, or vice versa, pulling out when you wish to signal your intention to drive forward.
3) Ability to deviate from the virtual track in self-driving mode: The fact that the self-driving shuttles are bound to run on a defined line makes some passengers say that it might as well have rails. In fact, it would probably have been easier for road users to interpret the shuttles’ behaviour if we had painted on the asphalt the track they followed. The specific quality that distinguishes the self-driving shuttles from other road users is their perfect ability to repeat the same exact same behaviour every time they follow their route If the self-driving characteristics allowed for a more flexible relationship between location and route, the shuttle’s overall adaptation to traffic situations would increase significantly.
4) Autonomous handling of yield obligation: The road test at DTU did not show whether the self-driving shuttles have the capacity to comply with yield obligation, as the risk management in yield obligation situations was handled by letting the steward assess whether there was a free lane before driving.
21 This use of the concept of social responsiveness is a reference to Johan Asplund: Asplund, J. 1987. Det sociala livets elementäre former. Bokförlaget Korpen.
While in operation, the steward’s tab on the screen when entering a crossroads does not form a clear and time-consuming interruption of self-driving operation in the same way as, for example, a shift to manual driving. But in determining the maturity of the technology and the potential for transition to SAE 4 (with no steward onboard), these verifications actually constitute situations where the steward takes control of the vehicle. It will therefore indicate a more mature technology if it becomes possible to test yield situations in fully autonomous mode without compromising road safety.
As mentioned in the Introduction, it was originally intended that insights from operations on campus should be used as a reference point when introducing the shuttles in the less protected environment of Hersted Industrial Park, where traffic speeds are higher and where there are more heavy vehicles. The test at Hersted Industrial Park was not realised, for administrative reasons. But if it were to be carried out, experience from the DTU campus would indicate that the shuttles are currently not ready to operate at higher speeds due to the risk of unpredictable and unnecessary emergency stops.
One aspect of a potential future automated public transport service that we have not been able to investigate concerns how the social space inside the shuttles will be managed and negotiated by the passengers in a future where no steward is present. An investigation of this requires driving at SAE level 4, and will thus become possible to test and study only if or when this becomes a reality in future implementations.
15 APPENDIX: QUESTIONNAIRE SURVEYS 1 & 3
Ge!ing to know our testpassengers
-Welcome to the Linc autonomous shuttle research at DTU-campus
*Skal udfyldes
Thank you for your interest in our research and for the time you invest in the project. The answers you contribute are crucial for us. This survey takes approximately 5 minutes to complete.
The purpose of this first of four surveys is to provide a basis for the research on how the autonomous shuttles at DTUcampus are used and experienced. Data is processed in such a way that neither you nor others can be recognized. Information that allows your answers to be attributed to you will only be available to a narrow circle of Linc emplyees during data collection, and will not be passed on.
You can read more about the project and the research goals at https://lincproject.dk/
Questions about the survey can be send to postdoc Hannah Villadsen (haviel@ruc.dk), Department of People and Technology Roskilde University. 1.
UserID (please don't edit) *
Your associated id in the project. Please don't edit this field as it allows us to link your response future responses.
Linc is funded by:

In this section we ask a few questions about you and your background
Year of birth *
4.
Sex *
Markér kun ét felt.
Female
Male
Other
Prefer not to answer
Level of education *
Markér kun ét felt.
Primary and lower secondary school
Upper secondary education
Skilled worker
Short-cycle higher education
Medium-cycle higher education
long cycle higher education
Prefer not to answer
Andet:
5.
7. Occupation
Markér kun ét felt.
Andet: Student Employee Self employed Retired Unemployed
Prefer not to answer
6. Andet: Student Employee Visitor
Affiliation with DTU-campus *
The autonomous shuttles will be in operation at DTU-campus in April-Juli 2021. Please choose the option below that best describes your expected affiliation during that time.
Markér kun ét felt.
Background information
Year of birth *
In this section we ask a few questions about you and your background
9.
Sex *
Markér kun ét felt.
Female
Male
Other
Prefer not to answer
Level of education *
Markér kun ét felt.
Primary and lower secondary school
Upper secondary education
Skilled worker
Short-cycle higher education
Medium-cycle higher education
long cycle higher education
Prefer not to answer
Andet:
10.
Occupation
Markér kun ét felt.
11.
Prefer not to answer
Andet: Student Employee Self employed Retired Unemployed
Affiliation with DTU-campus *
The autonomous shuttles will be in operation at DTU-campus in April-Juli 2021. Please choose the option below that best describes your expected affiliation during that time.
Markér kun ét felt.
Andet: Student Employee Visitor Transport modes
This section is about which modes of transport you use in your everyday life and whether you have a transport need on the DTU campus
Yourprimarymode(s)oftransport
Indicate how you typically move between destinations in your everyday life. Only list modes of transport that you typically use at least weekly
Markér alle, du er enig i.
Bike/e-bike
Car
Public transport I walk
Andet:
13.
How do you typically arrive at the DTU campus
Markér alle, du er enig i.
Bike/e-bike
Car
Public transport I walk
Andet:
14.
DoyouneedtotransportyourselfbetweenbuildingswhenontheDTUcampus?
The autonomous shuttles run on campus April-July 2021. Please answer based on whether you expect to need to transport yourself between buildings on the DTU campus during this period. You have the option to specify if this depends on whether the corona restrictions on campus are relaxed.
Markér kun ét felt.
Yes, on a daily basis
Yes, weekly
Occasionally
Rarely
Never Gå til spørgsmål 21
Yes, but only in case campus is reopened
Andet:
15.
You have stated that you (possibly depending on the reopening of the campus) expect to need to move between buildings on the DTU campus while the autonomous shuttles are being tested This section deals with your use of campus and your experience of accessibility.
How do you usually move between different buildings on DTU-Campus? *
Markér alle, du er enig i.
Bike/e-bike Car I walk
Andet:
16.
Do you use the area south of Anker Engelundsvej (3rd and 4th quadrant)? *
The questions below relate to your movements on days when you are on the DTU campus
Markér kun ét felt.
I mainly stay in the 3rd or 4th quadrants when I am at DTU
I often go to 3rd or 4th quadrants when at DTU
I rarely/never go to 3rd or 4th quadrants when at DTU
Don't know
Andet:
17.
How do you experience the accessibility on the DTU campus? *
Indicate how much you agree with the statements below:
Markér kun ét felt pr. række.
Get Gettting ing ar around ound campus campus is is easy easy
It' It'ss easy easy ttoo find find yyour our w waayy ar around c ound camampus pus
Ther There ar e are t e toooo m many c any carars o s onn ca campus mpus
Ther There ar e are t e toooo ffew ew par pa rking king spac spaces o es on c n camampupuss
Strongly agree Agree
Neither agree or disagree Disagree
Strongly disagrees Don't know
18.
Do you experience other challenges with accessibility on campus?
19.
Expectations for the usefulness of the autonomous shuttles for you
Indicate how much you agree with the statements below:
Markér kun ét felt pr. række.
Strongly agree Agree
Neither agree or disagree Disagree
Strongly disagree Don't know
Autonomous shuttle service between central buildings at DTU will make it easier for me to get around
Autonomous shuttle service between central buildings at DTU will make it easier for me to get around
I will use the autonomous shuttles if their route suits my needs
I will use the autonomous shuttles if their route suits my needs
20.
Iwillatmostbewillingtowaitforanautonomousshuttlethatcantransportme fromAtoBoncampusfor:*
Markér kun ét felt.
Not willing to wait
Up to 5 minutes
Up to 10 minutes
Up to 20 minutes Don't know
Andet:
Knowledge and experience with autonomous transport
The questions in this section relate to your knowledge and interest in automated technology and transportation
21.
Have you previously tried an autonomous vehicle? * Please disregard driverless transport on rails (e.g. Copenhagen Metro)
Markér kun ét felt. Andet: Yes
22.
Intrest *
Markér kun ét felt pr. række.
Strongly disagree
I have a great interest in: Automation
I have a great interest in: Automation
I have a great interest in: Transportation
I have a great interest in: Transportation
I have a great interest in: New technology in general
I have a great interest in: New technology in general
23.
Areyoutypicallyamongthelastorthefirsttouseand/orrecommendnew technology?*
If you had to compare your general attitude towards new technology with the general attitude of other people, where would you place yourself?
Markér kun ét felt.
Last 1 2 3 4 5 6 7 8 9
24.
My interest in becoming a test passenger is primarily:
Markér alle, du er enig i.
Professional
Personal
Out of curiosity
I wish to contribute to research and knowledge building
Andet:
Expectations for autonomous road transport
25.
This section relates to your expectations for autonomous shuttles at DTU and autonomous technology more generally.
I expect that the autonomous shuttles on campus will be faster than: *
Markér alle, du er enig i.
Walking
Biking
Driving by car (including parking)
26.
Within 15 years, autonomous vehicles will be:
Markér kun ét felt pr. række.
Strongly agree Agree
Neither agree or disagree Disagree
Strongly disagree
The most common type of vehicle
The most common type of vehicle
The most comfortable type of vehicle
The most comfortable type of vehicle
The safest type of vehicle
The safest type of vehicle
Markér kun ét felt pr. række.
Autonomous buses will make the public transport of the future Strongly
More expensive
More expensive
Harder to use
Harder to use
Less safe
Less safe
More environmentally friendly
More environmentally friendly
You have reached the end - Thank you so much for your reply
This questionnaire forms the basis for the future studies that will take place as part of the LINC project.
One of the next few days you will receive a link to participate in a survey that is specifically about your preferences in relation to choosing an autonomous option as part of your travels.
You can find further information about LINC at https://lincproject.dk/

Experienceswiththeself-drivingshu!leson DTUcampus
Thank you for your interest in our research and for the time you invest in the project. This survey takes approximately 10-12 minutes to complete.
In this survey, we ask you to give us an insight into your experiences with the self-driving shuttles at DTU - whether you have encountered them as a pedestrian, cyclist, motorist or as a passenger.
Your data
Data is processed in such a way that neither you nor others can be recognized. Information that allows your answers to be attributed to you will only be available to a narrow circle of Linc emplyees during data collection, and will not be passed on.
You can read more about the project and the research goals at https://lincproject.dk/.
Questions about the survey can be send to postdoc Hannah Villadsen (haviel@ruc.dk), Department of People and Technology, Roskilde University.
*Skal udfyldes
UserID
(please don't edit)
Please don't edit this field.
Linc is funded by:
Have you encountered the self-driving shuttles at DTU?
2.
Haveyouencounteredtheself-drivingshuttleseitherasapedestrian,cyclist,motorist orpassenger?*
Markér kun ét felt.
No, I have no experience at all with the self-driving shuttles on campus Gå til spørgsmål 49
Yes Gå til spørgsmål 3
Encounters as a pedestrian on campus
3.
Have you encountered the self-driving shuttles as a pedestrian on campus? *
Markér kun ét felt.
Yes Gå til spørgsmål 4
No Gå til spørgsmål 13
Pedestrian experience of the self-driving shuttles on campus
4.
I feel it is safe to be a pedestrian in the vicinity of the shuttle *
Markér kun ét felt. Strongly agree
Asapedestrian,itiseasytoreadthesignalsoftheself-drivingshuttlewhenitis abouttoturn*
Markér kun ét felt.
Itiseasyasapedestriantoassesswhentheself-drivingshuttlewilldriveforwardor givewayintraffic*
Markér kun ét felt.
Itsometimesseemsinexplicablethattheshuttlestopsorslowsdownwhenithasto passme*
Markér kun ét felt.
Strongly agree
Strongly disagree
Asapedestrian,Ihavebecomebetteratreadingtheshuttle'ssignalsafterinteracting withit afewtimes*
Markér kun ét felt.
Strongly agree
Strongly disagree
Asapedestrian,ittakesmorepatiencetogetaroundintrafficwhenthereisa self-drivingshuttleontheroad*
Markér kun ét felt.
Strongly agree
Strongly disagree
Hasaself-drivingshuttlebrakedharshlyorunexpectedlyinawaythatwas uncomfortableforyouasapedestrianinitsvicinity?*
Markér kun ét felt.
Andet: yes No
Hasaself-drivingshuttlefailedtobrakeinsituationswhereyou,asapedestrianon campusthinkitshouldhavesloweddownorstoped?*
Markér kun ét felt.
Andet: Yes No
Pleaseshareanyfurthercommentsonyourexperienceoftheself-driving shuttlesasapedestrian...
Encounters as a cyclist on campus
13.
Have you encountered the self-driving shuttles as a cyclist on campus? *
Markér kun ét felt.
Yes Gå til spørgsmål 14
No Gå til spørgsmål 23
Cyklist experience of the self-driving shuttles on campus
14.
I feel it is safe to be a cyklist in the vicinity of the shuttle *
Markér kun ét felt.
Strongly agree 1 2 3 4 5
Strongly disagree
Asacyclist,itiseasytoreadthesignalsoftheself-drivingshuttlewhenitisabout toturn Markér kun ét felt.
Strongly agree
Itiseasyasacyclisttoassesswhentheself-drivingshuttlewilldriveforwardorgive waytraffic*
Markér kun ét felt.
Strongly agree
Strongly disagree
ItsometimesseemsinexplicablethattheshuttlestopsorslowsdownwhenIpassit onmybike*
Markér kun ét felt.
Strongly agree
Strongly disagree 18.
Asacyclist,Ihavebecomebetteratreadingtheshuttle'ssignalsafterinteracting withitafewtimes*
Markér kun ét felt.
Strongly agree
Strongly disagree
As a cyclist, it takes more patience to get around in traffic when there is a self-driving shuttle on the road *
Markér kun ét felt.
Strongly agree
Strongly disagree
Hasaself-drivingshuttlebrakedharshlyorunexpectedlyinawaythatwas uncomfortableforyouasacyclistinitsvicinity?*
Markér kun ét felt.
Hasaself-drivingshuttlefailedtobrakeinsituationswhereyou,asacycliston campus,thinkitshouldhavesloweddownorstoped?*
Markér kun ét felt.
Pleaseshareanyfurthercommentsonyourexperienceoftheself-driving shuttlesasacyclist...
Encounters as a motorist on campus
23.
Have you encountered the self-driving shuttles as the driver of a car? *
Markér kun ét felt.
Yes Gå til spørgsmål 24
No Gå til spørgsmål 33
Motorist experience of the self-driving shuttles on campus
24.
I feel it is safe to be driving a car in the vicinity of the shuttle *
Markér kun ét felt.
Strongly agree 1 2 3 4
Strongly disagree
Asamotorist,itiseasytoreadthesignalsoftheself-drivingshuttlewhenitis abouttoturn*
Markér kun ét felt.
Itiseasyasamotoristtoassesswhentheself-drivingshuttlewilldriveforwardor givewayintraffic*
Markér kun ét felt.
ItsometimesseemsinexplicablethattheshuttlestopsorslowsdownwhenIdrive
passit Markér kun ét felt.
Strongly agree
Strongly disagree
Asamotorist,Ihavebecomebetteratreadingtheshuttle'ssignalsafterinteracting withitafewtimes*
Markér kun ét felt.
Strongly agree
Strongly disagree
Asamotorist,ittakesmorepatiencetogetaroundintrafficwhenthereisaselfdrivingshuttleontheroad*
Markér kun ét felt.
Strongly agree
Strongly disagree
Hasaself-drivingshuttlebrakedharshlyorunexpectedlyinawaythatwas uncomfortableforyouasamotoristinitsvicinity?*
Markér kun ét felt.
Andet: yes No 31. Andet: Yes No
Hasaself-drivingshuttlefailedtobrakeinsituationswhereyou,asamotoriston campus,thinkitshouldhavesloweddownorstoped?*
Markér kun ét felt.
32.
Pleaseshareanyfurthercommentsonyourexperienceinteractingwiththeselfdrivingshuttlesbycar...
Have you tried the shuttles?
33.
Have you been a passenger on board one of the self-driving shuttles? *
Markér kun ét felt.
Yes Gå til spørgsmål 34
No Gå til spørgsmål 42
Experience as a passenger on board the self-driving shuttles
34.
I find the shuttle speed satisfactory *
Markér kun ét felt.
Strongly agree 1
Strongly disagree
35.
I am happy with the interior design of the shuttle *
Markér kun ét felt.
Strongly agree
Strongly disagree
36.
I find it safe to ride in the shuttle *
Markér kun ét felt.
Strongly agree
Strongly disagree
37.
As a passenger in the shuttle, have you experienced the shuttle braking harshly? *
Markér kun ét felt.
Yes Gå til spørgsmål 38
No Gå til spørgsmål 41
Abrupt braking
38.
Did you experience the braking incident as unexpected
Markér kun ét felt.
Not unexpected at all
very unexpected
39.
Did you experience the braking incident at uncomfortable?
Markér kun ét felt.
Very uncomfortable
Not at all uncomfortable
Doyouthinkthatthebrakingincidentposedariskofinjurytopersonsorluggage onboardtheshuttle?
Markér kun ét felt.
Comments from passengers
41.
Pleaseshareanyfurthercommentsonyourexperienceasapassengeronselfdrivingshuttles...
42.
Have you already answered the LINC Welcome survey with background questions?
Markér kun ét felt.
Yes Gå til spørgsmål 49
No Gå til spørgsmål 43
Don't remember Gå til spørgsmål 43
Background information
43.
Year of birth *
44.
Sex *
Markér kun ét felt.
Female
Male
Other
Prefer not to answer
45.
Level of education *
Markér kun ét felt.
Primary and lower secondary school
Upper secondary education
Skilled worker
Short-cycle higher education
Medium-cycle higher education
long cycle higher education
Prefer not to answer
Andet:
46.
Occupation *
Markér kun ét felt.
Student Employee
Self employed
Retired
Unemployed
Prefer not to answer
Andet:
47. Markér kun ét felt. Last
Areyoutypicallyamongthelastorthefirsttouseandorrecommendnew technology?*
If you had to compare your general attitude towards new technology with the general attitude of other people, where would you place yourself?
48.
Yourprimarymode(s)oftransport*
Indicate how you typically move between destinations in your everyday life. Only list modes of transport that you typically use at least weekly
Markér alle, du er enig i.
Andet: Bike/e-bike Car Public transport I walk
That was all. Thank you for your reply!
49.
Doyouhaveadditionalfeedbackregardingthetestingofself-drivingshuttlesat DTU?