


across Glasgow City Region


November 2024
Prepared
by:
Lorna Cole, Harry Fisher and Jack Zuill
This project was funded by The Green Action Trust, East Dunbartonshire Council, West Dunbartonshire Council, Renfrewshire Council, South Lanarkshire Council, North Lanarkshire Council, Inverclyde Council and Glasgow City Council
Acknowledgements
This project relied heavily on the input and support of the steering group, including GCVGN’s Alastair Corbett and Rory McLeod, Professor Rob Briers from Edinburgh Napier University, and Craig Macadam from Buglife Scotland. We would also like to thank Keith Watson (Botanical and Ecological Consultant) and Michael Philip (Field Botany: Consultancy & Training; BSBI vice-county co-recorder for Lanarkshire (vc77) and coordinator of the Renfrewshire vice-county (vc76) Botany Network) who helped with sense checking outputs. We also would like to acknowledge the Wildfowl and Wetland Trust, Green Action Trust and NatureScot for their input throughout this project.
This work strongly drew on biological records indicating the value of record collection and collation. We would therefore like to thank the following recording schemes, and all those contributing records to these schemes, for providing us with data and/ the permission to use their data in this research through requests via the NBN Gateway.
Adrian Sumner, Balfour-Browne Club, Biological Records Centre, British Dragonfly Society, Buglife, Caddisfly Recording Scheme, Biological Records Centre, Caledonian Conservation Ltd, Conchological Society of Great Britain & Ireland, Dipterists Forum, and Biological Records Centre, Earthworm Society of Britain, Forest Research, Highland Biological Recording Group, iNaturalist, Marine Biological Association and Biological Records Centre, National Museums Scotland, National Trust for Scotland, Natural Resources Wales, Pond Conservation, Riverfly Recording Schemes, Scotland's Environment Web and Biological Records Centre, Scottish Environment Protection Agency, Scottish Wildlife Trust, Seasearch, Soldierflies and Allies Recording Scheme, and Biological Records Centre, The Conservation Volunteers Scotland, UK Cranefly Recording Scheme, and Biological Records Centre, UK Trichoptera (Caddisfly) Recording Scheme, University of Central Lancashire.
In addition to these, we would like to thank the following recording schemes for independently providing biological records and advice for this research: Froglife, Leech Recording Scheme, Aquatic Heteroptera Recording Scheme, Glasgow Museums Biological Records Centre, Buglife, South West Scotland Environmental Information Centre, Amphibian and Reptile Conservation.
Additionally, we would like to show our gratitude to the Botanical Society of Britain & Ireland BSBI) for providing lists of indicator plants for key wetland types and over 68,403
Glasgow City Region: Wetland Opportunity Mapping
records and to Dr Kevin Walker for summarising the BSBI records into a user-friendly format.
Finally, we would like to thank Professor Garth Foster and Professor Roger Downie who provided scientific papers with valuable information regarding wetland location and species records
Disclaimer: This report has been prepared for The Glasgow and Clyde Valley Green Network using the best data available at the time, in terms of coverage, extent and accuracy however, it is recognised that spatial data has inaccuracies. Given the high number of datasets used from a range of sources, SAC Consulting can take no responsibility for actions taken by any third party arising from their interpretation of the information contained in this document. While the outputs of this report can and should be used to support decision-making, final decisions should be sense-checked and supported by local knowledge.
Contacts:
GCV Green Network
Room 2.29
City Chamber East Glasgow G1 1JL Enquiries@gcvgreennetwork.gov.uk
Dr Lorna J Cole
SAC Consulting Auchincruive Estate
AYR, KA6 5HW
Call: 01292 525 295
Email: Lorna.Cole@sac.co.uk
Glasgow City Region: Wetland Opportunity Mapping
Wetlands are becoming increasingly recognised for both their conservation value and the wider benefits they bring to people, such as improving water quality, “slowing the flow” to reduce flooding, and storing carbon. Despite this value, wetlands have been decimated across the UK, with an estimated 75 % lost over the last 300 years. Our remaining wetlands continue to face a variety of threats including urbanisation, agricultural intensification, forestation, and are particularly vulnerable to the effects of climate change.
To better understand the situation in Glasgow City Region, GCVGN commissioned this study on behalf of partners to identify what type of wetlands remain, where they are located, and how well-connected they are for species moving through the landscape. This knowledge will help to provide a framework to aid the targeting of resources for wetland creation and expansion.
The study outputs will also underpin the identification and delivery of Wetland Nature Networks, a new requirement for local authorities through the 4th National Planning Framework. Nature Networks provide a strategic approach to wetland creation, alongside other habitat types, while increasing the resilience of these habitats in the face of climate change and other pressures, securing the benefits they provide for people and wildlife.
Using a combination of existing data, newly created data, biological records and expert stakeholder input, the study sought to identify a broad range of wetland types, assess and map the extent of habitat connectivity/fragmentation, and identify “opportunity areas” where habitat creation and expansion could enhance connectivity. By considering all wetland types, including the role of watercourses in species movement, the work moves beyond previous wetland analysis in our region which focused on fen, marsh and swamp.
The study identified around 12,000 wetland habitat patches across the GCR area, including many wetland habitats of high conservation value. Biological records were cross-referenced with the wetlands to sense check their continued existence, and as a proxy for quality.
GIS ‘least-cost’ network analyses were then used to model habitat 125 m, 500 m and 1000 m networks for generic wetland species with varying dispersal abilities (i.e. the ease or difficulty a species experiences moving through different types of landscape).
The study found, perhaps not unsurprisingly, that lowland wetland networks tended to be more fragmented due to the small size and low frequency of habitat patches, alongside the high costs associated with species moving through built environments and agricultural land. Upland habitats and networks tended to exist as more extensive mosaics of different wetland types, that were generally isolated from each other. Both situations highlight the importance of a programme of action to secure and expand existing wetland habitats, and to create new wetland habitats, particularly in key locations targeted to enhance connectivity.
Glasgow City Region: Wetland Opportunity Mapping
The final step was opportunity mapping, which provided an important tool to help spatially target future wetland creation or expansion. This exercise allowed us to identify over 2,000 opportunity areas where the creation of new wetlands or the expansion of existing wetlands would enhance wetland connectivity.
This new and innovative work will make a significant contribution to collective knowledge and provide a sound basis on which to develop policy and target action. It is intended to be an approach that can be replicated across other areas of Scotland and at a range of scales.
There are several different definitions of wetlands, with broader definitions including estuarine and coastal habitats while more narrow definitions exclude rivers and standing waterbodies. We feel that the Wildfowl & Wetlands Trust definition that wetlands are “unique ecosystems that are either permanently or seasonally inundated with water 1” is an appropriate middle ground. Scotland supports a range of different wetland habitats from small village ponds to valley fens to active blanket bogs. Wetlands habitats support distinctive communities and can be rich in biodiversity.
Wetlands provide a range of ecosystem services, and these services depend on wetland type, size and location. It has been estimated that the ecosystem services provided by wetlands are worth up $15 trillion annually 2. Wetlands habitats often interface between terrestrial and aquatic ecosystems, and they can play a crucial role in capturing and removing pollutants.
Wetlands support unique assemblages of plants and animals and are of global conservation importance. While some species are solely or largely restricted to wetland habitats (e.g. marsh marigold and water scorpions), others rely on wetlands during key phases of their lifecycle. For example, peatlands provide important breeding sites for wading birds such as the curlew and lapwing, while mayflies and stoneflies rely on ponds and rivers to breed.
Wetlands play an integral role in helping us mitigate against and adapt to climate change. They slow down the decomposition rate of active bogs and fens resulting in the formation of peat which locks in carbon. Wetland habitats can also help regulate water flows reducing flood risk. The restoration of peatlands, re-meandering of watercourses and establishment of flood plains and riparian woodlands all provide natural flood defence. In towns, sustainable urban drainage systems are becoming increasingly common to provide flood storage areas and reduce pollution risks associated with urban runoff.
Wetlands face a cocktail of different pressures, and their degradation and loss are thought to exceed that of any other ecosystem2. It has been estimated that in the UK alone 75% of wetlands have been lost over the last 300 years 3 Across Scotland, wetland habitats were drained to make way for agricultural production, and ponds that were once relied upon as a water source were filled in. Wetlands face grazing pressure by deer and livestock, and are vulnerable to changes in water chemistry, with standing water bodies being particularly at risk from pollutants (e.g. heavy metals, pesticides and nutrients). These pressures have resulted in the degradation of wetlands, changes in
1 WWT (2023) Wetlands for Carbon Storage: Creating and managing saltmarshes to store blue carbon in the UK- A Route Map https://www.wwt.org.uk/uploads/documents/2023-01-30/wwt-blue-carbon-route-map-2023.pdf
2 Millenium Ecosystem Assessment, 2005. ECOSYSTEMS AND HUMAN WELL-BEING: WETLANDS AND WATER Synthesis. World Resources Institute, Washington, DC. https://www.millenniumassessment.org/documents/document.358.aspx.pdf
3 Fluet-Chouinard, E. et al. (2023) Extensive global wetland loss over the past three centuries. Nature 614, 281–286. https://doi.org/10.1038/s41586-022-05572-6
Glasgow City Region: Wetland Opportunity Mapping
botanical communities, with specialist species being replaced by more generalist plants 4 .
While wetlands provide a key vehicle to help combat climate change, they are themselves extremely vulnerable to climate change. In Scotland, wetlands are expected to be impacted by both changes in temperature and precipitation patterns. Increased temperatures could impact on the species that can survive, and an increased prevalence of summer droughts will result in some wetlands drying out. Improving connectivity is crucial to enhance the resilience of wetland communities to climate change, and indeed wider environmental change.
Many semi-aquatic species exist as metapopulations, moving between habitats, and restoring connectivity between isolated habitat pockets is crucial not only to help mitigate impacts of environmental change, but also to enhance genetic diversity 5
With land under increasing pressure (development, agriculture, conservation), there is a need to ensure that action is spatially targeted to optimise the benefits gained. Targeting habitat creation to create stepping stones and corridors through our towns and countryside will ensure that ecosystems can adapt to environment change. Such targeted action is fundamental to the Scottish Government’s commitment to create Nature Networks across Scotland to enhance ecosystem health, sustainability, and resilience. Through creating Nature Networks and protecting at least 30 % of land and seas for nature by 2030 (the 30x30 target) Scotland is committed to reverse biodiversity loss by 2030 and to restore and regenerate biodiversity by 2045.
Recognising the vulnerability of wetlands, their role in the conservation of biodiversity, and the need for a cross-boundary approach to Nature Networks, GCVGN worked with the eight local authorities that comprise GCR to agree on a regional approach that would deliver the best outcomes at scale. SAC Consulting were then commissioned to undertake the work on behalf of partners.
The approach had three distinct stages. Firstly, extensive consultation and research was undertaken to identify existing wetland habitat patches of a range of types. Secondly, GIS modelling based on those habitat patches produced habitat networks representing the dispersal abilities of different wetland species Lastly, opportunity areas were identified where the creation of new wetlands could enhance connectivity, reverse fragmentation and help deliver Nature Networks
4 Britton, A. et al (2017) Pollution and climate change drive long-term change in Scottish wetland vegetation composition – ScienceDirect https://doi.org/10.1016/j.biocon.2017.04.005
5 Lawton, J.H., et al (2010). Making space for nature: a review of England’s wildlife sites and ecological network. Department for Food. Agriculture and Rural Affairs, London. https://www.scambs.gov.uk/media/19116/cd517-the-lawton-report.pdf
Glasgow City Region: Wetland Opportunity Mapping
Overview
The methodology involved three broad steps. Firstly, we identified sites with a high potential to be wetland habitats through integrating local knowledge, biological records and existing spatial datasets. We then conducted habitat network modelling using leastcost modelling approach. Networks were conducted for 125 m, 500 m and 1000 m dispersal distances to reflect mobile and less mobile species. Distances were based on a range of wetland species, with 125 m reflecting low mobility species such as Gastropoda species, 500 m reflecting moderate dispersal species such as Great Crested Newt (Triturus cristatus) 6 , and 1000 m dispersal distance to reflect highly mobile species such as caddisflies 7. Finally, we conducted opportunity mapping to help identify potential locations where the creation of new wetlands could restore connectivity. Such opportunity areas will help local authorities target action on the ground. An overview of the full process is provided in Figure 1.
There are a wide range of different wetland habitats, which will vary in their ability to support wetland communities. Our network modelling took a holistic generic focal species approach to identify core wetland habitats. As a starting point, with input from the steering group, we evaluated habitats included in the SNIFFER Functional Wetland Typology for Scotland 8. Of the 11 SNIFFER wetland types, nine occur in the project area (Table 1).
The SNIFFER wetland typologies did not include any standing or running freshwater habitats. Such habitats can provide resources for a diversity of aquatic and semiaquatic species including amphibians, aquatic plants and a wide range of invertebrates. Consequently, it was decided to include both standing and running freshwater habitats in the modelling process. All habitats that were evaluated are listed in Table 1
6 Langton, T.E.S., Beckett, C.L., and Foster, J.P. (2001) Great Crested Newt Conservation Handbook, Froglife, Halesworth. https://www.froglife.org/info-advice/our-publications/great-crested-newt-conservation-handbook/
7 Arce. A.P., Horren, T., Schletterer, M., Kail, J., (2021). How far can EPTs fly? A comparison of empirical flying distances of riverine invertebrates and existing dispersal metrics. “Ecological Indicators”. Vol 125. https://doi.org/10.1016/j.ecolind.2021.107465
8 Sniffer (2009) WFD95 A Functional Wetland Typology for Scotland Field Report https://www.sniffer.org.uk/wfd95-a-functional-wetlandtypology-for-scotland
Glasgow City Region: Wetland Opportunity Mapping

Glasgow City Region: Wetland Opportunity Mapping
Table 1: Overview of wetland habitats, including information on whether each habitat was considered as core habitat or not.
Wetland habitat type Comments
SNIFFER habitats
Wet woodland
Wet Grassland
Seepage/ flush/ spring
Fen
Swamp
Reedbed
Wet heath
Bog
Saltmarsh
Other wetland habitats
Standing water (lakes, ponds)
Running water (rivers, burns)
Riparian habitats
Identification of wetlands
Core habitat (if coincides with a site designated for nature conservation)
Core habitat (if coincides with a site designated for nature conservation)
Core habitat
Core habitat
Core habitat
Core habitat
Core habitat
Core habitat (where supplementary evidence highlighted natural / good condition)
Non-core wetland
Core habitat
Core habitat (where gradient data = 0)
Non-core habitat unless underlying habitat is core
To identify wetland habitats, we integrated information derived from the following sources:
1. Existing spatial datasets – With the recent SEPA Scottish Wetlands Inventory 9 capturing SNIFFER typologies and OS MasterMap Networks– Water Layer 10 providing coverage of rivers, streams, lakes, reservoirs and canals, Wetland habitats were relatively well captured within spatial datasets.
2. Local Knowledge - To supplement spatial data, prior to project commencement the Clyde Valley Green Network (GCVGN) liaised with local authorities to identify, and map known wetland sites.
3. Records of indicator flora species – Using BSBI lists of wetland indicator plants and their associated plant records to identify wetland hotspots.
4. Records of indicator fauna species – Using invertebrate and amphibian records from a host of sources to identify wetland hotspots.
9 Scottish Government (2024) Scottish wetland inventory https://www.data.gov.uk/dataset/f7ab5d9c-034f-43e0-8f34b027b6ca0e6a/scottish_wetland_inventory
10 Ordnance Survey: OS MasterMap Networks - Water Layer https://www.ordnancesurvey.co.uk/products/os-mastermap-networks-waterlayer
Glasgow City Region: Wetland Opportunity Mapping
Identification of wetlands: existing spatial datasets and local knowledge
To identify wetlands from existing spatial datasets, the following datasets were explored:
• SEPA Scottish Wetlands Inventory (SWI): Comprising NatureScot Phase 1 data 11 and NatureScot National Vegetation Classification (NVC) Survey 12 for wetland habitats.
• OS MasterMap Water Network Layer.
• NatureScot Habitat Map of Scotland (HabMoS): Layer used based on NVC data converted to the EUNIS classification system 13
• UKCEH Land Map 2021 14
• Ordinance Survey MasterMap 2023 15 .
• GCVGN: Local Authority Data Phase 1 16 .
• GCVGN: SSSI data12
• GCVGN: SINC data12
• GCVGN: Local Authority Data Wetland Sites12
The datasets listed above contain spatial data identified through different methods and, in some instances, there is overlap between these datasets (e.g. Scottish Wetlands Inventory and HabMoS). Each datasets had their strengths and weaknesses when it came to identifying wetlands (Table 2). The datasets strengths and weaknesses were dependent on the following variables:
• Accuracy of survey - How accurate the survey is with respect to the identification of habitat type and its extent.
• Detail of classification – What level of detail wetlands are identified to (e.g. is the data EUNIS level 2 or 4).
• Age of the data – How old the data is, with older datasets being of lower quality due to land use change.
• Coverage - The spatial extent of the dataset, with coverage being particularly high for remotely sensed data.
11 NatureScot Spatial Data Hub https://opendata.nature.scot/
12 NatureScot (2023) National Vegetation Classification NVC https://opendata.nature.scot/maps/ceef41b67381493a8d2d1633e5ceb2f8/about
13 NatureScot (2017) Commissioned Report 766: Manual of terrestrial EUNIS habitats in Scotland https://opendata.nature.scot/
14 UK Centre for Ecology & Hydrology: UKCEH Land Cover Maps https://www.ceh.ac.uk/data/ukceh-land-cover-maps
15 Ordnance Survey: OS MasterMap Topography Layer https://www.ordnancesurvey.co.uk/products/os-mastermap-topography-layer
16 Provided directly from Glasgow and Clyde Valley Green Network
Glasgow City Region: Wetland Opportunity Mapping
Table 2: Strengths and weaknesses of the spatial datasets
Data source Survey type Accuracy of survey Detail of classification Age of data Coverage
NatureScot Phase 1 data (As part of SEPA SWI) Ground
NatureScot: National Vegetation
Classification survey (as part of SEPA SWI) Ground
NatureScot: HabMoS layer used based on NVC Hybrid
NatureScot: Raised Bog Mapping data Hybrid
GCVGN SSSI data Ground
UKCEH Land Cover Map 2021 Remote
Ordinance Survey Master Map Hybrid
Local Authority Data Phase 1 Ground
Local Authority Data
Wetland Sites Ground
Local Authority Data SINC data Ground
NatureScot’s National Vegetation Classification (NVC), which is derived from detailed plant surveys on the ground, provides high accuracy with respect to the detail of classification but the data were spatially limited and out of date. UKCEH Land Cover Map, on the other hand, classifies satellite data into habitats using artificial Intelligence. The resultant map provides comprehensive coverage, however, it has inaccuracies due to the limitations of remote sensing. A description of each dataset and how it was treated is provided in (Table 3).
Evaluation of wetland habitats identified through spatial data
Different wetland habitats vary in their potential to act as core wetland habitats and additionally, spatial datasets vary in their accuracy. How we utilised and extracted spatial data, therefore depended on both the wetland type, and the spatial dataset. Habitat polygons in spatial dataset were categorised as either:
• Core Wetland Habitat – Habitat polygons with a high likelihood to be wetlands, selected from datasets with a high level of accuracy/classification.
• Non-Core Wetland Habitat – Habitat polygons for wetland habitats that were deemed unlikely to function as core wetlands but could enhance the permeability of the surrounding landscape.
Each wetland habitat was evaluated and assigned to either core, or non-core wetlands. Decisions were agreed with the steering group and are outlined below.
All Standing freshwater habitats (i.e. ponds, lochs, reservoirs and canals) were included as core wetland habitats except for those where human influence is likely to render them unsuitable for wetland species (e.g. aqueducts, canal feeders). Following discussion with the steering group it was decided to include reservoirs as core habitat, as many reservoirs in the catchment were not active.
Due to the high salinity of Saltmarsh, this habitat supports a unique assemblage of highly specialised species, and thus it was decided not to include saltmarsh as core wetlands. With saltmarsh rare in the area (a small area in the northwest of Renfrewshire), its exclusion will have little impact on the final networks.
Bogs were common in upland areas of the region, however, 80% of Scottish bogs are in a degraded condition 17 limiting their potential to function as wetlands. Consequently, bogs were only included if there was evidence to suggest they were in good or natural condition. Specifically, raised bogs from the NatureScot raised bog inventory were only included where they were listed as ‘D1.11 – Active, relatively undamaged raised bogs’. For blanket bogs, only those that intersected areas designated for nature conservation (SSSI, SAC, SPA), or where supplementary information demonstrated they were in a good or natural condition, were included as core habitat.
For Running water, it was recognised that the viability of rivers to support aquatic invertebrates is influenced by several factors including anthropogenic modifications, temperature, chemistry, and flow rate. Spatial data is not comprehensively available for all these factors. The OS MasterMap Water Network Layer contains information on the slope of river sections providing a proxy for flow rate (assumption that rivers flow more quickly on steeper ground). Following discussion with the steering group, we decided to exclude fast flowing rivers, which are unlikely to act as core habitat for many wetland species. Linear features were first turned into polygons by buffering the OS MasterMap Water Network Layer. Initially, rivers with a gradient of <0.7 m/100 m (approximately 10% of the water courses in the catchment) were selected and buffered. The resultant networks indicated extremely high connectivity across lowland areas of the region, which were typically flatter in nature. It was felt that including these rivers as core habitat was leading to an over estimation of ecological connectivity. In agreement with the steering group our final modelling only included river sections with a slope of zero as core wetlands. River sections with a gradient of 0.1 m - 0.7 m/100 m were included as non-core wetland. Additionally, to ensure consistency with the removal of saltmarshes as core habitat (see above), rivers classified as ‘Tidal’ under river-type were also assigned as non-core wetlands on account of their high salinity reducing their suitability for wetland species.
17 Scotland’s soils (2024) Peatland restoration: Why restore peatland? https://soils.environment.gov.scot/resources/peatlandrestoration/#:~:text=Scotland%27s%20peat%20soils%20cover%20more,of%20our%20peatlands%20are%20degraded
Wet woodland and Wet grassland were also extremely common in lowland areas of the region and these can provide valuable habitat for wetland species. Their value, however, is strongly dependent on their quality and management. In agreement with the steering group wet woodlands and wet grasslands were assigned as core wetland habitat if they coincided with a site designated for nature (e.g. SSSI, SPA, SAC). All other wet woodlands and wet grasslands were extracted and included as non-core wetlands.
Recognising the value that riparian zones can play in enhancing ecological connectivity, the decision was made to include these in our network modelling. To achieve this, OS MasterMap Networks – Water Layer data was buffered, and the resultant buffer was used to clip polygons from OS MasterMap. Through discussion with the steering group, it was agreed that wider rivers typically have a greater riparian area, therefore, river width should dictate buffer width. As such, rivers with a width of ≤2 m were buffered by 1 m either side (2 m buffer), whilst watercourses with a width of >2 m were buffered by 2.5 m either side (5 m buffer).
Once buffers were in place, the river area was deleted, leaving two strips either side of the watercourse. The resultant polygons were then used to clip the OS MasterMap layer to create a new riparian layer consisting of OS Master Map habitats adjacent to rivers. Whether these areas were classified as core or non-core wetland depended on what OS MasterMap habitat they clipped out. Details on how each riparian habitat was assigned a cost can be found in Annex 5
It was also agreed that riparian areas within agricultural land would be less suitable for wetland species, and as such any riparian areas that clipped OS Master Map habitat ‘Agricultural land’ were only included where the river width was >2 m, and the buffer size was reduced from 5 m to 2.5 m (1.25 m either side).
A comprehensive list of all spatial datasets used to identify wetland habitats alongside a description of how each dataset was used is provided in Table 3. Further details on the habitat categories selected as core and non-core wetlands are provided in Annex 2 and 5.
Glasgow City Region: Wetland Opportunity Mapping
Table 3: Overview of spatial datasets used to identify wetland habitats and description on how these datasets were used.
Data & Source Description
NatureScot Phase 1 data (As part of SEPA SWI)14
NatureScot Phase 1 vegetation data as part of SEPA’s Scottish Wetland Inventory. This consists of Phase 1 wetland habitats which have been assigned to SNIFFER typology.
Use
Dataset was clipped to the boundary of GCR area, and entire dataset was used. All habitat polygons listed as the SNIFFER habitats considered to be core wetland as shown in Table 1 included.
Details of Phase 1 codes alignment with SNIFFER types and subsequent inclusion in either core or non-core wetlands are included in Annex 5
NatureScot: National Vegetation Classification (NVC) survey (As part of SEPA SWI)9
NatureScot NVC vegetation data as part of the SEPA Scottish Wetland Inventory. This consisted of NVC wetland habitats which have been assigned to SNIFFER typology.
NatureScot: HabMoS layer used based on NVC 18
NatureScot: Raised Bog Mapping data
Amalgamation of different spatial datasets. Habitats are categorised based on the EUNIS habitat classification system (level 2 to level 5).
Polygon dataset for raised bog sites in Scotland, created by NatureScot using aerial photography and soil data, reassessing the original lowland raised bog inventory dataset.
Dataset was clipped to the boundary of GCR area, and entire dataset was used. All habitat polygons listed as the SNIFFER habitats considered to be core wetland as shown in Table 1 included.
Details of NVC codes alignment with SNIFFER types and subsequent inclusion in either core or non-core wetland are included in Annex 5
All habitats labelled ‘freshwater’ extracted.
Polygons assigned EUNIS habitat codes:
D1.11 – Active, relatively undamaged raised bogs (Peat bog – Good –Included as core habitat).
D1.12# - Degraded raised bogs still capable of natural regeneration (Peat bog – Poor – Included as non-core habitat).
D1.12x – Damaged, inactive bogs not capable of natural regeneration within 30 years (Peat bog – Poor – Included as non-core habitat).
GCVGN SSSI data
Provides a description of the habitat type for polygons within SSSI boundaries.
Wetlands habitats extracted based upon habitat descriptions for site. All wetlands translated as the SNIFFER
18 Scotland's environment (2023) Habitat Map of Scotland https://www.environment.gov.scot/our-environment/habitats-andspecies/habitat-map-of-scotland/
Glasgow City Region: Wetland Opportunity Mapping
Data & Source Description Use
habitats considered to be core wetland as shown in Table 1 included.
UKCEH Land Cover Map 2021 19
Habitats are classified based on UK Biodiversity Action Plan Broad Habitats.
Ordinance Survey Master Map 20
Natural Features; Broad habitat descriptions for Natural Environment features.
Habitats listed as ’Freshwater’, ‘Fen, Marsh and Swamp’, and ‘Bog’. These were translated to SNIFFER typology ‘standing water’, Wet grassland’ and ‘Bog’ respectively. All habitat polygons listed as the SNIFFER habitats considered to be core wetland as shown in Table 1 included.
Used to sense check habitats, and to provide polygons for selection of wetlands based on flora and fauna records.
Extraction of canals, aquaducts, reservoirs, Marsh, Heath, Reeds, Springs, Sinks and Static water to include as core habitat.
Extraction of riparian habitats, which were then categorised as core wetlands or non-core wetlands.
Local Authority
Data Phase 1
Local Authority
Data Wetland Sites
Derived from on the ground Phase 1 surveying for two local authorities (East Dumbartonshire three years and East Renfrewshire one year).
Local Authority
Data SINC data
A mixture of Phase 1 surveys and additional sites added in by LA.
Glasgow city and Renfrewshire provided spatial data on wetlands within SINC sites.
Wetland habitats derived and used as core habitat. List of Phase 1 habitats that and their equivalent SNIFFER type are provided in Annex 5. All habitat polygons listed as the SNIFFER habitats considered to be core wetland as shown in Table 1 included.
Wetland habitats derived and used as core habitat. List of phase 1 habitats that and their equivalent SNIFFER type are provided in Annex 5. All habitat polygons listed as the SNIFFER habitats considered to be core wetland as shown in Table 1 included.
Wetlands habitats extracted based upon habitat descriptions for site. All wetlands translated as the SNIFFER habitats considered to be core wetland as shown in table 1 included.
OS MasterMap Networks –Water Layer10
A network presentation of the general alignment and connectivity of permanent water, including rivers, lakes and canals.
All water links with a gradient of 0 m/ 100 m and not listed as tidal included as core wetland. Watercourses with
19 UK CEH (2021) Land Cover Map https://catalogue.ceh.ac.uk/documents/017313c6-954b-4343-8784-3d61aa6e44da
20 Ordnance Survey: OS MasterMap Sites Layer https://www.ordnancesurvey.co.uk/products/os-mastermap-sites-layer
Data & Source Description
Glasgow City Region: Wetland Opportunity Mapping
Use
gradient of 0.1-0.7 m/100 m and tidal included as non-core wetland.
Used to create a riparian buffer zone which was used to extract OS MasterMap data.
Other spatial datasets used
In addition to the spatial datasets used to identify Wetlands, several other spatial datasets were used during the modelling process. These are summarised in Table 4.
Table 4: Overview of addition spatial datasets used during the modelling process
Data & Source Description
NatureScot GCVGN
Landcover raster 21
Ordinance Survey MasterMap
Raster that combines Space Intelligence’s Scotland Habitat and Land Cover Map 2020 22 (re-sampled to 2 m resolution) and Ordnance Survey data urban, road and water features 23
Manmade/Multiple and Unknown features. Data includes houses, gardens, roads, railways, and hard standing surfaces.
Coniferous woodlands.
National Forest Inventory 24
Covers all forest and woodland area over 0.5 ha with at least 20 % canopy cover, or the potential to achieve it, and a minimum width of 20 m. Includes areas of new planting, clearfell, windblow and restock.
Identification of wetlands: floral indicators
Use
Data used as baseline habitat map for least-cost habitat network modelling. From this comprehensive habitat map and the identified Core and Non-Core wetland habitats a cost raster was derived.
Used to clean up the core and noncore wetland databases by removing wetlands that had been lost due to development. Also used to erase opportunity areas that coincide with roads, buildings etc.
Coniferous woodlands were extracted and used to clip (i.e. remove) any core or non-core wetlands that coincided with this habitat. Additionally, the coniferous woodland layer was used to update the GCVGN landcover raster.
Except for wet woodlands, the NFI was used to remove all other core and noncore wetland habitats that coincided with woodlands. This layer was also used to remove any opportunity areas that coincide with woodland habitat
Plant species that are potential indicators of specific wetland habitats were obtained from the Botanical Society of Britian and Ireland (BSBI) (Annex 3). These plant species were provided for three separate wetland habitats, including ‘Fen marsh and swam’ (218
21 Provided directly from NatureScot
22 Scottish Government (2020) Scotland Habitat and Land Cover Map https://spatialdata.gov.scot/geonetwork/srv/api/records/88cea3bd8679-48d8-8ffb-7d2f1182c175
23 Ordnance Survey: See the work in a new light https://www.ordnancesurvey.co.uk/
24 Forestry Commission (2021) National Forest Inventory Scotland https://dataforestry.opendata.arcgis.com/datasets/930e7d27c8e8424a816e48936a122b8c_0/about
Glasgow City Region: Wetland Opportunity Mapping species), ‘Freshwater’ (186 species), and ‘Heath and bog’ (96 species, reduced to 32 species using the Ellenberg indicator values for soil moisture of eight and above). A total of 363 wetland indicator plant species were identified and for these species, records from the year 2000 onwards were obtained from the BSBI. The accuracy of records varied from 1 m to 1 km. A total of 68,403 records were received.
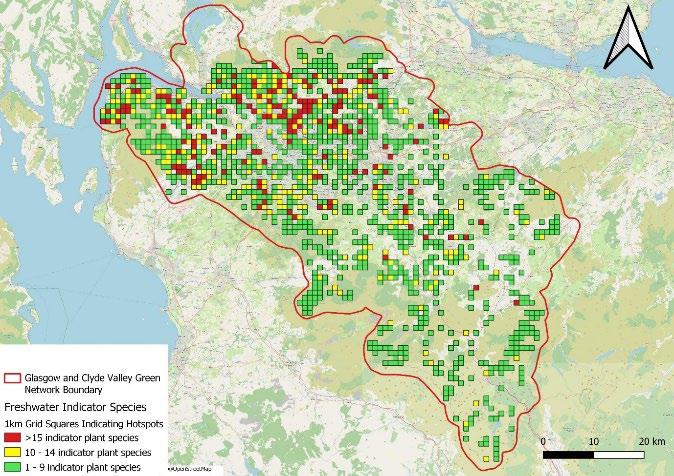
The BSBI provided summary data for each 1 km grid square, specifically the indicator plant species richness (i.e. the total number of indicator plant species for each of the three habitat types recorded within the grid square). Each grid square was then categorically assigned high, medium or low for each of the three wetland habitat types based on their richness of indicator plant species. The top >10 % of grid squares, with respect to indicator plant species richness, were assigned high, 10-25 % were assigned medium, and low was <25 %. The number of indicator plant species and grid squares this equated to for each of the three habitat types is shown in Table 5 This allowed us to produce heatmaps for botanical richness based on the BSBI records for each 1 km grid square. This was done for each of the three habitat types, and grid squares categorised as high were extracted and combined to find wetland botanical hotspot squares (Figure 2).
Table 5: Record requirement for grid square classification
Habitat Type No. of indicator plant species richness in high grid squares
City Region: Wetland Opportunity Mapping
a) Freshwater indicator heatmap


b) Fen and marsh heatmap

c) Wet heath/bog indicator heatmap d) Wetland hotspots
This identified 360 grid squares as wetland plant hotspots, made up of 166 grid squares of freshwater plant hotspots, 152 grid squares as fen marsh and swamp plant hotspots, and 206 squares of wet heath and bog plant hotspots (parts greater than sum due to overlap where one grid square is a hotspot for multiple habitats). Each hotspot square was virtually examined by an ecologist. Here raw plant records with a precision of 100 m or less were overlaid on top of the hotspot grids to assist decision making.
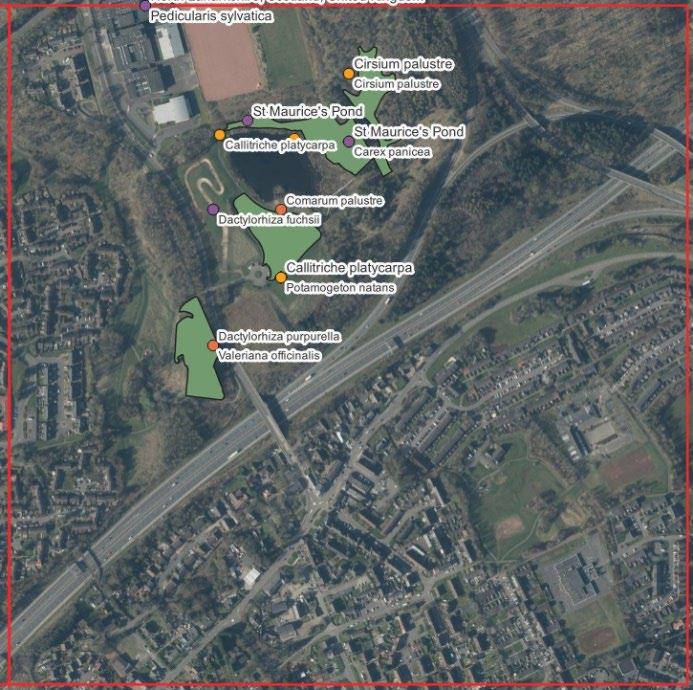
Each hotspot grid square was inspected, to determine if wetland habitats had already been identified via spatial datasets. In squares where no wetlands had been identified, ecologists identified any potential wetland habitats basing their decision on the species present alongside aerial images (Figure 3). For example, records accurately pinpointing relatively ubiquitous species (e.g. Calluna vulgaris – Ling heather) were ignored, whereas more characteristic wetland species such as Caltha palustris (Marsh marigold) and Typha latifoli (Greater bulrush) were included. Habitats patches deemed to have a high likelihood of being Wetlands were manually selected from the OSMM layer and assigned to the most appropriate SNIFFER typology. OSMM provided a relatively robust means of identifying the spatial extent of the wetlands and allowed for quick transfer of data. The resultant layer consisted of 195 polygons based on plant records, However, without ground surveying it was not possible to ensure accuracy.

To support identification of wetland habitats based on flora records, additional biological records for wetland fauna indicators were also obtained. To achieve this, it was agreed that wetland fauna species should be limited to invertebrates and amphibians, due to their greater reliance on wetland habitats, compared to other taxa such as birds, which have a higher likelihood of being observed within non-wetland habitats. As such, invertebrate and amphibian species records were obtained from the sources listed in Table 6
To constrain invertebrate records to just records for invertebrate species that are specifically indicators of wetlands, the records were cross referenced with freshwater indicator species as listed on freshwaterecology.info 25. Cross referencing found 563 species of freshwater indicator invertebrates within the NBN records and 328 species within the Glasgow Museum records. To ensure temporal and spatial accuracy of records, the resultant records were then restricted to only include recent (i.e. post 2000) and accurate (i.e. six figure grid reference or higher) records.
In total, 18,651 records were extracted to aid in the identification of wetland habitats. Due to the high number of records obtained, it was not possible to view every record. Instead, the cluster function was used in QGIS, where points that occurred within 100 m of each other were clustered together. This allowed us to identify hotspots. Clusters of >10 points were visually inspected by an ecologist and the underlying OS MasterMap habitat, aerial photography and raw biological records were evaluated. Locations with a high likelihood of being wetland habitats were extracted via OS MasterMap polygons (Figure 4).
25 Freshwater Information Platform https://www.freshwaterecology.info/fwe_search.php?og=mzb
Glasgow City Region: Wetland Opportunity Mapping
Table 6: Wetland fauna biological records sources

Figure 4: Polygon selection using biological records. Red circles with number indicate clusters of biological records with number indicating number of records within 100 m. Smaller red dots show individual raw records. Orange polygon shows OSMM polygon selected as wetland habitat.

Alongside biological records for wetland flora and fauna, two research papers, which surveyed standing freshwaters (primarily ponds) in the region were reviewed (Table 6). These research papers contained accurate grid references, which were virtually visited. As above aerial imagery and OS MasterMap data were used to extract relevant standing freshwaters, which previous processes had failed to identify.
Table 7: Research paper including information on surveys conducted and the number of location records explored
Research paper
Downie, E., Happe, M., Downie, J.R., 2024. Greater Glasgow pond amphibian surveys 2022. Glasgow Naturalist, 28, 79-88.
Foster, G., (2012), Urban Biodiversity: Success and Challenges: Glasgow’s water beetles. The Glasgow Naturalist, Vol 24(4).
Location of ponds surveyed for frog spawn 162
Location of standing water where water beetles were surveyed. 37
Following the extraction of wetland habitats through the processes identified above, sense checking workshops were held. The GCVGN held eight workshops that engaged the local authorities in the area. To further support these workshops, attendees also include local ecologists and recorders. These workshops aimed to:
• Identify the accuracy of the data extraction process.
• Identify known wetland sites not captured by the data extraction process.
• Identify sites that were incorrectly identified as wetlands.
• Identify wetland sites lost due to development or land use change.
Data processing and the sense checking workshops found a high degree of accuracy in the resultant wetland dataset. These workshops did, however, identify wetlands that were inaccurately assigned (including wetlands that had been lost to development or forestation – see below) alongside wetlands that the extraction process had failed to identify. Adjustments were made to the final spatial dataset to take into account feedback from these workshops.
Wetlands identified from spatial datasets, biological records and on the ground knowledge were combined in QGIS Version 3.28.3-Firenze. Prior to combining data, a column was created in each attribute table relating to the data source, alongside original wetland classification and SNIFFER typology (where appropriate). This ensured that we could trace back the source of individual polygons. As a variety of datasets were used to build up these wetland polygons, there was overlap between polygons.
Extracted wetlands consisted of polygons that could be considered core wetland habitats, alongside non-core wetland habitats that are unlikely to function as core wetland habitat (i.e. saltmarsh, degraded bog and fast flowing watercourses). However, it was recognised that non-core wetland habitats were likely to still increase the penetrability of the surrounding landscape impacting the ability of wetland species to move through the landscape. The first step of data cleaning thus extracted these noncore wetlands into a separate layer.
The network modelling took a generic wetland species approach and consequently all core wetland habitats were simply treated as wetlands. Wetland polygons derived from different data sources often overlapped (i.e. areas where different spatial datasets had identified the same land parcel as wetlands) and on occasions these habitats had slightly different SNIFFER typologies. As our modelling approach treated all core wetlands the same, there was no need to independently cost core wetlands with different SNIFFER typologies. Thus, core wetland polygons were merged into a single dataset and overlapping polygons dissolved thus connecting intersecting polygons. This was achieved in ArcGIS Pro Version 3.3.1 using the Merge and Dissolve tools.
Data processing and the sense checking workshops identified that some wetland habitats had been lost to development (e.g. building of houses, roads and industrial estates). Consequently, to remove these wetlands a layer was created from OS MasterMap by selecting and extracting attributes where Make equalled Manmade, Multiple and Unknown features (hence-force termed MasterMap manmade features). This layer was used to erase all wetlands that coincided with buildings, roads, car parks and gardens, using the Erase tool in Arc Pro.
Additionally, it was also noted that some wetlands had been lost to woodland creation. To remove these wetlands, it was necessary to first remove wet woodlands from the core and non-core wetland layers. We then used the National Forest Inventory (NFI) to Erase any remaining wetlands in both the core and non-core wetlands that coincided with woodland. As the NFI also contained non-woodland habitats, these were removed from the NFI prior to performing the Erase (Category = Non-woodland). Following this operation, the wet woodlands were added back into the core and non-core wetland layers.
Identifying source wetland patches
Previous wetland network modelling assumed that the minimum patch size for wetlands to function as a source habitat (i.e. a habitat able to support viable populations of wetland species) was 0.02 ha 26 27. This was agreed with the steering group to be an appropriate lower limit.
To calculate the area of individual wetland patches, the Explode tool (single-part-tomulti) in Arc Pro was used to first separate each individual wetland patches. Calculate Geometry Attributes was then used to calculate the area of each polygon in hectares. It was noted that due to both the raw datasets, and data processing (e.g. removal of wetlands in manmade features), a number of wetlands existed as small fragments of polygons (i.e. slithers) and these were deleted.
Following data manipulation, 12,335 core wetland polygons were identified. These were then classified as either Source wetlands (i.e. wetlands ≥ 0.02 ha – total 6,931 polygons) or Non-source wetlands (i.e. wetlands < 0.02 ha – total 5,404 polygons). Source wetlands were given a Cost Value of zero, while Non-source wetlands were costed as one (indicating that a species could move freely within the habitat, however, that it would not be considered as a source habitat during modelling).
Raster creation
Two vector layers were produced from the final wetland dataset.
• Core wetlands consisting of Source wetlands (i.e. wetlands ≥ 0.02 ha) and Nonsource wetlands (i.e. wetlands < 0.02 ha).
26 Blake, D. & Baarda, P. 2018. Developing a habitat connectivity indicator for Scotland. NatureScot Research Report No. 887. https://www.nature.scot/doc/naturescot-research-report-887-developing-habitat-connectivityindicator-scotland
27 Watts, K., Handley, P., Eycott, A.E., Peace, A., Marzano, M., Scholefield, P. and Norton, L. 2010. Habitat Connectivity – Developing an indicator for UK and country level reporting. Phase 2: Production of the indicator - Defra contract WC0716. Forest Research & Centre for Ecology and Hydrology.
Glasgow City Region: Wetland Opportunity Mapping
• Non-core wetlands (i.e. wetlands deemed to enhance landscape permeability but not act as functioning core wetlands).
Within both vector layers, a habitat column was created, and each wetland type was categorised into specific habitat categories to align with the cost table for wetland species (Annex 5). We converted each vector layer to a raster using the Arc Pro tool Feature to Raster, processing the vector layers one at a time. The burn in field was selected as the newly made column containing the layers Cost Value. The field value to burn was then selected as this number. The vector layers were rasterised at 2 m georeferenced units (i.e. giving a 2 m resolution). Each rasterisation was done at a lossless compression and snap raster was set to the 2 m NatureScot GCVGN Landcover raster to ensure all pixels aligned across each raster.
The final raster was built by merging the wetland rasters with NatureScot’s Land Cover Raster 28 (resampled from a 10 m resolution down to 2 m resolution) using the Mosaic to New Raster tool. This provided our base map and ensured consistency with previous network modelling analyses undertaken. NatureScot’s GCVGN Land Cover Raster was created by combining:
• Space Intelligence’s Scotland Habitat and Land Cover Map 202022
• OS MasterMap Rivers, Roads, Railways15
Sense checking initial networks indicated high connectivity through some coniferous plantations. Exploring this further, it was found that NatureScot’s GCVGN Land Cover Raster did not always categorise coniferous woodlands correctly, instead assigning them as mixed or deciduous woodlands. With large differences in the costs of moving through coniferous and mixed/deciduous woodlands this will impact on habitat connectivity. Prior to the creation of the final basemap, NatureScot’s GCVGN Land Cover Raster was therefore updated to include coniferous woodland as extracted from OS MasterMap.
Cell size was set to 2 m and extent was set to NatureScot’s GCVGN Land Cover Raster. Mosaic operator was set to Last with the input raster order set to GCVGN Land Cover Raster, Coniferous woodlands, Non-core wetlands and finally Core wetlands. Once completed, this produced a raster layer with preassigned raster values for land covers set by NatureScot’s base raster, and Non-core Wetland habitats were merged on top, with Core Wetland habitats merged above that, replacing whatever previous value had previously been assigned to that area. This was our final Habitat Raster.
Habitat network modelling
Overview
Habitat network modelling followed NatureScot’s Integrated Habitat Network Methodology Handbook 29 which was adapted from the BEETLE least-cost habitat network approach developed by Forest Research 30. The least-cost modelling approach recognises that habitats that are not physically joined (i.e. structurally connected), may
28 Provided directly from NatureScot
29 Blake, D. & Mattisson, A. 2012. Integrated Habitat Network Methodology Handbook.
30 Watts, K.; Griffiths, M.; Quine, C.P.; Ray, D., Humphrey, J.W. 2005. Towards a woodland habitat network for Wales. Contract Science Report No. 686, Countryside Council for Wales, Bangor, Wales.
Glasgow City Region: Wetland Opportunity Mapping
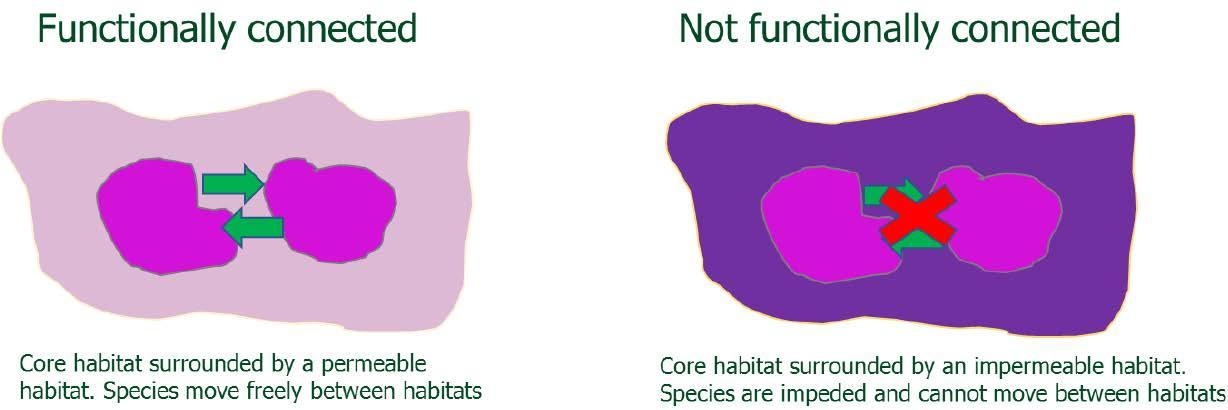
be functionally connected if the intervening land use allows the focal species to move between source habitats (Figure 5). Functional connectivity depends on the permeability of the intervening landscape.
The least-cost habitat network approach takes into account the fact habitats vary in their permeability by assigning all habitats a cost associated with a species moving through them. This cost encompasses both a physical cost of movement and associated risk. For example, the cost of a wetland species moving through a deciduous woodland (which tend to provide relatively shaded, damp environments with a low level of human disturbance) would be lower than the cost associated with moving through an arable field (which tend to provide open, drier habitats that have a high level of human disturbance).
We adopted a generic focal species approach where the cost of dispersing through different habitats is represented by perceived dispersal costs for a conceptual wetland species (i.e. an average wetland species). Adopting this approach ensures resultant outputs are consistent with existing habitat networks created for the Central Scotland Green Network. The generic focal species approach targets a wide suite of wetland species, in comparison to approaches that target single species (e.g. great crested newt). The resultant networks ensure conservation efforts are directed to a wider suite of wetland species rather than simply one species 31. The generic focal species is a pragmatic approach avoiding the need to gather extensive ecological data from a wide range of different species and then interpreting multiple species networks (which can give conflicting information).
All habitats are assigned a cost associated with the generic focal species moving through the habitat (the cost for source habitats is zero). For example, a cost of one is assigned to habitats that species can freely move through (e.g. core wetlands < 0.02 ha), a cost of two indicates that the species can only travel half of its dispersal distance, and a cost of four indicates that it can travel a quarter of its dispersal distance (and so on).
Habitat costs drew from those previously identified by NatureScot via expert elicitation. The appropriateness of these costs was sense checked by wetland ecologists on the
31
Glasgow City Region: Wetland Opportunity Mapping
steering group (Professor Rob Briers of Edinburgh Napier University and Buglife’s Conservation Director Craig Macadam). For all habitats that were not previously considered in NatureScot’s evaluation (e.g. aqueducts, riparian scrub) costs were agreed with our steering group experts (Annex 5).
Least-cost habitat network modelling
Least-cost modelling was used to create habitat networks for three dispersal distances agreed with the steering group (125 m, 500 m and 1000 m). Modelling different dispersal powers allows us to explore connectivity for generic focal species with low (125 m for example gastropods) to high (1000 m for example caddisflies) dispersal abilities. Leastcost modelling considers the cost of moving through the intervening habitats between two patches of source habitat to determine the easiest route (i.e. least-cost). Due to small sizes of some wetland patches, and the validity of using edge effects, modelling was conducted without edge effects. An overview of the steps and resultant outputs are provided
Habitat Network Modelling was undertaken in ArcGIS Pro using SRUC’s Habitat Networking Tool (Figure 6). The Processing Extent was set to the Habitat Raster and Raster cell size was set to 2 m.

Glasgow City Region: Wetland Opportunity Mapping
SRUC’s tool requires two input files:
• A Habitat raster (see Raster creation above) providing a comprehensive habitat map for the GCR area including Source wetlands (≥ 0.02 ha), Non-source wetlands (< 0.02 ha), Non-core wetland habitats and a range of other habitat types.
• A Cost table in csv format (see Habitat costs for generic focal species above) which estimated cost for a generic wetland species to move through each habitat in the Habitat raster (Annex 5).
Firstly, Reclass by Table tool was used to reclassify the habitats in the landcover raster using the costs provided in the cost table (Annex 5). This provides a cost raster where each habitat is assigned a cost value based on the generic wetland species moving from source habitat (i.e. core wetland ≥ 0.02 ha) into the adjacent landscape. From this cost raster, the Reclassify tool is used to create a source habitat raster. This is achieved by reclassifying habitats where the cost is equal to zero (i.e. Source wetlands) and setting all other habitats to ‘NoData’.
The final step of the Network Modelling process takes the cost raster (input cost raster) and the source habitat raster (input raster or feature source data) and uses the Distance Accumulation tool to model distance to the nearest source habitat for each cell in the raster based on the least-accumulative cost over the habitat cost layer. This effectively results in dispersal zones from the source habitat into the surrounding landscape matrix based on the permeability of habitats within the landscape. As such a source wetland habitat dispersal network is produced. An overview of the modelling process, and outputs are provided in Figure 7 and full model outputs are presented in Annex 1.
This final stage was run using multiple parameters for maximum dispersal distances to account for species with different dispersal capabilities. As outlined above, we focussed on a quarter dispersal distance of 125 m to reflect the distance travelled by less mobile species and a maximum dispersal distance of 500 m to reflect the distance travelled by more mobile species. Additionally, a dispersal distance of 1000 m was used to model two times the maximum dispersal distance. While not included in the network model outputs, this will be utilised when identifying secondary opportunity areas in the next section.
Glasgow City Region: Wetland Opportunity Mapping

Glasgow City Region: Wetland Opportunity Mapping
The final stage of our modelling process was to undertake opportunity mapping to spatially identify opportunity areas (i.e. areas where habitat creation would significantly impact enhancing the connectivity of wetland habitats). Opportunity mapping provides a valuable tool to help decision makers target habitat creation on the ground. To provide continuity with previous network analyses, we followed the methodology developed by Forest Research as part of their work for the GCVGN. This methodology identifies opportunity areas using two separate methods, a focal statistics method, and a spatial analysis method.
Through visually examining networks for the differing dispersal powers (125 m, 500 m and 1000 m) and liaising with the steering group it was decided to focus opportunity mapping on the 500 m dispersal network. This provided a good middle ground, with the 1000 m networks already having high ecological connectivity and the 125 m networks being extremely fragmented.
Opportunity areas are split into primary and secondary opportunity areas based on their significance (Figure 8). Primary opportunity created bridges between habitat patches for species with a minimum dispersal distance of 125 m (i.e. opportunity areas for habitat creation features which would connect two or more separate quarter distance network regions) Secondary opportunity areas created bridges between habitat patches for species with a minimum dispersal distance of 500 m (i.e. opportunity areas for habitat creation features within the double dispersal distance network regions that if created would bridge two or more maximum dispersal distance network regions)

The Reclassify tool was used to reclassify the 1000 m Cost-distance raster created during network modelling into the three network rasters required for opportunity mapping (125 m, 500 m and 1000 m). As indicated above these provided quarter distance networks, maximum distance networks and double distance networks. For each raster, created cells up to their respective distance were reclassified to a value of one to give quarter, maximum and double dispersal distance networks respectively. All remaining values were classified at ‘NoData’.
Once reclassified, the Region group tool was used to combine continuous regions of the network cells and assign them unique ID values. The Number of neighbours was set to EIGHT, with all other settings set as default. The results were polygonised and the resulting layer dissolved by their GRIDCODE field using the Dissolve tool.
The below method outlines the process for identifying primary opportunity areas and therefore refers to the use of the quarter distance network and maximum distance network. The primary opportunity areas were based on the smaller dispersal distance (125 m) to offer the greatest connectivity between Source wetlands.
Focal statistics method
The focal statistics approach utilises a raster-based analysis to calculate the number of cells within a set distance from the focal cells (Source wetlands). Using the Focal Statistics tool the quarter distance network raster was set as the input raster, with neighbourhood set to a distance of 125 x 125 cells (i.e. 125x125 2 m cells equating to quarter the 500 m dispersal distance) and the statistics type set to variety. This created a raster where any areas within 250 m distance of two or more source wetlands is given a value of >1. The Reclassify tool was used to reclassify the output, converting all cells with a value > 1 to a value of 1 and all other cells to ‘NoData’. The resulting raster was converted to a polygon – disabling simplify polygons.
To identify potential bridges that require a larger buffer, the Select by Location tool was used to select all polygons that are greater than 50 m from the quarter-distance network patches. These polygons were buffered by 200 m using the Buffer tool.
To identify potential bridges that require a smaller buffer, the Select by Location tool was used to select all polygons that lie within 50 m of quarter-distance network patches. The polygons were then buffered by 20 m using the Buffer tool. Using a smaller buffer prevents adjacent bridges from merging, which would increase the amount of manual editing required at the final step.
These two buffered layers were then merged into a single layer and the Dissolve tool was used to merge any overlapping polygons. The Create multipart features parameter was left unchecked to ensure individual features will be created for each part.
The Erase tool was used to create a maximum distance network layer that only contained locations outside of the quarter distance network, i.e. creating a doughnut
Glasgow City Region: Wetland Opportunity Mapping
layer (i.e. erasing the quarter distance network from the maximum distance network). To remove opportunity areas that coincided with quarter distance networks, or fall outside the maximum distance networks, the Clip tool was used to clip the doughnut maximum distance layer from the dissolved focal opportunity areas.
Holes in bridges were then removed by buffering the resultant clipped layer by less than half the raster resolution. We used 0.5 m as the raster resolution is 2 m. The Dissolve tool was again used to dissolve the resulting layer again ensuring that the Create multipart features parameter was left unchecked. The Spatial Join tool was then used to join the resulting layer with the quarter distance network polygon layer using a search window of 10 m.
It is recognised that some opportunity areas may not be suitable for habitat creation (e.g. buildings, roads, and woodlands). The MasterMap manmade/general and unknown features layer (i.e. representing manmade features such as buildings, gardens, roads and carparks) was used to Erase opportunity areas that overlapped with manmade features using the Erase tool. The National Forest Inventory was edited to remove any nonwoodland features (i.e. selecting only entries with Category = Woodland) and used to Erase opportunity areas that coincided with woodlands. It should be noted that some areas of coniferous woodlands are included which may be suitable for wetland creation.
Finally, the Buffer tool was used to buffer the resultant layer by 0.5 m and the Dissolve tool to merge any overlapping polygons (ensuring Create multipart features was disabled). Preform one last spatial join between the latest dataset and the quarter distance network layer with a 4 m search window. To make sure that all opportunities areas connected to more than one quarter distance network region (i.e. provide true connections between two distinct networks) all polygons with a join count >1 were selected and exported as a new shape file.
The spatial statistics approach is used as a supplementary approach to identify additional bridges that may not have been identified using the focal statistics method.
The Buffer tool is used to create a 70 m buffer around the quarter distance network. This was found to be a middle ground between not connecting habitats and connecting too many separate network regions. Taking the maximum-distance network (i.e. 500 m network) as the input layer, the Erase tool was used to erase any regions of this network that coincided with the 70 m buffer.
In some instances, small holes in polygons could result in a single opportunity area being treated as more than one feature. To prevent this happening, the output file was buffered by a value less than half the raster cell size. In this case 0.5 m was used. Any overlapping polygons in the output layer were then dissolved into single features using the Dissolve tool. As before, the Create multipart features parameter was left unchecked.
The Spatial join tool was used to join the new layer with the quarter distance network vector layer using a search distance of 80 m (i.e. a distance larger than the 70 m buffer
Glasgow City Region: Wetland Opportunity Mapping
distance used above). All rows within this new layer with a join count of >1 and an area > 0.01 ha were selected and exported to a new layer (i.e. identifying potential opportunity areas which bridge two quarter distance networks). Buffer this new layer by 80 m.
To remove opportunity areas that coincided with quarter distance networks the Clip tool was used to clip the doughnut layer created in the focal statistic approach from the potential opportunity areas identified by the spatial statistics approach.
To remove opportunity areas already identified by the focal statistics approach, the Buffer tool was used to buffer the final focal statistics opportunity areas by 100 m. The Erase tool was then used to remove opportunity areas identified by the spatial statistics approach that intersect with the buffered focal statistics opportunity areas.
As with the Focal Statistics approach, the Erase tool was used to remove any opportunity areas that intersect with MasterMap man-made features and woodlands (see above). Buffer the resultant layer by 0.5 m and merge any overlapping polygons using the Dissolve tool (again ensure the Create multipart features parameter is left unchecked).
One last spatial join was performed between the latest dataset and the quarter distance network layer applying no search distance. To make sure that all opportunity areas are connect to at least two quarter distance network regions (i.e. provide true connections between distinct networks), rows that have a join count of >1 were selected providing opportunity areas identified through the Spatial Statistics approach. These were exported as a new layer.
Secondary opportunity areas consist of habitat creation features that if created would bridge, two or more maximum dispersal distance network regions (i.e. 500 m). To generate the secondary opportunity areas the process above is repeated by replacing the quarter distance network with the maximum dispersal distance network (i.e. 500 m) and the maximum dispersal distance network with the double dispersal distance network (i.e. 1000 m).
One of the final stages of opportunity mapping involved manually editing polygons (i.e. using the Split tool and the Edit Vertices tool) to remove inaccuracies and redundant opportunity areas. This requires a visual assessment of each opportunity area to identify if it made a true connection between quarter distance networks, and to remove excess opportunity areas created during the modelling which do not contribute to connectivity.
To reconnect opportunity areas that were split up by the removal of roads, buildings and woodlands the cleaned opportunity areas were buffered by 5 m using the Buffer tool. The resulting layer was then dissolved to merge any overlapping polygons. A Spatial Join was then used to join the dissolved output above to the cleaned opportunity area, allocating a group ID to all opportunity areas based on the which dissolved 5 m buffer polygon they fall within. A final Dissolve was based on their group ID, leaving create
Glasgow City Region: Wetland Opportunity Mapping
multipart feature selected this time. This creates a layer where all opportunity areas within 10 m of each other are aggregated into one feature. Following this a final Spatial Join was completed to ensure that all opportunity areas are connected to two or more quarter distance networks, extracting all features with a join count > 1.
Wetland creation depends strongly on topography and underlying hydrology of a site, and consequently the identified opportunity areas may not necessarily be appropriate for habitat creation. Existing wetlands can help pinpoint suitable locations for wetland expansion or restoration. Following cleaning of the opportunity areas, a final workflow identified Non-core and Non-source (i.e. < 0.02 ha) wetlands that fell within the modelled primary and secondary opportunity areas. To identify these Priority opportunity areas the Select By Location tool was used to select all Non-core wetlands and Non-source wetlands that intersect the primary and secondary opportunity areas respectively. Once selected the Clip tool was used to clip the selected layers to the primary and secondary opportunity areas, thus leaving just the areas of wetland that is within the opportunity areas themselves.
The importance of wetland habitats is becoming increasingly recognised for both their conservation value and the wider ecosystem services they provide (e.g. provisioning of freshwater, regulating water flows and storing carbon)2. Working with the GCVGN and partners we created a framework to identify wetlands remotely through a combination of local knowledge, biological records (flora and fauna) and open-source spatial datasets. This work builds upon the Scottish Wetland Inventory (SWI) to develop a comprehensive database of wetland habitats in the GCR project area.
The methodology used is adaptable to other regions in Scotland and will be particularly effective in areas where high quality spatial data is available (i.e. NVC, or EUNIS level 4). The methodology combines techniques that are highly reproducible (i.e. identification of habitat polygons through spatial datasets) with more time-consuming manual aspects which rely on expert interpretation to the available data (i.e. the identification of habitat polygons through aerial interpretation and biological records).
The maintenance of water levels key to the functioning of wetland ecosystems, and this makes them highly vulnerable to climate change. They are at risk from changes in rainfall and temperature (e.g. periods of drought and extreme heat), with coastal wetlands also impacted by storm surges 32. In addition to increasing the quality and size of wetland habitats, creating wetland nature networks provides a crucial tool to help build resilience into these vital ecosystems. In focussing on all wetland types, we created habitat networks for a generic focal wetland species. This allowed us to identify opportunity areas where the creation of new wetlands or the expansion of existing wetlands would enhance wetland connectivity.
In comparison to species-rich grasslands, which are poorly captured in spatial datasets 33, wetlands are relatively well captured by the Scottish Wetland Inventory (SWI). The SWI was developed by assimilating spatial data from NatureScot (previously Scottish Natural Heritage), however, it is noted that these datasets do not provide comprehensive coverage of the GCR area. Additionally, the SWI focusses on the SNIFFER wetland typologies, and therefore does not include standing or running freshwater habitats nor riparian areas. To fill in the gaps we integrated information from additional spatial datasets, biological records and local knowledge. Recognising that some wetland types provide little value when in a degraded state (i.e. blanket bogs, raised bogs, wet grasslands and wet woodlands), we used designated sites to refine these wetlands, only including them when they coincided with designated sites.
Through a combination of biological records and open-source spatial datasets we identified a total of 12,335 habitat patches with a high likelihood of being core wetland habitat.
32 Perez Llorens, JL (2008) Impacts of Climate Change on Wetland Ecosystems, Climate change and wetlands https://zaragoza.es/contenidos/medioambiente/cajaAzul/10S3-P2-Perez%20LloresnACC.pdf
33 SAC Consulting (2023) Glasgow City Region: Species Rich Grassland Opportunity Mapping for Glasgow and Clyde Valley Green Network https://issuu.com/gcvgreennetworkpartnership/docs/gcvgn_clyde_grasslands_finalreport_nov23
Wetlands in the Glasgow City Region area
The GCR project area supported a wide variety of different wetland types, with several of these habitats on the Scottish Biodiversity List 34. These included: lowland raised bogs, upland flushes, fens and swamps, lowland fens, reedbeds, ponds, rivers, wet woodlands, Juncus squarrosus-Festuca ovina grassland and blanket bogs.
Wetlands within the GCR area support a diversity of specialist species providing further evidence of their high conservation value. Biological records found several wetland specialists on the Scottish Biodiversity List with plants including marsh saxifrage (Saxifraga hirculus) and hairlike pond weed (Potamogeton trichoides), invertebrates including the pond mud snail (Omphiscola glabra) and European freshwater crayfish (Austropotamobius pallipes), mammals including the water vole (Arvicola amphibius), birds including the curlew (Numenius Arquata) and kingfisher (Alcedo atthis) and amphibians such as the great crested newt (Triturus cristatus) and common toad (Bufo bufo).
Some habitats showed spatial clustering for example raised bogs (e.g. Carnwath Moss, Carstairs Kames, Braehead Moss) with the occurrence of other habitats depending on altitude and topography (e.g. blanket bog were restricted to upland areas whereas slow flowing rivers mainly occurred in lowland areas). Wetland habitats in the area often occurred as a mosaic of different wetland types (e.g. blanket bog, wet health, and standing water), and in providing a range of different resources such mosaics are likely to be particularly rich for biodiversity.
During data extraction, wetlands lost to both development and to forestry were observed, and this was confirmed at the local authority workshops. Coniferous woodland is a high-cost habitat for wetland specialists and consequently commercial forestry not only poses a threat with respect to habitat loss, but they additionally reduce the permeability of the surrounding landscape, further fragmenting wetland habitats. In creating a comprehensive map of wetlands, this project will help ensure that they are considered more fully in decision-making. Furthermore, with both mixed and deciduous woodlands providing more penetrable habitats, replacing coniferous woodlands with mixed and deciduous woodlands could enhance wetland connectivity whilst delivering additional benefits to biodiversity.
While development provides a threat to wetland habitats, it also provides an opportunity to restore, expand and create wetlands. SuDS, including flood retention ponds, which are primarily targeted reduce flood risks can also deliver for biodiversity. SuDS are becoming increasingly prevalent in urban areas and careful consideration of their size, design and management could further enhance their value to biodiversity. This would help developers deliver positive effects for biodiversity meeting requirements outlined in the NPF4 35. This study demonstrates how small wetland habitats can help
34 NatureScot Scottish Biodiversity List https://www.nature.scot/scotlands-biodiversity/scottish-biodiversity-strategy-andcop15/scottish-biodiversity-list
35 Scottish Government (2024) National Planning Framework 4: Part 2 https://www.gov.scot/publications/national-planning-framework4/pages/3/
Glasgow City Region: Wetland Opportunity Mapping
restore ecological connectivity highlighting the potential of SuDS to strengthen nature networks across the area.
Across the GCR project area 44 % of core wetlands were less than 0.02 ha in size. Larger wetlands tended to occur in upland areas, where the pressure of urbanisation and agricultural intensification is lessened. Wetland habitat patches were typically smaller and more fragmented in lowland areas. Smaller wetlands are at greater risk of drying out during periods of drought. The high prevalence of small patches of wetland habitat demonstrates a clear need to expand and create new wetlands to restore connectivity particularly in lowland areas. With urban environments having a prevalence of buildings and roads (habitats that are high cost), small wetland habitats in such areas are particularly vulnerable. To build resilient nature networks, focus should be on both wetland expansion and creation. Through identifying opportunity areas, this project will help spatially prioritise action on the ground.
Limitations to detecting wetlands
The likelihood of identifying wetland patches is influenced by a range of factors including the geographical extent of existing spatial datasets, the accessibility and frequency that habitats are visited (influencing biological recording), ease of identifying habitats via aerial footage, and site designations with designated sites having more comprehensive data
The availability of spatial data varied between local authority areas, with East Renfrewshire having the most comprehensive coverage and North and South Lanarkshire the least. The extent of spatial coverage was reflected in the incident that wetlands were detected with the lowest incidence in North and South Lanarkshire (Table 8). More fragmented networks in some local authorities therefore could simply be due to a lack of data (both spatial data and biological records) rather than a lack of suitable habitat.
The density of fauna and flora records also differed between local authorities with densities higher in Glasgow City than South Lanarkshire (Figure 9). The number of biological records will be dependent on a variety of things in addition to habitat suitability including the area of a specific habitat and where it is located. Locations that are densely populated (e.g. towns and cities), more heavily visited (e.g. popular walks), or with greater accessibility (i.e. proximity to footpaths/car parks) tend to have a greater incidence of biological records than more remote, inaccessible areas. Consequently, small patches of wetlands are less likely to be detected in remote locations via biological records. This is particularly interesting given that such locations are likely to be less impacted by human activities, thus have a greater chance of supporting remaining fragments of wetlands.
City Region: Wetland Opportunity Mapping


With the exception of marshy grassland, wet woodlands and bogs, habitat quality was not considered when identifying core wetlands. Quality will impact on the ability of wetlands to act as core habitats, and consequently it is likely that our network models may overestimate habitat connectivity. To build resilient wetland ecosystems, and indeed wetland networks, it is crucial to also consider actions to improve the quality of existing wetland habitats in addition to wetland creation and expansion.
Table 8: Number of wetland patches per local authority area
Spatial data and the biological records that underpin our analyses were at times outdated. As a result, newly created wetlands may not be captured and identified wetlands may have been lost. To try and account for this sense checking workshops were held and our final wetland datasets were cleaned removing roads and buildings (to account for habitat loss due to development) and woodlands (to account for habitat loss due to forestation). However, this process will not be perfect, for example it will fail to capture wetlands lost to other land use change (e.g. drainage of agricultural fields).
Assumptions and limitations of the modelling process
The scope of this project was to model wetland networks and consequently the resultant networks are based on the inclusion of a wide range of wetland habitats as core (e.g. fen, marshy grassland, blanket bogs, ponds etc.). It is, however, recognised that some wetland species are restricted to specific habitats and the proposed networks will not be applicable these specialist species. For example, the bog sun-jumper spider is restricted to raised bogs. Additional network modelling could identify networks for specific habitats (e.g. raised bogs) with new habitat costs derived for a generic focal species for the habitat in question.
Our modelling selected 0.02 ha as the minimum habitat size for wetlands to be considered source habitats. This area is quite small, and for some habitats (e.g. wet woodland) this area is unlikely to be sufficient. Selecting a minimum source habitat size of 0.02 ha could result in an over-estimation of wetland connectivity. A larger minimum area for source habitat, on the other hand, could undervalue the importance of small habitat patches in supporting metapopulations and providing steppingstones.
Our network modelling used a generic focal species approach. This approach aims to model dispersal in an average wetland species with the assumptions that the final outputs will be applicable to a wide range of species. This applicability can be further enhanced through modelling different dispersal powers, with the resulting networks reflecting generic focal species with both high, medium and low dispersal abilities. The downside of this approach is that the resultant networks don’t reflect a true species and are therefore somewhat theoretical.
Modelling single species networks (e.g. great crested newts) can draw from existing ecological data, which is not possible when using a generic focal species. Costs associated with moving through specific habitats (i.e. permeability) are instead assigned using expert opinion. As such, these costs are subjective 36 and expert opinion can vary widely 37. To align expert opinion, this project drew from previous costings derived via a Delphi process. This process allows experts to first determine habitat costs independently, they are then presented with scores of other experts and given the opportunity to reflect and re-score where they see fit. For habitats not previous costed, a Delphi approach was feasible due to the limited timeframe. Costs for new habitats were agreed with wetland ecologists in the steering group, and following discussion ecologists quickly reached agreement.
Opportunity mapping helped to identify areas where wetland creation would enhance ecological connectivity. The feasibility of creating wetlands is, however, highly, dependant on topography and underlying hydrology; factors not considered in our initial opportunity mapping. To further prioritise actions on the ground, we identified opportunity areas that coincided with non-core/non-source wetlands. In already supporting wetland habitats, restorative actions are likely to have greater success.
36 Humphrey, J., Ray, D., Brown, T., Stone, D., Watts, K. and Anderson, R., 2009. Using focal species modelling to evaluate the impact of land use change on forest and other habitat networks in western oceanic landscapes. Forestry, 82(2), pp.119-134. https://academic.oup.com/forestry/article-abstract/82/2/119/544392?redirectedFrom=fulltext
37 Briers, R., Baarda, P., Heritage, S.N., Bailley, S., Smithers, R. and Wilson, J., 2018. Habitat networks–reviewing the evidence base. Unpublished contract report to NatureScot https://www.nature.scot/doc/habitat-networks-reviewing-evidence-base-final-report
Glasgow City Region: Wetland Opportunity Mapping
This exercise focused on identifying opportunity areas for wetland creation or expansion. As we do not integrate information on opportunity areas for other habitat networks (e.g. species-rich grasslands), wetland opportunity areas may also enhance connectivity for other semi-natural habitats. Wetland opportunity areas should consequently be considered alongside opportunity mapping for other habitats (e.g. woodlands, species-rich grasslands). The most appropriate actions will be dependent on the conservation objectives of an area and should strongly draw on local knowledge36


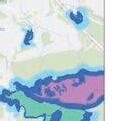


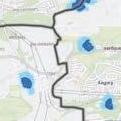


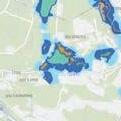


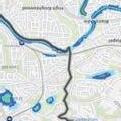


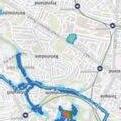


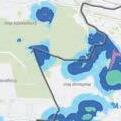









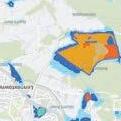


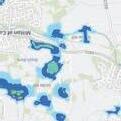


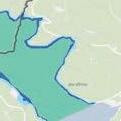


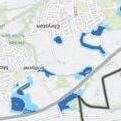


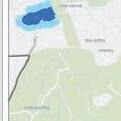
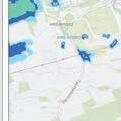


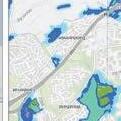






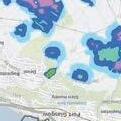






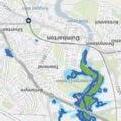


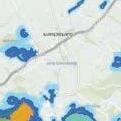


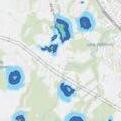


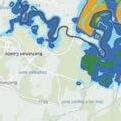


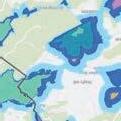



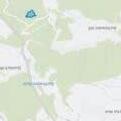
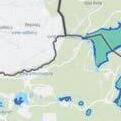


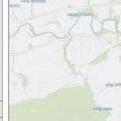




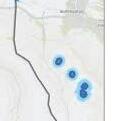


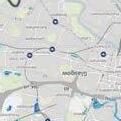

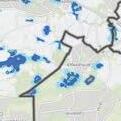


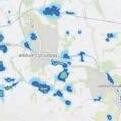


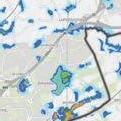


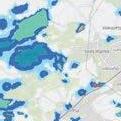


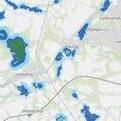


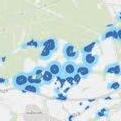




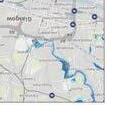







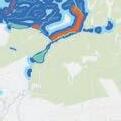


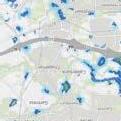


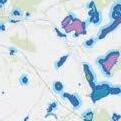


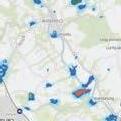


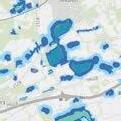


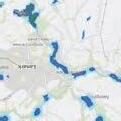


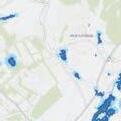

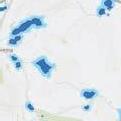


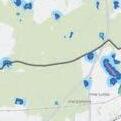


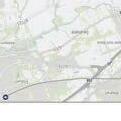


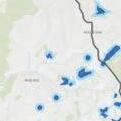






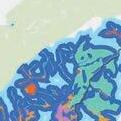


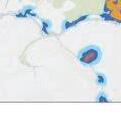





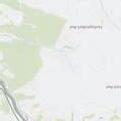


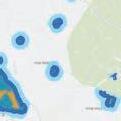


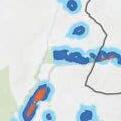


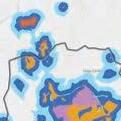


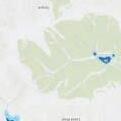
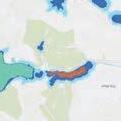


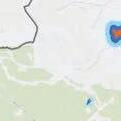







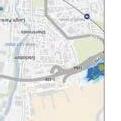


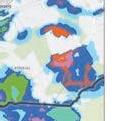


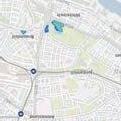

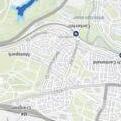


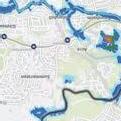


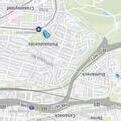


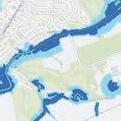


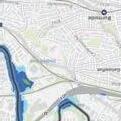

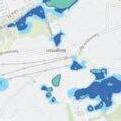


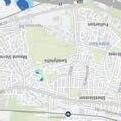


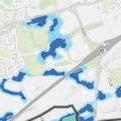


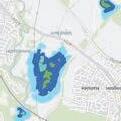


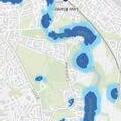


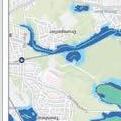






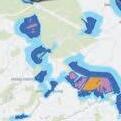


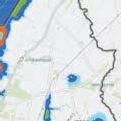


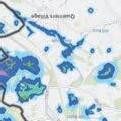




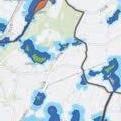


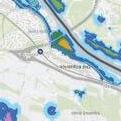


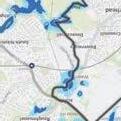


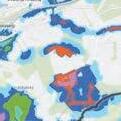
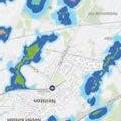


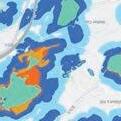





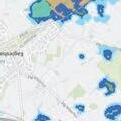
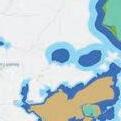
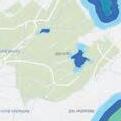


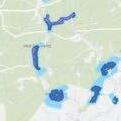


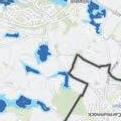


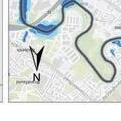


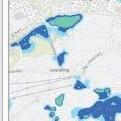


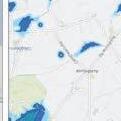


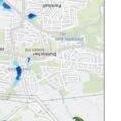


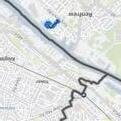


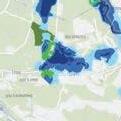

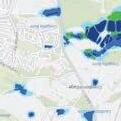




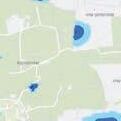


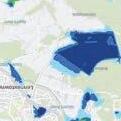


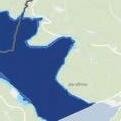

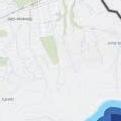


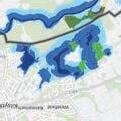


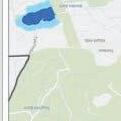


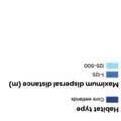


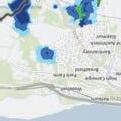




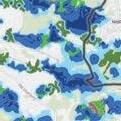


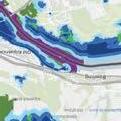


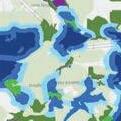




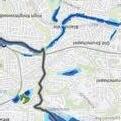


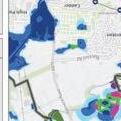


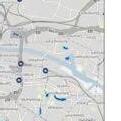


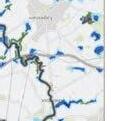


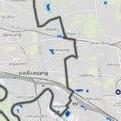


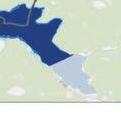


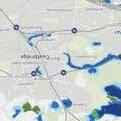





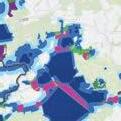


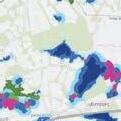


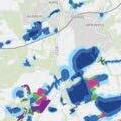
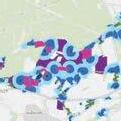


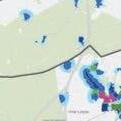


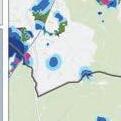


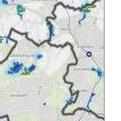


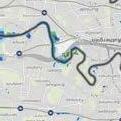


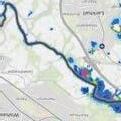
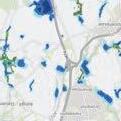


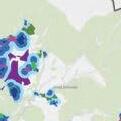


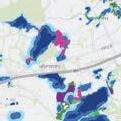
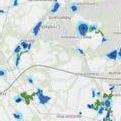


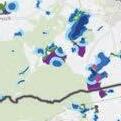


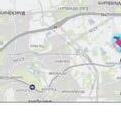


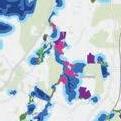




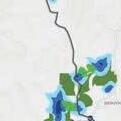


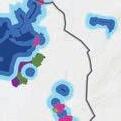


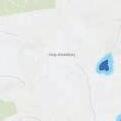


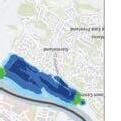










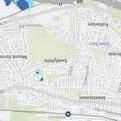


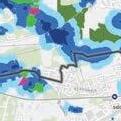

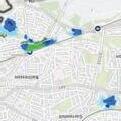


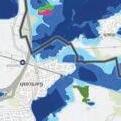

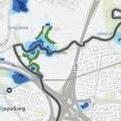


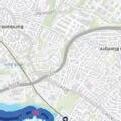


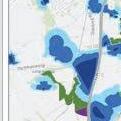






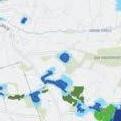




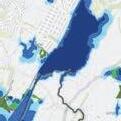


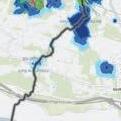


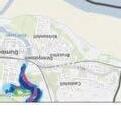

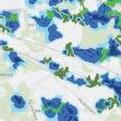


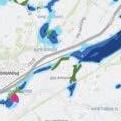


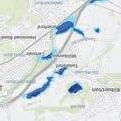


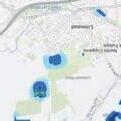
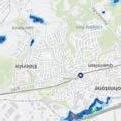


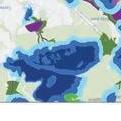


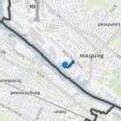


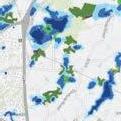


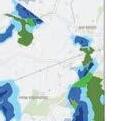


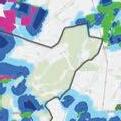






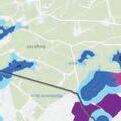


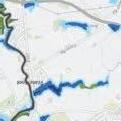


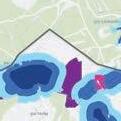


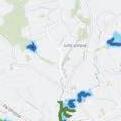


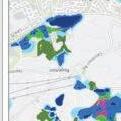


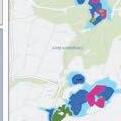


Glasgow City Region: Wetland Opportunity Mapping
Habitats Classification
Phase 1
B5 – Marshy grassland
D2 – Wet dwarf shrub heath
D4 – Montane heath / dwarf herb
Wet Grassland
Wet Heath
Wet Grassland
D6 – Wet heath / acid grassland mosiac Wet Heath
E1 - Bog Bog
E1.6.1 - Blanket bog Bog
E1.6.2 - Raised bog Bog
E1.7 - Wet modified bog Bog
E1.7.1 - Dry modified bog Bog
E2.1 - Acid / neutral flush Springs, flushes and seepages
E2.2 - Basic flush Springs, flushes and seepages
E3 - Fen Fen
E3.1 - Valley mire. Fen
E3.2 - Basin mire Fen
F1 - Swamp Swamp
F2 – Inundation vegetation Swamp
H2 - Saltmarsh Saltmarsh
H2.4 - Scattered plant Saltmarsh
G1 - Standing water Standing water
G2- Running water Running water
NVC
CG10 - estuca ovina - Agrostis capillaris - Thymus praecox grassland
H12 - Calluna vulgaris – Vaccinium myrtillus heath
Wet grassland
Non-specific wetland
H17 - Calluna vulgaris–Arctostaphylos alpinus heath Springs, flushes and seepages
H21 - Calluna vulgaris – Vaccinium myrtillus – Sphagnum capillifolium heath
Wet heath
M4 - Carex rostrata - Sphagnum recurvum mire Fen
M5 - Carex rostrata–Sphagnum squarrosum mire Fen
M6 - Carex echinata–Sphagnum recurvum/auriculatum mire
Springs, flushes and seepages
Glasgow City Region: Wetland Opportunity Mapping
Habitats
M9 - Carex rostrata–Calliergon cuspidatum/giganteum mire
M10 - Carex dioica–Pinguicula vulgaris mire
M11 - Carex demissa–Saxifraga aizoides mire
M12 - Carex saxatilis mire
M15 - Scirpus cespitosus–Erica tetralix wet heath
NVC Continued
M17 - Scirpus cespitosus–Eriophorum vaginatum blanket mire
M18 - Erica tetralix–Sphagnum papillosum raised and blanket mire
M19 - Calluna vulgaris–Eriophorum vaginatum blanket mire
M20 - Eriophorum vaginatum blanket and raised mire
M23 - Juncus effusus/acutiflorus–Galium palustre rush-pasture
M25 - Molinia caerulea–Potentilla erecta mire
M26 - 6 Molinia caerulea–Crepis paludosa mire
M27 - Filipendula ulmaria–Angelica sylvestris mire
M28 - ris pseudacorus–Filipendula ulmaria mire
M29 - Hypericum elodes–Potamogeton polygonifolius soakway
M32 - Philonotis fontana–Saxifraga stellaris spring
M35 - Ranunculus omiophyllus–Montia fontana rill
M38 - Cratoneuron commutatum–Carex nigra spring
MG10 - Holcus lanatus–Juncus effusus rush-pasture
Classification
Springs, flushes and seepages
Springs, flushes and seepages
Springs, flushes and seepages
Springs, flushes and seepages
Wet heath
Non-specific wetland
Non-specific wetland
Non-specific wetland
Non-specific wetland
Wet grassland
Non-specific wetland
Wet grassland
Fen
Springs, flushes and seepages
Springs, flushes and seepages
Springs, flushes and seepages
Springs, flushes and seepages
Springs, flushes and seepages
Wet grassland
Glasgow City Region: Wetland Opportunity Mapping
Habitats Classification
MG9 - Holcus lanatus–Deschampsia cespitosa grassland
S4 - Phragmites australis swamp and reed-beds
Wet grassland
Reedbed
S7- Carex acutiformis swamp Swamp
S9 - Carex rostrata swamp Swamp
S10 - Equisetum fluviatile swamp Swamp
S11 - Carex vesicaria swamp Swamp
S12 - Typha latifolia swamp Swamp
S14 - Sparganium erectum swamp Swamp
S19 - Eleocharis palustris swamp Swamp
S22 - Glyceria fluitans water-margin vegetation Swamp
S27 - Carex rostrata–Potentilla palustris tall-herb fen
Non-specific Wetland
S28 - Phalaris arundinacea tall-herb fen Swamp
U4 - Festuca ovina–Agrostis capillaris–Galium saxatile grassland
U5 - Nardus stricta–Galium saxatile grassland
U6 - Juncus squarrosus–Festuca ovina grassland
U16 - Luzula sylvatica–Vaccinium myrtillus tall-herb community
W1 - Salix cinerea–Galium palustre woodland
W11 - Quercus petraea–Betula pubescens–Oxalis acetosella woodland
W2 - Salix cinerea–Betula pubescens–Phragmites australis woodland
W3 - Salix pentandra–Carex rostrata woodland
W4 - Betula pubescens–Molinia caerulea woodland
NVC Continued
W5 - Alnus glutinosa–Carex paniculata woodland
Wet grassland
Wet grassland
Wet grassland
Springs, flushes and seepages
Wet woodland
Wet woodland
Wet woodland
Wet woodland
Wet woodland
Wet woodland
Glasgow City Region: Wetland Opportunity Mapping
Habitats Classification
W7 - Alnus glutinosa–Fraxinus excelsior–Lysimachia nemorum woodland
W9 - Fraxinus excelsior–Sorbus aucuparia–Mercurialis perennis woodland
Wet woodland
Wet woodland
Species Fen & Marsh Freshwater Bogs
Achillea ptarmica L. Yes
Aconitum napellus L. Yes
Agrostis canina L. s.s. Yes Yes
Alisma gramineum Lej. Yes
Alisma lanceolatum With. Yes
Alisma plantago-aquatica L. Yes Yes
Alopecurus aequalis Sobol. Yes
Alopecurus magellanicus Lam. Yes
Althaea officinalis L. Yes
Anagallis tenella (L.) L. Yes
Andromeda polifolia L. Yes
Angelica sylvestris L. Yes
Apium graveolens L. Yes
Apium inundatum (L.) Rchb.f. Yes Yes
Apium nodiflorum (L.) Lag. Yes
Apium repens (Jacq.) Lag. Yes
Baldellia ranunculoides (L.) Parl. Yes
Bartsia alpina L. Yes
Berula erecta (Huds.) Coville Yes
Betula nana L. Yes
Bidens cernua L. Yes
Bidens tripartita L. Yes Yes
Blysmus compressus (L.) Panz. ex Link Yes
Butomus umbellatus L. Yes
Calamagrostis canescens (F.H.Wigg.) Roth Yes
Calamagrostis epigejos (L.) Roth Yes
Calamagrostis purpurea (Trin.) Trin. Yes
Calamagrostis scotica (Druce) Druce Yes
Calamagrostis stricta (Timm) Koeler Yes
Callitriche brutia Petagna Yes
Callitriche hermaphroditica L. Yes
Callitriche obtusangula Le Gall Yes
Callitriche palustris L. Yes
Callitriche platycarpa Kütz. Yes Yes
Callitriche stagnalis Scop. s.s. Yes
Species Fen & Marsh Freshwater Bogs
Callitriche truncata Guss. Yes
Caltha palustris L. Yes
Cardamine amara L. Yes
Cardamine pratensis L. Yes
Carex acuta L. Yes
Carex acutiformis Ehrh. Yes
Carex appropinquata Schumach. Yes
Carex aquatilis Wahlenb. Yes Yes
Carex atrofusca Schkuhr Yes
Carex buxbaumii Wahlenb. Yes
Carex canescens L. Yes
Carex cespitosa L. Yes
Carex chordorrhiza L.f. Yes
Carex diandra Schrank Yes
Carex dioica L. Yes
Carex disticha Huds. Yes
Carex echinata Murray Yes Yes Yes
Carex elata All. Yes
Carex flacca Schreb. Yes
Carex flava L. Yes
Carex hostiana DC. Yes
Carex lachenalii Schkuhr Yes
Carex lasiocarpa Ehrh. Yes
Carex limosa L. Yes Yes
Carex magellanica Lam. Yes
Carex microglochin Wahlenb. Yes
Carex nigra (L.) Reichard Yes
Carex otrubae Podp. Yes
Carex panicea L. Yes
Carex paniculata L. Yes
Carex pauciflora Lightf. Yes
Carex pendula Huds. Yes
Carex pseudocyperus L. Yes
Carex pulicaris L. Yes
Carex recta Boott Yes
Carex remota L. Yes
Glasgow City Region: Wetland Opportunity Mapping
Species Fen & Marsh Freshwater Bogs
Carex riparia Curtis Yes Yes
Carex rostrata Stokes Yes
Carex strigosa Huds. Yes
Carex vesicaria L. Yes
Carex viridula s.l. Yes Yes
Carex vulpina L. Yes
Carum verticillatum (L.) W.D.J.Koch Yes Yes
Catabrosa aquatica (L.) P.Beauv. Yes
Ceratophyllum demersum L. Yes
Ceratophyllum submersum L. Yes
Chrysosplenium alternifolium L. Yes Yes
Chrysosplenium oppositifolium L. Yes
Cicendia filiformis (L.) Delarbre Yes
Cicuta virosa L. Yes Yes
Cirsium dissectum (L.) Hill Yes
Cirsium palustre (L.) Scop. Yes Yes
Cladium mariscus (L.) Pohl Yes
Cochlearia pyrenaica DC. Yes
Comarum palustre L. Yes
Crassula aquatica (L.) Schönland Yes
Crepis paludosa (L.) Moench Yes
Cuscuta europaea L. Yes
Cyperus fuscus L. Yes
Cyperus longus L. Yes Yes
Dactylorhiza fuchsii (Druce) Soó Yes
Dactylorhiza incarnata (L.) Soó Yes
Dactylorhiza maculata (L.) Soó Yes
Dactylorhiza majalis (Rchb.) P.F.Hunt & Summerh. s.s. Yes
Dactylorhiza praetermissa (Druce) Soó Yes
Dactylorhiza purpurella (T.Stephenson & T.A.Stephenson) Soó Yes
Dactylorhiza traunsteinerioides (Pugsley)
R.M.Bateman & Denholm Yes
Damasonium alisma Mill. Yes
Deschampsia setacea (Huds.) Hack. Yes Yes
Drosera anglica Huds. Yes
Drosera intermedia Hayne Yes Yes
Glasgow City Region: Wetland Opportunity Mapping
Species Fen & Marsh Freshwater Bogs
Drosera rotundifolia L. Yes
Dryopteris cristata (L.) A.Gray Yes
Elatine hexandra (Lapierre) DC. Yes
Elatine hydropiper L. Yes
Eleocharis acicularis (L.) Roem. & Schult. Yes
Eleocharis mamillata (H.Lindb.) H.Lindb. Yes
Eleocharis multicaulis (Sm.) Desv. Yes Yes Yes
Eleocharis palustris (L.) Roem. & Schult. Yes
Eleocharis quinqueflora (Hartmann) O.Schwarz Yes
Eleocharis uniglumis (Link) Schult. Yes
Eleogiton fluitans (L.) Link Yes
Epilobium alsinifolium Vill. Yes
Epilobium anagallidifolium Lam. Yes
Epilobium hirsutum L. Yes Yes
Epilobium obscurum Schreb. Yes
Epilobium palustre L. Yes Yes
Epipactis palustris (L.) Crantz Yes
Equisetum fluviatile L. Yes
Equisetum hyemale L. Yes Yes
Equisetum palustre L. Yes
Equisetum pratense Ehrh. Yes
Equisetum telmateia Ehrh. Yes
Equisetum variegatum Schleich. ex F.Weber & D.Mohr Yes
Erica tetralix L. Yes
Eriocaulon aquaticum (Hill) Druce Yes
Eriophorum angustifolium Honck. Yes
Eriophorum gracile W.D.J.Koch ex Roth Yes
Eriophorum latifolium Hoppe Yes
Eriophorum vaginatum L. Yes
Eupatorium cannabinum L. Yes
Euphrasia arctica Lange ex Rostrup Yes
Euphrasia campbelliae Pugsley Yes
Filipendula ulmaria (L.) Maxim. Yes
Gagea lutea (L.) Ker Gawl. Yes
Galium constrictum Chaub. Yes
Glasgow City Region: Wetland Opportunity Mapping
Species Fen & Marsh Freshwater Bogs
Galium palustre L. Yes
Galium uliginosum L. Yes
Glyceria declinata Bréb. Yes
Glyceria maxima (Hartm.) Holmb. Yes
Groenlandia densa (L.) Fourr. Yes
Gymnadenia conopsea s.l. Yes
Hammarbya paludosa (L.) Kuntze Yes
Hierochloe odorata (L.) P.Beauv. Yes Yes
Hippuris vulgaris L. Yes Yes
Hottonia palustris L. Yes
Hydrilla verticillata (L.f.) Royle Yes
Hydrocharis morsus-ranae L. Yes
Hydrocotyle vulgaris L. Yes
Hypericum elodes L. Yes
Hypericum tetrapterum Fr. Yes
Hypericum undulatum Schousb. ex Willd. Yes
Illecebrum verticillatum L. Yes
Iris pseudacorus L. Yes
Isoetes echinospora Durieu Yes
Isoetes lacustris L. Yes
Isolepis cernua (Vahl) Roem. & Schult. Yes
Isolepis setacea (L.) R.Br. Yes Yes
Juncus acutiflorus Ehrh. ex Hoffm. Yes
Juncus alpinoarticulatus Chaix Yes
Juncus biglumis L. Yes
Juncus bulbosus L. Yes
Juncus compressus Jacq. Yes
Juncus filiformis L. Yes
Juncus foliosus Desf. Yes Yes
Juncus subnodulosus Schrank Yes
Juncus triglumis L. Yes
Kobresia simpliciuscula (Wahlenb.) Mack. Yes
Koenigia islandica L. Yes
Lathyrus palustris L. Yes
Leersia oryzoides (L.) Sw. Yes
Lemna gibba L. Yes
Glasgow City Region: Wetland Opportunity Mapping
Species Fen & Marsh Freshwater Bogs
Lemna minor L. Yes Yes
Lemna trisulca L. Yes Yes
Limosella aquatica L. Yes
Liparis loeselii (L.) Rich. Yes
Littorella uniflora (L.) Asch. Yes Yes
Lobelia dortmanna L. Yes
Lotus pedunculatus Cav. Yes
Ludwigia palustris (L.) Elliott Yes
Luronium natans (L.) Raf. Yes
Luzula pallescens Sw. Yes
Lycopodiella inundata (L.) Holub Yes
Lycopus europaeus L. Yes
Lysimachia nummularia L. Yes Yes
Lysimachia thyrsiflora L. Yes Yes
Lysimachia vulgaris L. Yes
Lythrum portula (L.) D.A.Webb Yes Yes
Lythrum salicaria L. Yes
Mentha aquatica L. Yes
Mentha arvensis L. Yes
Mentha pulegium L. Yes
Menyanthes trifoliata L. Yes
Minuartia stricta (Sw.) Hiern Yes
Montia fontana L. Yes
Myosotis laxa Lehm. Yes
Myosotis scorpioides L. Yes Yes
Myosotis secunda Al.Murray Yes
Myosotis stolonifera (DC.) J.Gay ex Leresche & Levier Yes Yes
Myosoton aquaticum (L.) Moench Yes Yes
Myrica gale L. Yes
Myriophyllum alterniflorum DC. Yes
Myriophyllum spicatum L. Yes
Myriophyllum verticillatum L. Yes
Najas flexilis (Willd.) Rostk. & W.L.E.Schmidt Yes
Najas marina L. Yes
Narthecium ossifragum (L.) Huds. Yes
Glasgow City Region: Wetland Opportunity Mapping
Species Fen & Marsh Freshwater Bogs
Nasturtium microphyllum (Boenn.) Rchb. Yes
Nasturtium officinale W.T.Aiton s.s. Yes
Neottia ovata (L.) Bluff & Fingerh. Yes
Nuphar lutea (L.) Sm. Yes
Nuphar pumila (Timm) DC. Yes
Nymphaea alba L. Yes
Nymphoides peltata Kuntze Yes
Oenanthe aquatica (L.) Poir. Yes
Oenanthe crocata L. Yes Yes
Oenanthe fistulosa L. Yes
Oenanthe fluviatilis (Bab.) Coleman Yes
Oenanthe lachenalii C.C.Gmel. Yes
Ophrys insectifera L. Yes
Osmunda regalis L. Yes
Parnassia palustris L. Yes
Pedicularis palustris L. Yes
Pedicularis sylvatica L. Yes Yes
Persicaria amphibia (L.) Delarbre Yes Yes
Persicaria minor (Huds.) Opiz Yes
Persicaria mitis (Schrank) Assenov Yes
Phalaris arundinacea L. Yes Yes
Phleum alpinum L. Yes
Phragmites australis (Cav.) Trin. ex Steud. Yes
Pilularia globulifera L. Yes
Pinguicula lusitanica L. Yes
Pinguicula vulgaris L. Yes Yes
Populus nigra s.l. Yes
Potamogeton acutifolius Link Yes
Potamogeton alpinus Balb. Yes
Potamogeton berchtoldii Fieber Yes
Potamogeton coloratus Hornem. Yes
Potamogeton compressus L. Yes
Potamogeton crispus L. Yes
Potamogeton epihydrus Raf. Yes
Potamogeton filiformis Pers. Yes
Potamogeton friesii Rupr. Yes
Glasgow City Region: Wetland Opportunity Mapping
Species Fen & Marsh Freshwater Bogs
Potamogeton gramineus L. Yes
Potamogeton lucens L. Yes
Potamogeton natans L. Yes Yes
Potamogeton nodosus Poir. Yes
Potamogeton obtusifolius Mert. & W.D.J.Koch Yes
Potamogeton pectinatus L. Yes
Potamogeton perfoliatus L. Yes
Potamogeton polygonifolius Pourr. Yes Yes Yes
Potamogeton praelongus Wulfen Yes
Potamogeton pusillus L. Yes
Potamogeton rutilus Wolfg. Yes
Potamogeton trichoides Cham. & Schltdl. Yes
Primula farinosa L. Yes
Pulicaria dysenterica (L.) Bernh. Yes
Ranunculus aquatilis L. s.s. Yes
Ranunculus baudotii Godr. Yes
Ranunculus circinatus Sibth. Yes
Ranunculus flammula L. Yes
Ranunculus fluitans Lam. Yes
Ranunculus hederaceus L. Yes Yes
Ranunculus lingua L. Yes
Ranunculus omiophyllus Ten. Yes
Ranunculus ophioglossifolius Vill. Yes
Ranunculus peltatus Schrank Yes Yes
Ranunculus penicillatus (Dumort.) Bab. Yes
Ranunculus reptans L. Yes
Ranunculus sardous Crantz Yes
Ranunculus trichophyllus Chaix Yes Yes
Ranunculus tripartitus DC. Yes
Rhynchospora alba (L.) Vahl Yes
Rhynchospora fusca (L.) W.T.Aiton Yes
Ribes nigrum L. Yes
Rorippa amphibia (L.) Besser Yes Yes
Rorippa islandica (Oeder ex Gunnerus) Borbás s.s. Yes
Rorippa palustris (L.) Besser Yes Yes
Rorippa sylvestris (L.) Besser Yes Yes
Glasgow City Region: Wetland Opportunity Mapping
Species Fen & Marsh Freshwater Bogs
Rubus chamaemorus L. Yes
Rumex aquaticus L. Yes Yes
Rumex hydrolapathum Huds. Yes
Rumex longifolius DC. Yes
Rumex maritimus L. Yes
Rumex palustris Sm. Yes
Sagina nodosa (L.) Fenzl Yes
Sagittaria sagittifolia L. Yes
Salix cinerea L. Yes
Salix myrsinifolia Salisb. Yes
Salix phylicifolia L. Yes
Salix purpurea L. Yes Yes
Salix triandra L. Yes Yes
Samolus valerandi L. Yes
Saxifraga aizoides L. Yes
Saxifraga hirculus L. Yes
Saxifraga rivularis L. Yes
Saxifraga stellaris L. Yes
Scheuchzeria palustris L. Yes
Schoenoplectus lacustris (L.) Palla Yes
Schoenoplectus tabernaemontani (C.C.Gmel.) Palla Yes Yes
Schoenoplectus triqueter (L.) Palla Yes
Schoenus ferrugineus L. Yes
Schoenus nigricans L. Yes
Scirpus sylvaticus L. Yes
Scrophularia umbrosa Dumort. Yes
Scutellaria galericulata L. Yes
Scutellaria minor Huds. Yes
Sedum villosum L. Yes
Selaginella selaginoides (L.) P.Beauv. Yes
Selinum carvifolia (L.) L. Yes
Senecio aquaticus Hill Yes Yes
Senecio paludosus L. Yes Yes
Sibthorpia europaea L. Yes
Silene flos-cuculi (L.) Clairv. Yes
Sium latifolium L. Yes Yes
Glasgow City Region: Wetland Opportunity Mapping
Species Fen & Marsh Freshwater Bogs
Solanum dulcamara L. Yes Yes
Sonchus palustris L. Yes
Sparganium angustifolium Michx. Yes
Sparganium emersum Rehmann Yes
Sparganium erectum L. Yes Yes
Sparganium natans L. Yes
Spiranthes romanzoffiana Cham. Yes
Spirodela polyrhiza (L.) Schleid. Yes
Stachys palustris L. Yes Yes
Stellaria alsine Grimm Yes Yes
Stellaria nemorum L. Yes
Stellaria palustris Ehrh. ex Hoffm. Yes
Stratiotes aloides L. Yes
Subularia aquatica L. Yes
Symphytum officinale L. Yes
Teucrium scordium L. Yes Yes
Thalictrum alpinum L. Yes
Thalictrum flavum L. Yes
Thelypteris palustris Schott Yes
Thyselium palustre (L.) Raf. Yes
Tofieldia pusilla (Michx.) Pers. Yes
Trichophorum cespitosum (L.) Hartm. s.s. Yes
Triglochin palustris L. Yes
Trollius europaeus L. Yes
Typha angustifolia L. Yes
Typha latifolia L. Yes
Utricularia australis R.Br. Yes
Utricularia intermedia agg. Yes Yes Yes
Utricularia minor L. Yes Yes
Utricularia vulgaris agg. Yes
Vaccinium microcarpum (Turcz. ex Rupr.) Schmalh. Yes
Vaccinium oxycoccos L. Yes
Valeriana dioica L. Yes
Valeriana officinalis L. Yes
Veronica anagallis-aquatica L. Yes
Veronica catenata Pennell Yes
Glasgow City Region: Wetland Opportunity Mapping
Species Fen & Marsh Freshwater Bogs
Veronica scutellata L. Yes Yes
Vicia cracca L. Yes
Viola palustris L. Yes Yes
Viola persicifolia auct. non Schreb. Yes
Wahlenbergia hederacea (L.) Rchb. Yes Yes
Wolffia arrhiza (L.) Horkel ex Wimm. Yes
Zannichellia palustris L. Yes
Species
1. Acentria ephemerella
2. Acroloxus lacustris
3. Adicella filicornis
4. Aeshna cyanea
5. Aeshna grandis
6. Aeshna juncea
7. Aeshna mixta
8. Agapetus delicatulus
9. Agapetus fuscipes
10. Agapetus ochripes
11. Agraylea multipunctata
12. Agraylea sexmaculata
13. Agrypnia pagetana
14. Agrypnia varia
15. Alboglossiphonia heteroclita
16. Alboglossiphonia heteroclita
17. Allogamus auricollis
18. Allolobophora chlorotica
19. Amphinemura sulcicollis
20. Anabolia nervosa
21. Anasimyia lineata
22. Anasimyia lunulata
23. Ancylus fluviatilis
24. Antocha vitripennis
Glasgow City Region: Wetland Opportunity Mapping
25. Aphelocheirus (Aphelocheirus) aestivalis
26. Aplexa hypnorum
27. Aporrectodea caliginosa
28. Aporrectodea longa
29. Aporrectodea rosea
30. Arctocorisa germari
31. Argulus coregoni
32. Argulus foliaceus
33. Atherix ibis
34. Athripsodes albifrons
35. Athripsodes aterrimus
36. Athripsodes cinereus
37. Austropotamobius pallipes
38. Baetis muticus
39. Baetis scambus
40. Bathyomphalus contortus
41. Bdellocephala punctata
42. Beraea maurus
43. Beris vallata
44. Bibio ferruginatus
45. Bibio marci
46. Bithynia tentaculata
47. Brachycentrus subnubilus
48. Brachyptera risi
49. Bufo bufo
50. Caenis horaria
51. Caenis luctuosa
52. Caenis rivulorum
53. Carcinus maenas
54. Carychium minimum
55. Carychium tridentatum
56. Ceraclea dissimilis
57. Ceraclea fulva
58. Chartoscirta cincta
59. Chloromyia formosa
60. Chrysogaster solstitialis
61. Chrysopilus cristatus
62. Chrysotus cilipes
63. Cloeon dipterum
64. Cloeon simile
65. Coenagrion puella
66. Contacyphon padi
67. Cordulegaster boltonii
68. Corixa dentipes
69. Corixa panzeri
70. Corixa punctata
71. Cymatia bonsdorffii
72. Cyrnus flavidus
73. Cyrnus trimaculatus
74. Dendrobaena octaedra
75. Dendrocoelum lacteum
76. Dilophus febrilis
Glasgow City Region: Wetland Opportunity Mapping
77. Dina lineata
78. Dinocras cephalotes
79. Diplectrona felix
80. Diura bicaudata
81. Dolichopeza albipes
82. Dolichopus plumipes
83. Dolichopus popularis
84. Dolichopus simplex
85. Dolichopus trivialis
86. Drusus annulatus
87. Ecdyonurus dispar
88. Ecdyonurus insignis
89. Ecdyonurus torrentis
90. Ecdyonurus venosus
91. Eiseniella tetraedra
92. Empis livida
93. Enallagma cyathigerum
94. Ephemera danica
95. Eriocheir sinensis
96. Eristalis arbustorum
97. Eristalis horticola
98. Eristalis intricaria
99. Eristalis pertinax
100. Eristalis tenax
101. Erpobdella octoculata
102. Erpobdella testacea
Glasgow City Region: Wetland Opportunity Mapping
103. Erpobdella testacea
104. Gammarus lacustris
105. Gammarus pulex
106. Gerris (Gerris) costae
107. Glossiphonia complanata
108. Glossiphonia complanata
109. Glossiphonia paludosa
110. Glossiphonia verrucata
111. Glossosoma boltoni
112. Glyphotaelius pellucidus
113. Goera pilosa
114. Grammotaulius nigropunctatus
115. Graphomya maculata
116. Habrophlebia fusca
117. Haematopota pluvialis
118. Haemopis sanguisuga
119. Halesus radiatus
120. Haliplus sibiricus
121. Helobdella stagnalis
122. Helobdella stagnalis
123. Helophilus pendulus
124. Hemiclepsis marginata
125. Hemiclepsis marginata
126. Heptagenia sulphurea
127. Hercostomus chetifer
128. Hesperocorixa castanea
Glasgow City Region: Wetland Opportunity Mapping
129. Hesperocorixa linnaei
130. Hesperocorixa sahlbergi
131. Hippeutis complanatus
132. Holocentropus picicornis
133. Holocentropus stagnalis
134. Hydrometra stagnorum
135. Hydropsyche instabilis
136. Hydropsyche pellucidula
137. Hydropsyche siltalai
138. Hydroptila forcipata
139. Hydroptila sparsa
140. Ilione lineata
141. Ischnura elegans
142. Isoperla grammatica
143. Lejogaster metallina
144. Lepidostoma hirtum
145. Leptophlebia marginata
146. Leptophlebia vespertina
147. Lestes sponsa
148. Leuctra geniculata
149. Leuctra hippopus
150. Leuctra inermis
151. Leuctra moselyi
152. Leuctra nigra
153. Libellula quadrimaculata
154. Limnephilus auricula
Glasgow City Region: Wetland Opportunity Mapping
155. Limnephilus binotatus
156. Limnephilus centralis
157. Limnephilus decipiens
158. Limnephilus extricatus
159. Limnephilus flavicornis
160. Limnephilus hirsutus
161. Limnephilus incisus
162. Limnephilus lunatus
163. Limnephilus luridus
164. Limnephilus marmoratus
165. Limnephilus nigriceps
166. Limnephilus politus
167. Limnephilus sparsus
168. Limnephilus stigma
169. Limnephilus subcentralis
170. Limnephilus vittatus
171. Limnia unguicornis
172. Limonia flavipes
173. Limonia macrostigma
174. Limonia nubeculosa
175. Limonia phragmitidis
176. Lissotriton helveticus
177. Lissotriton helveticus/vulgaris
178. Lissotriton vulgaris
179. Lonchoptera lutea
180. Lumbricus castaneus
Glasgow City Region: Wetland Opportunity Mapping
181. Lumbricus festivus
182. Lumbricus rubellus
183. Lumbricus terrestris
184. Lymnaea stagnalis
185. Lype phaeopa
186. Melanogaster hirtella
187. Micropterna lateralis
188. Micropterna sequax
189. Molanna angustata
190. Myathropa florea
191. Mystacides azurea
192. Mystacides longicornis
193. Mytilus edulis
194. Nemotelus nigrinus
195. Nemoura avicularis
196. Nemurella pictetii
197. Neoascia podagrica
198. Nepa cinerea
199. Nepa cinerea
200. Nephrotoma flavipalpis
201. Notonecta (Notonecta) glauca
202. Notonecta (Notonecta) obliqua
203. Nymphula nitidulata
204. Octolasion cyaneum
205. Octolasion lacteum
206. Odontocerum albicorne
Glasgow City Region: Wetland Opportunity Mapping
207. Oecetis lacustris
208. Oligotricha striata
209. Omphiscola glabra
210. Pacifastacus leniusculus
211. Paraleptophlebia submarginata
212. Perla bipunctata
213. Pherbellia schoenherri
214. Pherbina coryleti
215. Phryganea bipunctata
216. Physa fontinalis
217. Physella acuta
218. Piscicola geometra
219. Piscicola geometra
220. Planaria torva
221. Planorbarius corneus
222. Planorbella duryi
223. Planorbis carinatus
224. Planorbis planorbis
225. Pleurodelinae sp.
226. Polycelis felina
227. Polycelis nigra
228. Polycelis tenuis
229. Polycentropus kingi
230. Potamophylax latipennis
231. Potamopyrgus antipodarum
232. Proasellus meridianus
Glasgow City Region: Wetland Opportunity Mapping
233. Procloeon pennulatum
234. Protonemura meyeri
235. Psychoda albipennis
236. Psychomyia pusilla
237. Ptychoptera contaminata
238. Pyrrhosoma nymphula
239. Radix auricularia
240. Rana temporaria
241. Rhaphium auctum
242. Rhithrogena germanica
243. Rhithrogena semicolorata
244. Rhyacophila obliterata
245. Saldula c-album
246. Sepedon sphegea
247. Sericomyia silentis
248. Sericostoma personatum
249. Serratella ignita
250. Sialis lutaria
251. Silo pallipes
252. Sphaerium corneum
253. Sphegina clunipes
254. Stagnicola fuscus
255. Stylaria lacustris
256. Succinea putris
257. Succinella oblonga
258. Sympetrum danae
Glasgow City Region: Wetland Opportunity Mapping
259. Sympetrum striolatum
260. Tabanus sudeticus
261. Taeniopteryx nebulosa
262. Tetanocera arrogans
263. Tetanocera robusta
264. Theromyzon tessulatum
265. Theromyzon tessulatum
266. Tipula confusa
267. Tipula fascipennis
268. Tipula lateralis
269. Tipula luna
270. Tipula maxima
271. Tipula oleracea
272. Tipula pagana
273. Tipula paludosa
274. Tipula staegeri
275. Tipula varipennis
276. Tipula vernalis
277. Tipula vittata
278. Triaenodes bicolor
279. Triturus cristatus
280. Trocheta pseudodina
281. Trocheta subviridis
282. Valvata cristata
283. Valvata macrostoma
284. Velia (Plesiovelia) caprai
Glasgow City Region: Wetland Opportunity Mapping
Glasgow City Region: Wetland Opportunity