25 minute read
The Role of Socioeconomic Factors
The Role of Socioeconomic Factors in Influencing Tuberculosis Rates: A Comparison of New York State and New York City 2007-2016
Raskirth P. Singh1*‡, Rachael O. Oluwasanmi1*, Smita S. Bajgain1*, Matthew M. Bradley1*, Michael I. Abdool1* , and Kylar J. Harvey¹*‡
¹Geisinger Commonwealth School of Medicine, Scranton, PA 18509 *Master of Biomedical Sciences Program ‡Authors contributed equally Correspondence: rsingh04@som.geisinger.edu
Abstract
Background: The chronic and preventable lung disease tuberculosis (TB) is caused by a bacterial species known as Mycobacterium tuberculosis. TB is a contagious disease that may lead to death if left untreated. Adverse health outcomes from TB range from excessive coughing to weight loss, and it is estimated to cost the United States healthcare system $123.4 million per year. TB is a preventable disease that disproportionately affects individuals in a low economic status; however, TB infection rates have decreased in low socioeconomic status (SES) populations between the years 2007 and 2016 without a known cause. Methods: Through a secondary analysis of the New York City Health Tuberculosis Annual Report, three SES factors (poverty rate, average median income, and percent of the population holding health insurance between 18 and 64 years of age) were explored as contributing factors to the decline of TB infection rates within the state of New York. We evaluated correlations between TB infections and SES factors of New York State (excluding New York City), the five boroughs of New York City, and New York City as a whole. Analysis of the data using a Pearson's product-moment correlation & Spearman's rank correlation found statistically significant relationships between each of the three SES factors and the rate of TB in New York State. Results: Each borough of New York City had at least one statistically significant correlation between TB rates and a SES factor. There was a significant correlation between the rate of TB and the poverty rate in the Bronx (r (4) = -0.76, p < 0.10), New York State (r (4) = -0.79, p < 0.01), Richmond (r (4) = -0.74, p < 0.10), and Queens (r (4) = -0.58, p < 0.10); but not in the other boroughs and New York City. The rate of TB and the median income in the borough of Kings (r (4) = -0.78, p < 0.01), Manhattan (r (4) = -0.61, p < 0.10), and New York State (r (4) = -0.64, p < 0.10) correlated significantly, but not in the other boroughs and New York City. Lastly, there was a significant correlation between the rate of TB and the health insured population aged 18-64 in the borough of Kings (r (4) = -0.63, p < 0.10), Manhattan (r (4) = -0.71, p < 0.10), New York state (r (4) = -0.64, p < 0.10), and Richmond (r (4) = -0.777, p < 0.01); but the other boroughs and New York City presented an insignificant relationship. Conclusion: Our study's findings suggest that SES factors influence TB infections rates, though each geographical area we looked at varied in which SES factors affect the rate of TB. Our study indicates that each community has different factors that may contribute to preventable diseases. Our study provides a framework for future research and policymakers to investigate workable solutions to reducing avoidable diseases in low-SES populations by making policies that help a specific community rather than blanket policies covering a large geographical area.
Introduction
Tuberculosis (TB) is a lung disease caused by Mycobacterium tuberculosis and accounts for 10.4 million new infections annually (1). TB may also affect other parts of the body, including the kidneys, spine, or brain (2). If a person with TB is not treated, they could be at increased risk for death (2). The disease causes symptoms of coughing, weakness, and weight loss (2). TB can spread person-to-person through coughing/ sneezing via air particles as a vector (2) According to the World Health Organization (WHO), about one-quarter of the world population is infected with M. tuberculosis and at risk of disease development (1). Difficulties in treatment have also arisen in the setting of multi-drug-resistant forms of the disease (1). In the last several decades, however, the United States (U.S.) has successfully reduced the prevalence of TB, with rates at an all-time low of 2019 (3). This success in the U.S. has been attributed to finding and treating infected patients and contact trace those potentially exposed to reduce secondary infection (3). Annual data supplied by the CDC (Centers for Disease Control and Prevention) that significantly higher rates of TB have been reported in several large cities such as New York (5). In the 2018 State and City TB Report, the CDC said that eight of the nine major cities tracked for significant TB rates were above the national average infection rate of 2.8 per 100,000 (5). For example, a notable finding was that Chicago, Philadelphia, and New York City were above the national average infection rate and above their respective state rates (5). This data supplies a rationale for considering that SES may play a role in the ability to be successfully treated for a TB infection. The lower SES factors such as poverty diminish the quality of life. These three cities have substantially lower SES populations respective to their state. Lower SES populations in the US continue to have higher rates of TB infections, possibly indicative of certain SES factors influencing TB infection rates (6). Previous literature has shown that people of low SES disproportionally have a greater risk of developing TB (7). We examined three socioeconomic factors — poverty rate, average median income, and percent of the population with health insurance from 18 to 65 years of age — to determine their potential influence on the decline
of TB infection rates in New York. These factors were chosen because they improved over the years 2007 to 2016. A secondary analysis was also performed to test the correlation of these factors with TB rates in New York and its boroughs. If addressed, changes in these SES factors could lead to increased funding and research, improved identification of infection and treatment, and realization of favorable health outcomes.
Methods
Procedure
A secondary analysis of the New York City Health Tuberculosis Annual Reports between 2007 and 2016 from the Department of Health and Mental Hygiene (DOHMH) was conducted to describe the relationship of TB and SES factors (8). These annual reports supply intimate surveillance data, summaries of program activities, and highlights. Rates of TB are based on the New York State Department of Health Bureau of Tuberculosis Control (BTBC) extrapolated from the United States Census Bureau interpolated intercensal population estimates from 2007 to 2016 (8). Data was collected for New York State TB rates, along with the rates of TB for New York City and its boroughs spanning from 2007 to 2016 using the New York City Annual Reports. The data mentions Richmond County, which was the old name for Staten Island borough. The data also says Kings County, which is referring to Brooklyn borough. The data utilizes these county names interchangeably with their respective borough. SES data on percent poverty, median income, and health insurance status for those aged 18 to 64 were collected from several sources. Data on poverty in each of the boroughs of NYC (New York City) and New York State was collected from the New York State Community Health Indicator Reports (CHRIS) (9). Additional information collected from the CHRIS database included median income and percent of those health-insured aged 18-64 for New York State and the boroughs of New York City (9). SES and TB rate data for New York City was obtained from the United States Census Bureau American Community Survey 1-year estimates in the years 2007 to 2016 using the filters "New York City" and "SES variable or TB rate" (10). Data of those with health insurance between the ages of 18 and 64 for all of New York City was derived from the New York City Department of Health EpiQuery (11).
Data analysis Collected correlation data and monotonic association data were analyzed using an open-source statistics software from the University of Amsterdam called Jeffrey's Amazing Statistics Program (JASP). Each SES factor within a region was compared to the TB rate within that region to detect significant correlations. A Pearson's product-moment correlation analysis was used to examine if individual SES factors had a linear correlation to the Rates of TB. Then, a Spearman's rank correlation coefficient was calculated to figure out the statistical dependence of TB rates on SES factors. For both Spearman's rank correlation and Pearson's product-moment correlation, a ρ-value was calculated to find if the data obtained could reject the null hypothesis of the variables having no effect on each other. The alpha-value adopted in the study was 0.10 due to the 10-year limit within the CHRIS database for New York, where data was only available for the years 2007 to 2016. This made the analysis more sensitive to detecting correlations and limited Type-2 errors during analysis. A 95% confidence interval was calculated for each test. Data tables were generated from JASP and copied into Microsoft Word. The individual graphs were generated from JASP and then compiled into figures using Origin Pro 2021 graphing and analysis.
Results
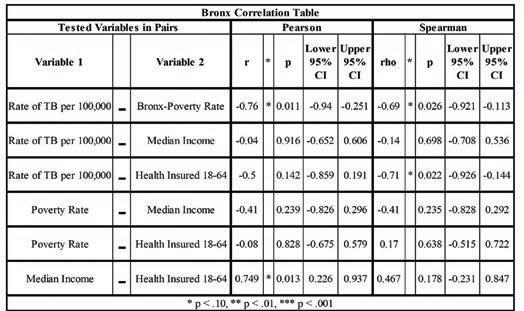
Table 1 shows a statistically significant negative correlation and association between the poverty rate and TB in Bronx, New York. The correlation between the rate of TB per 100,000 and Bronx-poverty rates showed a -0.76 r-value and a ρ-value of 0.011 in the Pearson's correlation analysis, indicative of a statistically significant, moderate negative correlation. Regarding Spearman's correlation, the ρ value was -0.69 with a ρ-value of 0.026, meaning a moderate negative association between the poverty rates and the rate of TB per 100,000 of Bronx, New York. The rate of TB per 100,000 compared with median income portrayed an r-value of -0.04. This r-value is quite close to zero, so there may be little to no association between the two variables. Regarding Spearman's correlation, the ρ value was -0.14, while the ρ-values for both Spearman's ρ and Pearson's r value were significantly greater than 0.1. Lastly, the rate of TB per 100,000 versus health insured between 1864 portrayed a -0.5 r-value in Pearson correlation with a ρ-value of 0.142. Regarding Spearman's correlation, the ρ value was -0.71 with a ρ-value of 0.022, meaning a statistically significant moderate negative association (Table 1 and Figure 1). In Table 2, the TB rate and poverty rates of Kings, New York, have an r-value of -0.2, a ρ-value of 0.585, a ρ value of -0.09, and a ρ-value of 0.811. This suggests there was no correlation or association between the two variables. The r-value for the rate of TB and the median income for Kings, New York, was -0.78 with a ρ-value of 0.001, showing there is a statistically significant strong-negative correlation between these two variables. Spearman's ρ was found to be -0.89, with a ρ-value of 0.001 suggesting a strong association between the two variables. For the rate of TB and those who are health insured between the ages of 18-64, the r-value reported was -0.63 with a ρ-value of 0.039, signifying a statistically significant negative correlation. The Spearman's ρ correlation was also shown to supply information on whether the variables were connected. Lastly, for the rate of TB and health insured, the ρ value obtained was -0.66 along with a ρ-value of 0.039, showing a statistically significant association between TB rates and the percentage of the population insured (Table 2 and Figure 2). Manhattan's correlation data comparing the rate of TB with each SES factor are shown in Table 3 and Figure 3. The rate of TB versus poverty rate produced an r-value of -0.1 and a ρ value of 0.03, suggesting there is no correlation between the two. The rate of TB compared with median income showed a moderate negative correlation with an r-value of -0.61 and a moderate negative association indicated with a ρ value of -0.6. The comparison of the rate of TB and median income had a ρ-value of 0.63 and a ρ-value of 0.073 for the Pearson correlation and Spearman's ρ, respectively, indicating a moderate statistical significance. The rate of TB compared with the percentage of the population who carry health insurance between 18-64 showed a moderate negative correlation via Pearson's r-value
of -0.71 and a strong association indicated with a Spearman's ρ of -0.83. The percentage of the population of health insured to the rates of TB was shown to have a moderate statistical significance with a ρ-value of 0.924 regarding their correlation and a strong statistical significance with a ρ-value of 0.003 about their monotonic association (Table 3 and Figure 3). Table 4 refers to the correlation and association data for New York City's rate of TB with each SES factor. The r-value for the rate of TB against poverty was reported to be 0.092 with a Spearman's ρ value of -0.01. This indicates no correlation between these variables in New York City along with ρ-values greater than 0.10, meaning we cannot reject our null hypothesis. For the rate of TB and median income, the r-value was -0.04 with a Spearman's ρ value of 0.104, suggesting there is no correlation or monotonic association between the rate of TB and median income. The r-value for the rate of TB and health insured in New York City was 0.109 and a ρ value of -0.07, indicating no correlation or monotonic association between the two variables (Table 4). The results for New York State are shown in Figure 4 and Table 5. For the two variables, rate of TB and poverty rate, the r-value was found to be -0.79 with a ρ-value of 0.007, which signifies a strong negative correlation that is statistically significant. The ρ value for TB and poverty rate of -0.58 is closer to -1, showing a moderate negative monotonic relationship with moderate statistical significance. For the rate of TB and median income, the r-value was -0.64, with a ρ-value of 0.047 indicating a moderate correlation that is statistically significant. A Spearman's ρ of -0.85 with a ρ-value of 0.002 meaning there is a statistically substantial strong negative correlation. For the rate of TB and health insured, the r-value was -0.64, with a ρ-value of 0.046 showing a statistically significant moderate negative correlation. The Spearman's ρ for TB and health insured was -0.83 along with a ρ-value of 0.003, shows a strong, negative, monotonic relationship (Table 5 and Figure 4). In the county of Richmond, New York, the rate of TB versus poverty rate portrayed a statistically significant correlation with a Pearson r-value of -0.704 and a ρ-value of 0.023. Spearman's ρ was deduced to be -0.74 and a ρ-value of 0.014, indicating a moderate negative monotonic relationship. The rate of TB compared with median income was not found to have a statistically significant correlation or monotonic relationship, with ρ-values greater than 0.10 for both Pearson's r-value and Spearman's ρ value. The rate of TB versus health insured between the ages of 18-64 showed a statistically significant strong correlation with an r-value of -0.777 and ρ-value of 0.008 along with a statistically significant, strong, negative, relationship shown by a ρ value of -0.93 and ρ-value <0.001 (Table 6 and Figure 5). Comparing the rate of TB versus poverty rate within Queens, New York, produced an r-value of -0.58 with a ρ-value of 0.082 and a Spearman's ρ value of -0.53 with a ρ-value of 0.112, indicating a statistically significant moderate correlation, but no association with each other. Examining median income, a statistically significant correlation was not found. For those insured from the ages of 18 to 64, there was no statistically significant correlation or association found with values for Pearson's r and Spearman's ρ, both over 0.10 (Table 7 and Figure 6).
Discussion
In the U.S., surveillance of the preventable disease TB has been underway since 1953, yet we still have a TB endemic 68 years later (13). To this day, there has not been a statistically significant decrease in deaths from TB infections since 2003 (14). As a preventable disease, it's alarming how the death rate for the U.S. has not had a statistically significant decline in 18 years. People of low SES in the U.S. are disproportionally affected by TB (15). It is often generalized in literature that low SES leads to a greater likelihood of development of TB; however, many studies have not broken down which socioeconomic factors may contribute more to the rates of TB. Identifying the socioeconomic factors that most significantly influence the incidence of TB may improve municipalities to develop better public policies that will help decrease TB incidence down to the zip code. In this study, we used a Pearson and Spearman correlation analysis to determine if the three socioeconomic factors, age-adjusted poverty rate, adjusted median income, and the percentage of adults 18 to 64 years of age holding health insurance, influence TB incidence rates. Based on the data analyzed, it isn't easy to summate all three socioeconomic factors and their correlations for each location we analyzed. Correlations between TB infection rates per 100,000 people and the investigated SES factors varied in their association and strength depending on the geographical area being examined. For example, we found that Kings, New York had a statistically significant negative correlation of TB incidence with median income and the percentage of adults 18 to 64 years of age who hold health insurance. In contrast, Queens, New York, did not have a statistically significant correlation in either. In fact, Queens, New York, only had a statistically significant correlation of TB incidence with poverty rate, while Kings, New York, did not. Our results indicate that there are differences in what influences the incidence of TB depending on the geographical area where cities may have boroughs and townships that have different needs than others within the same city limits. This variation between communities that are within the same cities most likely comes from public boundaries of municipalities. These boundaries have differing zoning, social support, funding, and other factors which may negatively contribute to the social disparities seen with TB incidence (16). Geographic boundaries do not have to be defined; they can be created through social dynamics where communities may be determined by factors such as poverty, race. A previous report demonstrates that policy implementation is delicate in regards to geography and size (16). This report is consistent with our findings that SES factors which influence the incidence rate of TB are not uniform everywhere. Based on the data we collected, we propose that preventable diseases like TB may be better controlled if health systems dialed in on the smaller communities and their needs and the factors that may be affecting them rather than focusing on counties and the country. The only way we believe to eradicate diseases that are easily preventable like TB, there needs to be a more personalized approach to developing public policies, especially in regard to health. Table 4 shows how analyzing a large area may be misleading if communities are not taken into account to at least the zip code. In table 4 there is no correlation with TB incidence and the three investigated SES factors. This was surprising until we went further into our
Table 1. Pearson's product-moment correlation & Spearman's rank correlation results between the rate of TB per 100,000 persons and three socioeconomic factors: poverty rate, average median income and percentage of the population who possess health insurance between 18 and 64 years of age in Bronx, NY.
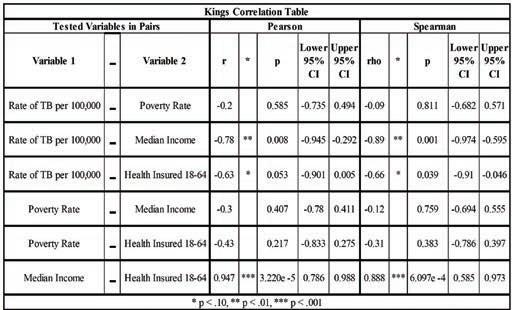
Table 2. Pearson's product-moment correlation & Spearman's rank correlation results between the rate of TB per 100,000 persons and three socioeconomic factors: poverty rate, average median income and percentage of the population who possess health insurance between 18 and 64 years of age in Kings, NY.
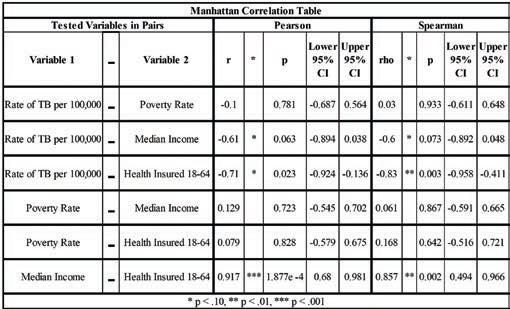
Table 3. Pearson's product-moment correlation & Spearman's rank correlation results between the rate of TB per 100,000 persons and three socioeconomic factors: poverty rate, average median income and percentage of the population who possess health insurance between 18 and 64 years of age in Manhattan, NY. Table 4. Pearson's product-moment correlation & Spearman's rank correlation results between the rate of TB per 100,000 persons and three socioeconomic factors: poverty rate, average median income and percentage of the population who possess health insurance between 18 and 64 years of age in New York City.
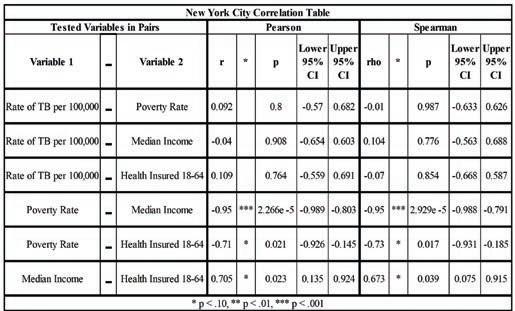
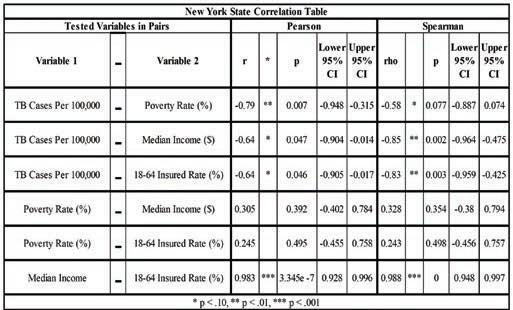
Table 5. Pearson's product-moment correlation & Spearman's rank correlation results between the rate of TB per 100,000 persons and three socioeconomic factors: poverty rate, average median income and percentage of the population who possess health insurance between 18 and 64 years of age in New York state.
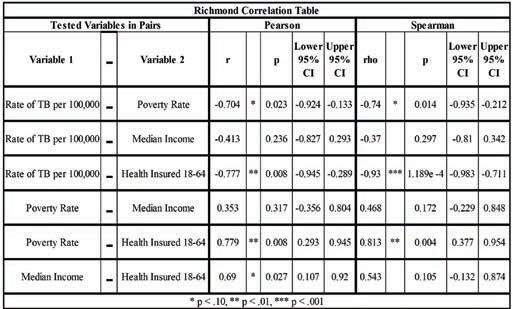
Table 6. Pearson's product-moment correlation & Spearman's rank correlation results between the rate of TB per 100,000 persons and three socioeconomic factors: poverty rate, average median income and percentage of the population who possess health insurance between 18 and 64 years of age in Richmond, NY.
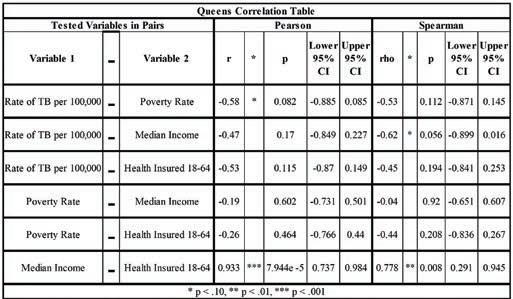
Table 7. Pearson's product-moment correlation & Spearman's rank correlation results between the rate of TB per 100,000 persons and three socioeconomic factors: poverty rate, average median income and percentage of the population who possess health insurance between 18 and 64 years of age in Queens, NY. Figure 1. Depicts a scatterplot with a trend line to show the association of the rate of TB per 100,000 persons with the poverty rate in Bronx, NY.
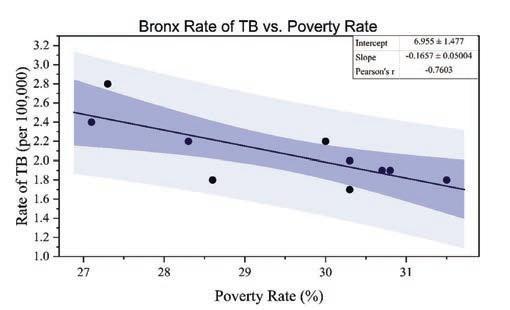

Figure 2. Depicts scatterplots with a trend line to show the association of the rate of TB per 100,000 persons with, and percentage of the population who possess health insurance from 18 to 64 years of age (left) and average median income (right) Kings, NY.

Figure 3. Depicts scatterplots with a trend line to show the association of the rate of TB per 100,000 persons, average median income (left), and percentage of the population who possess health insurance from 18 to 64 years of age (right) Manhattan, NY.

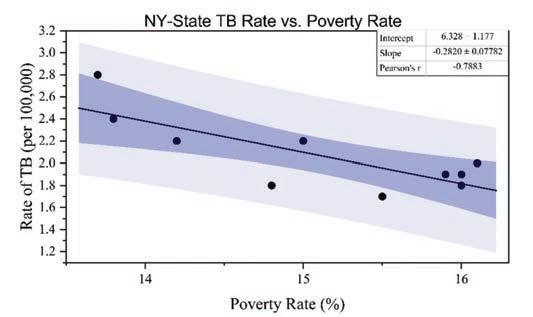
Figure 4. Depicts scatterplots with a trend line to show the association of the rate of TB per 100,000 persons with the, and percentage of the population who possess health insurance from 18 to 64 years of age (top left), average median income (top right), poverty rate (bottom), New York State.
Figure 5. Depicts scatterplots with a trend line to show the association of the rate of TB per 100,000 persons with the poverty rate (left), and percentage of the population who possess health insurance from 18 to 64 years of age (right) Richmond, NY.

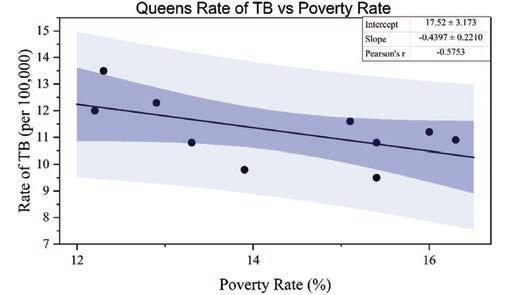
Figure 6. Depicts scatterplots with a trend line to show the association of the rate of TB per 100,000 persons with the poverty rate, Queens, NY.
investigation of New York City and analyzed the five boroughs of New York City. We found that all of them had at least one SES factor had a statistically significant correlation in regard to TB incidence. Of the seven locations of New York, we looked at four places, Bronx, Richmond, and Queens boroughs, and New York State excluding New York City, interestingly had a statistically negative correlation of TB incidence and poverty rate. These findings were the opposite of what we were expecting and what is found in the literature. This decline in TB found with higher poverty rates may be explained by New York City increasing the percentage of individuals who complete their TB treatment from 60% to greater than 90% in 2012 (18). This increase in TB treatment completion aided the city to bring the amount of TB outbreaks in hospitals close to zero (17). Three of the locations — Kings and Manhattan boroughs, and New York State — had a statistically significant negative correlation of TB incidence and average adjusted median income. This aligns with our expectations and with what is typically found in literature, where higher income usually is an indicator of a lower incidence of preventable diseases. The surprising part of the median income data concerning TB incidence is that the boroughs of Bronx, Richmond, and Queens all had a significant correlation with TB incidence and poverty did not correlate with TB incidence median income and vice versa. More research would have to be done to see what influences these differences. Each location has somewhat similar poverty rates except for the Bronx, New York, with an average poverty rate of about 28% (9). Kings, Manhattan, Richmond, and New York State had significant negative correlations with TB incidence and Health Insurance. Manhattan, Kings, and New York State all had a significant correlation with median income. We analyzed all seven locations showed a significant positive correlation with median income and the percentage of the adult population who hold health insurance 18 to 64 years of age. Together with our data pointing that median income and the percentage of adults who have health insurance, this data infer that median income influences rates of health insurance, and health insurance rates may influence TB incidence rates. This study has several limitations, including the possibility of TB cases being underreported due to individuals who may be asymptomatic. The possibility regarding the underrepresentation of TB patients may also be because of individuals not realizing their symptoms and neglecting to seek help, specifically referred to as lack of contact investigation and case management. The lack of contact investigation may not have allowed for tracing the individuals exposed to TB, deterring the authenticity of reported TB cases. Because the study focused on New York State as one entity and New York City, there is a chance the data collected is not representative of the entire sample collected since the additional counties of the state were not individually investigated thus, limiting the generalizability of our findings. Though statistically significant results were found in the study, the data tested three total socioeconomic factors. Other socioeconomic factors will need to be investigated to fully understand how socioeconomic status contributes to TB rates and more pathologies. The parametric tests used may have excluded non-linear relationships, so there is a possibility that meaningful non-linear relationships may be present. Another limitation was individual-level data was not available, so we had to use generalized statistics from the NY CHRIS database and the U.S. Census, which may not fully represent the population. This research supplies insight into the decline of TB infection rates in New York, especially New York City. The data could help predict the declines of TB in other cities or even help cities to tailor better preventive measures to reduce TB infection rates. Our data further can be used as a basis for future research to look at specific SES factors that may contribute to higher rates of preventable diseases so public health workers can better hone in on a more personalized approach for a geographical area, thus, lowering the financial burden of the disproportionate disparities of health disease among low SES populations.
Conclusion
This study investigated three socioeconomic factors-poverty, individuals insured between ages 18 and 65, and average median income-and their association with TB infection rates per 100,000. Our results indicate that three SES factors contributed to the decline of TB infection rates within the state of New York; however, socioeconomic factors that influence the incidence rate of TB were very sensitive to location. This study contributes to our understanding of what causes the decline of TB infections, which may influence governments to implement specific measures to help reduce TB or other diseases.
Acknowledgments
We would like to thank our instructors, Brian J. Piper, PhD, MS, and Elizabeth Kuchinski, MPH, whose knowledge and experience were critical in developing the research questions and methodology. Your constructive input pushed us to improve our thought and raise the quality of our work.
Disclosures
We have no financial relationship with a commercial entity.
References
1. World Health Organization. Global tuberculosis report 2019. Genève, Switzerland: World Health Organization; 2019. 2. Tuberculosis (TB) Fact Sheets [Internet]. Center for disease control and prevention: Tuberculosis (TB) fact sheets. 2011 [cited 2021 Jan 15]. Available from: https://www.cdc.gov/ tb/publications/factsheets/general/tb.htm 3. Schwartz NG, Price SF, Pratt RH, Langer AJ. Tuberculosis - United States, 2019. MMWR Morb Mortal Wkly Rep. 2020;69(11):286–9. 4. Ethnic and racial minorities & socioeconomic status [Internet]. American Psychological Association. 2017 [cited 2021 Jan 26]. Available from: https://www.apa.org/pi/ses/ resources/publications/minorities 5. 2018 state and city TB report [Internet]. Centers for
Disease Control and Prevention. 2019 [cited 2021 Jan 15]. Available from: https://www.cdc.gov/tb/statistics/ indicators/2018/StateCity-TBReport.htm 6. World Health Organization. Equity social determinants and public health programmes. Genève, Switzerland: World
Health Organization; 2010. 7. Reichman LB, Hershfield ES. Tuberculosis: A comprehensive international approach, second edition. 2nd ed. New York, NY: Marcel Dekker; 2000. 8. New York City Department of Health and Mental Hygiene
Bureau of Tuberculosis Control. Tuberculosis: Historical reports - NYC health [Internet]. NYC Health. 2020 [cited 2021 Jan 14]. Available from: https://www1.nyc.gov/site/ doh/health/health-topics/tuberculosis-historical-reports. page 9. New York State Department of Health. New York State community health indicator reports (CHIRS) [Internet].
New York State Department of Health. 2019 [cited 2021 Jan 14]. Available from: https://www.health.ny.gov/ statistics/chac/indicators/index.htm 10. US Census Bureau. Poverty status in the past 12 months [Internet]. 2007-2016 American Community Survey 1-year estimates. 2016 [cited 2021 Jan 23]. Available from: https://data.census.gov/cedsci/table?q=new%20 york%20city&t=Poverty&tid=ACSST1Y2016.
S1701&hidePreview=false 11. New York Department of Health and Mental Hygiene.
Health care access and use [Internet]. EpiQuery -
Community Health Survey. 2007 [cited 2021 Jan 14].
Available from: https://a816-health.nyc.gov/hdi/epiquery /visualizations?PageType =ts&PopulationSource=CHS&
Topic=2&Subtopic=15 12. The Big Picture: Private and public health insurance markets in new york [Internet]. NY State of Health. United
Hospital Fund; 2012 [cited 2021 May 11]. Available from: https://info.nystateofhealth.ny.gov/resource/big-pictureprivate-and-public-health-insurance-markets-new-york 13. Stewart RJ, Tsang CA, Pratt RH, Price SF, Langer AJ. Tuberculosis — United States, 2017. MMWR Morb Mortal
Wkly Rep. 2018 Mar 23;67(11):317–23. 14. Beavers SF, Pascopella L, Davidow AL, Mangan JM, Hirsch-
Moverman YR, Golub JE, et al. Tuberculosis mortality in the
United States: Epidemiology and prevention opportunities.
Ann Am Thorac Soc. 2018 Jun;15(6):683–92. 15. Dawson P, Perri BR, Ahuja SD. High tuberculosis strain diversity among New York City public housing residents.
Am J Public Health. 2016 Mar;106(3):563–8. 16. Institute of Medicine. Guidance for the national healthcare disparities report [Internet]. Washington, DC: The National
Academies Press; 2002. Available from: https://www.nap. edu/catalog/10512/guidance-for-the-national-healthcaredisparities-report 17. Macaraig M, Burzynski J, Varma JK. Tuberculosis control in New York City — A changing landscape.
N Engl J Med. 2014 Jun 19;370(25):2362–5.


