
17 minute read
The Relationship between Food Deserts and the Prevalence of Type 2 Diabetes in Communities in Southeastern Pennsylvania
Stephen O. Adeniyi1*, Adewale O. Awoyemi1*, Daniel O. Ayodele1*, Cheryl A. Frazier1*, Yvette M. Johnson1* , Cathie-Allegra Z. Nkabyo1*, and Theodore J. Tucker1*
¹Geisinger Commonwealth School of Medicine, Scranton, PA 18509 *Master of Biomedical Sciences Program Correspondence: cnkabyo@som.geisinger.edu
Abstract
Limited access to healthy food has been linked to an increase in diabetes, specifically Type 2 diabetes. Food deserts contribute to the limited access of healthy foods due to their lack of fresh produce and other healthy food options. We evaluated the relationship between food deserts and the rates of diabetes in southeastern Pennsylvania using the Community Health Database Analysis Tool from the Public Health Management Corporation (PHMC). For the purpose and focus of this research, the measured variables included prevalence of food deserts, socioeconomic status, and population size in the Southeastern Pennsylvania (SEPA) online data analysis tool. The PHMC data from 2018 included a sample size of 7,501 household interviews in the 5-county area of southeastern Pennsylvania. A higher prevalence of diabetes was expected in these communities due to limited access to healthy foods. Results revealed that non-poor communities in Bucks, Chester, Delaware, Montgomery, and Philadelphia counties have the highest prevalence of Type 2 diabetes, despite having increased access to supermarkets. Therefore, access to supermarkets and grocery stores had no statistically significant relation with the prevalence of diabetes. Other factors such as access to health care and education were not considered in this study. More research on this topic is needed to gain greater insight into diabetes and food desert relationships. Results from this study can be used to increase awareness and inform local government officials about the relationship between food deserts and the prevalence of diabetes.
Introduction
Despite an abundance of supermarket retailers like ShopRite, Walmart, and Kroger in the United States (U.S.), lack of access to fresh and healthy foods in certain communities is a pressing issue. These communities are referred to as “food deserts” and defined by public health officials as “geographic areas that lack sufficient access to grocery stores…” (1). According to the United States Department of Agriculture (USDA) (2), 6,500 food deserts were identified by correlating data from the 2000 U.S. census and data of supermarket and grocery locations in 2006 (3). From a public health standpoint, it is important to identify and improve communities that still lack access to fresh produce to prevent diseases associated with unhealthy diets. Food deserts tend to be observed in low-income communities that experience racial and economic disparities (3). Currently, 32 million adults living in the U.S. have been diagnosed with diabetes (4). As defined by the CDC, social determinants of health (SDOH) are conditions in the places where people live, learn, work, and play that affect a wide range of health and quality of life risks and outcomes. Based on the CDC SDOH guidelines, residents of Philadelphia County are 92.04% more likely to be diagnosed with diabetes, compared to New York, Los Angeles, and Cook (Illinois) counties — 63.93%, 76.82%, and 80.20%, respectively (4). In comparison to other counties in the U.S., Los Angeles County is 76.82% more vulnerable, New York County is 63.93% more vulnerable, and Cook County (Illinois) is 80.20% more vulnerable (4). Additionally, in Philadelphia County 11.6% of the population has been diagnosed with diabetes compared to 9.1% in Los Angeles County, 6% in New York County, and 9% in Cook County (4). A diagnosis of diabetes may lead to other chronic diseases and conditions like kidney disease, heart disease, vision loss, and amputation (6). Diabetes is the sixth leading cause of death in Philadelphia and affects those living in poverty twice as much as those not living in poverty (5). Other risk factors of diabetes are obesity, smoking, physical inactivity, high blood pressure and high cholesterol (5). Food deserts have been shown to be a significant risk factor associated with diabetes, along with other SDOH having an impact such as low income, unstable housing, substandard education, and unhealthy environmental conditions. Low-income residents in food deserts face a variety of disadvantages, reflective of the inadequacy of the built environment. These include lower annual median household income, unequal access to educational and economic opportunities, and housing instability. Thus, SDOH needs to be considered when striving toward improving diabetes health outcomes. This is in part because the existence and cohesion to an adequate diet are the cornerstones to diabetes prevention and management (7). Previous research has demonstrated that there is no monotonic relationship between deficient food environments and diabetes. Alternatively, areas of limited access, food deserts, as well as areas of high concentration of health-harming food outlets are both associated with Type 2 diabetes (8). Understanding food deserts and their effect on the health of lower income individuals is vital when attempting to comprehend why certain populations may encounter diabetes more frequently. People who live in food-insecure households are two to three times more likely to have diabetes than those who live in food-secure households (9). This may be related to the discrepancy in the number of resources such as safe housing and local food markets in low-income versus affluent neighborhoods to sustain a healthy lifestyle. In southeastern Pennsylvania lower-income areas, there are more likely to be an abundance of fast-food restaurants and a scarcity of grocery stores (10). Unfortunately, there are many gaps in research on food deserts. When discussing research methods, investigators have mostly
focused on cross-sectional data which compares people living in different neighborhoods (11). Cross-sectional study design is essential in learning about the characteristics and trends of food deserts at a particular point in time further supporting the research claims. It can also be descriptive and explain disease burdens in a particular community. However, there is also a need for longitudinal evidence. Longitudinal evidence can relate changes in healthy food availability to changes in diet over time and uncover predictors of certain diseases (11). One example of this type of study suggested that people who lived in neighborhoods with higher healthy food availability had a 45% reduced incidence of developing diabetes (11). Although crosssectional research is improving, there are still difficulties in interpreting causal links. These links include determining which aspects of the local food environment are most relevant to health; how to measure the scale at which changes to the local food environment are most effective; and the critical periods in which to expect any effects to occur (11). In addition to advancement in research methods concerning food deserts, there are solutions being developed to decrease the prevalence of food deserts (12). For example, studies have shown that local networking between farmers and food producers within a few hundred miles’ radius of the city has contributed to the presence of healthy food. This in turn allows healthy food to arrive much quicker, from a shorter distance, at a lower price (12). The previously stated solutions are good, yet still inaccessible (for geographic, financial, and social reasons) to low-income residents in food deserts. Alongside the local farmers' network solution, another solution is a coupon incentive initiative. This initiative looks to grant customers $2 coupons for every dollar spent which can only be redeemed by the purchase of fresh fruits and vegetables. This helps customers save money on groceries and aims to bring new customers to fresh food markets in low-income communities to increase fruit and vegetable consumption (10). CSAs (community supported agriculture); farmer's market collaboration with health systems, and Geisinger’s Fresh Food Farmacy are also feasible solutions to address healthy food accessibility. Additionally, one of the most effective solutions is nutrition education. These programs are essential for the eradication of food deserts and improvement of impoverished areas (12). Knowledge is one of the more efficient solutions because it makes citizens more conscious of their diet, provides them with the tools to make informed decisions, and in turn may lower the prevalence of diabetes. Another significant part of the solution are the organizations that help make quality, healthy foods accessible. These factors will start to shift the dynamics towards a healthier path. Our research aims to identify the impact of food deserts on the prevalence of diabetes in low-income communities of southeastern Pennsylvania. This study examined information on the relationship between food deserts and the prevalence of diabetes using data from the Public Health Management Corporation (PHMC) Community Health Database Household Health Survey and the SEPA Online Data Analysis Tool. Our analysis offers new insight and solutions to eliminate food deserts in the U.S.
Methods
Participants The population included adult Pennsylvania residents with and without diabetes as well as those with or without low access to grocery stores. The PHMC houses data from 2018 and reports a sample size of 7,501 household interviews in the 5-county area of southeastern Pennsylvania. The SEPA Online Data Analysis Tool permits acquisition of data about a specific geographic area and indicators for data analysis. The data set was coded for: time (data from 2018), age group (adults 18–60), health status (diabetes), and poverty status. Poverty level is defined as a measure calculated based on family size and household income below 100% of the federal poverty level (13). Populations used to calculate heat maps were extracted from the United States Census Bureau released in the American Community Survey in December of 2020.
Data collection
We used the Community Health Data Base Analysis Tool from the Public Health Management Corporation (PHMC) as the secondary data source. This database includes counties of the southeastern regions of Pennsylvania, including Philadelphia, Bucks, Chester, Delaware, and Montgomery. The database consists of household health surveys conducted every 2 to 3 years on adults dating back to 2000. Data from 2018 was used in our analysis. We used a pre-existing public data set from the SEPA Online Data Analysis Tool which excludes any identifiable personal information of the participants within the studied areas of Pennsylvania. This study was reviewed by the Geisinger Commonwealth School of Medicine Institutional Review Board and deemed to be non-human subject research.
Data analysis plan In this study, the descriptive analysis consists of analyzing 2018 data found in the SEPA Online Data Analysis Tool. This data is compiled by PHMC, which collects data from Pennsylvania residents. We used the prevalence of diabetes as the measured variable for this study. We utilized data from PHMC, which allowed us to examine the relationship between socioeconomic status and the prevalence of diabetes in southeastern Pennsylvania. We identified the prevalence of food deserts in each of the selected using data from the Food Access Research Atlas created by the USDA. Thus, a comparative T-test utilized variables based on the low access to supermarkets within 0.5 and 10 miles and 1 and 20 miles in Bucks, Chester, Delaware, Montgomery, and Philadelphia counties. Heat maps, created through Excel, highlighted the correlation between the prevalence of diabetes, food deserts, and socioeconomic status within those counties. The analyses compared the prevalence of diabetes in poor communities versus non-poor communities in southeastern Pennsylvania which was taken from the SEPA Online Analysis Tool. When comparing the data regarding the low access to supermarkets, an assessment of whether a supermarket was 0.5 miles and 10 miles or 1 and 20 miles away through the USDA Food Access Research Atlas was used. Five counties were evaluated: Philadelphia, Montgomery, Bucks, Chester, and Delaware.
Results
Contrary to our initial hypothesis, our data in Figure 1 depicts that non-poor communities in Bucks, Chester, Delaware, Montgomery, and Philadelphia counties all had a higher prevalence of diabetes compared to poor communities. Certain zip codes exhibited low access to supermarkets, meaning that they are considered food deserts. There are 31 zip codes in Philadelphia County that have low access to supermarkets. As shown in Figure 2, 68% of Philadelphia County has low access to supermarkets, making it the county with the highest percentage. There are 11 zip codes in Montgomery County that are considered to have low access to supermarkets making up 20% of the population. In Bucks County, there are 8 zip codes that are considered to have low access to supermarkets making up 17% of the population (Figure 2). In Chester County, the 7 zip codes that are considered low access make up 22% of the population. In Delaware County, 36% of the population had low access to supermarkets which consists of 14 zip codes. Heat maps were created to depict the prevalence of diabetes within each county’s zip codes (Figures 3A-D, 4A-D, 5A-D, 6A-D, and 7A-D) and t-tests were created to represent the prevalence of low access in each county (Figures 3E and F, 4E and F, 5E and F, 6E and F, and 7E and F).
using the SEPA Online Data Analysis tool, food deserts are very prevalent in southeastern Pennsylvania. Our analysis indicated that in Bucks, Chester, Delaware, Montgomery, and Philadelphia County low-income areas are impacted by disproportionate prevalence of Type 2 diabetes. Diabetes is still present in lowincome areas, but the prevalence is not driven by income alone. Diabetes prevalence can be influenced by several different factors such as income status, location of supermarkets, and fresh produce markets. For example, Bucks County has a very high prevalence of diabetes in non-poor communities while the poor communities have a much lower prevalence, suggesting income is not a driver for diabetes in that county. Figure 1. Prevalence of diabetes in poor and non-poor communities. A table depicting the prevalence of diabetes in poor and non-poor communities. Figure 2. Low access to supermarkets. A table depicting the percentage of zip codes in each county that had low access to supermarkets. Figure 3A–F. Prevalence of diabetes and low access to supermarkets in Bucks County. Heat maps created to depict the prevalence of diabetes and its correlation to socioeconomic status in Bucks County, Pennsylvania. T-test depicting low access to supermarkets in Bucks County, Pennsylvania.
Discussion
According to the USDA and Economic Research Service (ERS), about 23.5 million people live in food deserts, and nearly half of them are also low-income (2). According to the data collected


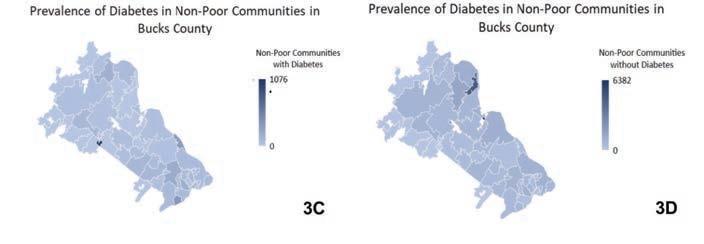
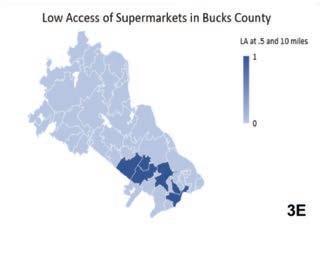
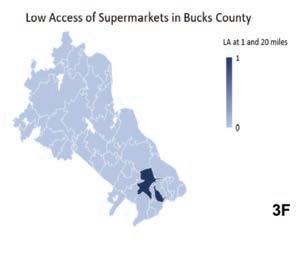
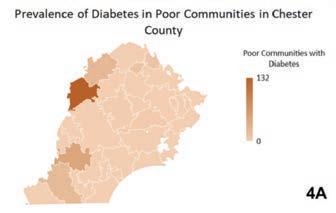
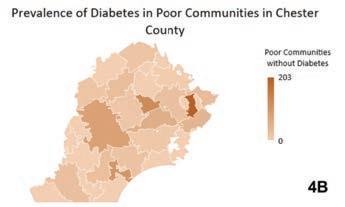

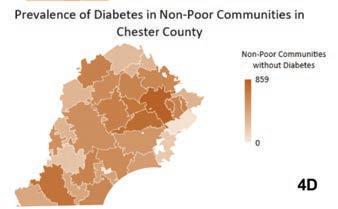
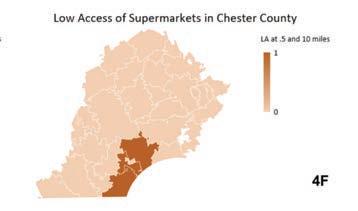
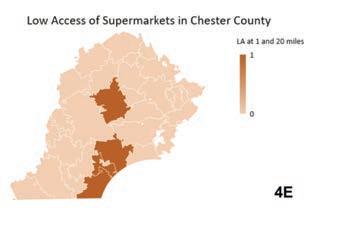
Figure 4A–F. Prevalence of diabetes and low access to supermarkets in Chester County. Heat maps created to depict the prevalence of diabetes and its correlation to socioeconomic status in Chester County, Pennsylvania. T-test depicting low access to supermarkets in Chester County, Pennsylvania.
Figure 5A–F. Prevalence of diabetes and low access to supermarkets in Delaware County. Heat maps created to depict the prevalence of diabetes and its correlation to socioeconomic status in Delaware County, Pennsylvania. T-test depicting low access to supermarkets in Delaware County, Pennsylvania.
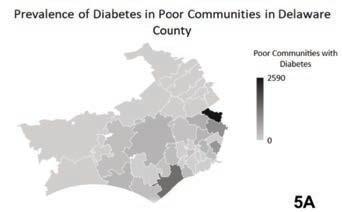
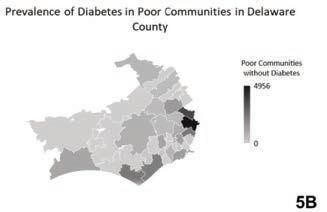
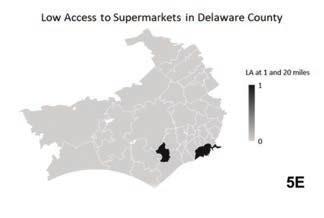
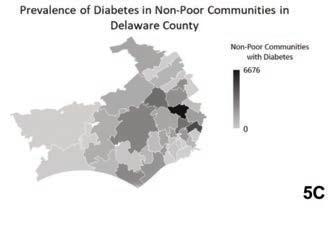
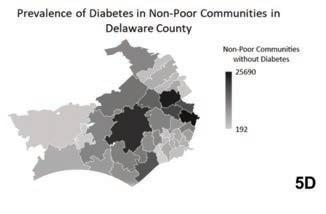
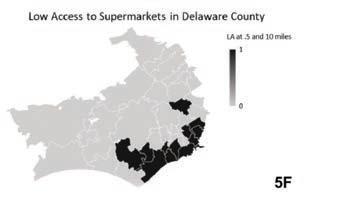

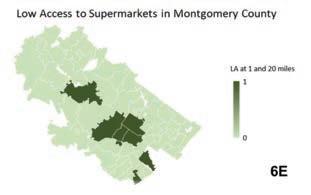
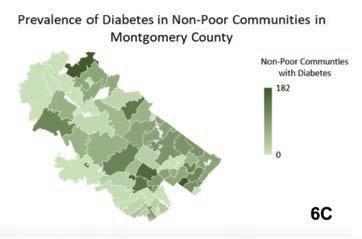
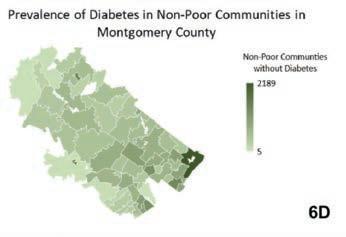

Figure 6A–F. Prevalence of diabetes and low access to supermarkets in Montgomery County. Heat maps created to depict the prevalence of diabetes and its correlation to socioeconomic status in Montgomery County, Pennsylvania. T-test depicting low access to supermarkets in Montgomery County, Pennsylvania.
Figure 7A–F. Prevalence of diabetes and low access to supermarkets in Philadelphia County. Heat maps created to depict the prevalence of diabetes and its correlation to socioeconomic status in Philadelphia County, Pennsylvania. T-test depicting low access to supermarkets in Philadelphia County, Pennsylvania.

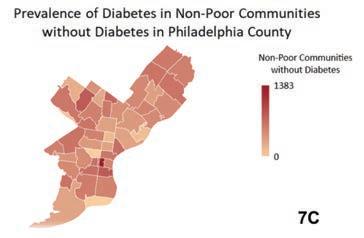

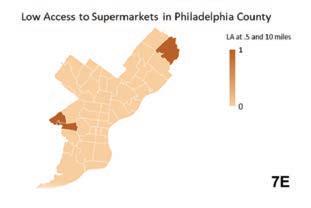
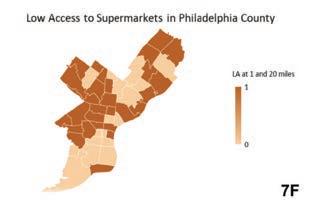
Another statistic stated by the USDA ERS is that approximately 2.3 million people (2.2% of all US households) live in low-income, rural areas that are more than 10 miles from a supermarket (3). The data collected and analyzed indicated that in Philadelphia County, a large percentage of individuals with diabetes live in zip codes where there is low access to supermarkets. Contrary to the original prediction made, the data collected suggests that the economic status of individuals within a particular zip code does not influence the prevalence of diabetes within that area. Instead, the immediate access to major grocery stores and supermarkets shows a stronger relationship of the prevalence of diabetes in certain zip codes within Philadelphia and surrounding counties. In the Chester County heat maps shown in Figure 4A-D, the 19010 zip code was excluded due to no available data found on SEPA. Additionally, SEPA did not differentiate between Type 1 and Type 2 diabetes in their database; however, according to the CDC over 90% of cases of diabetes are Type 2 (5). Furthermore, the values used to calculate the heat maps and t-tests were rounded to whole numbers instead of using decimals.
Conclusion
The purpose of this study was to examine the relationship between residents living in low-income communities and the prevalence of diabetes in Pennsylvania. Although we hypothesized that non-poor communities would be less likely to have diabetes than poor communities, using geographic imaging software, we observed that a higher prevalence of diabetes occurred in higher income communities of Pennsylvania, particularly the southeastern region. After further investigation of the southeastern region of Pennsylvania, encompassing Bucks, Chester, Delaware, Montgomery, and Philadelphia County, our hypothesis was not supported. We cannot exclusively state that the prevalence of diabetes is attributed to income status, location of supermarkets, and fresh produce markets. This southeastern region has 71 zip codes flagged as having low access to supermarkets within 0.5 and 20 miles. The SDOH provides insight on barriers hindering living a healthy lifestyle. The prevalence of diabetes in areas where one’s health outcomes are negatively impacted at the level of economic stability, as well as adequate neighborhood and/ or built environment, suggests additional research is required to characterize the relationship between food deserts and diabetes. From a public health standpoint, more strategies are needed to decrease the prevalence of diabetes regardless of income status and geographical location. We suggest that a longitudinal cohort study be completed to better understand the relationship of Type 2 diabetes, food deserts, and income status.
Disclosures
The authors of this investigation do not have any conflicts of interest.
Acknowledgments
This group of researchers would like to acknowledge the help received from: Brian J. Piper, PhD, MS; Elizabeth Kuchinski MPH, BS; Tenzing K. Dolma; Ijeoma C. Ejiogu; Alex I. Greenstone; Timothy H. Lozier; Mariah W. Panoussi; Alivia L. Roberts; Megha K. Sarada; and Sonia Lobo, PhD.
References
1. Karpyn AE, Riser D, Tracy T, Wang R, Shen YE. The changing landscape of food deserts. UNSCN Nutr. 2019
Summer;44:46–53. 2. Food Access Research Atlas [Internet]. Usda.gov. [cited 2021 Aug 5]. Available from: https://www.ers.usda.gov/ data-products/food-access-research-atlas/ 3. Ver Ploeg Tracy Farrigan PDM. Characteristics and Influential Factors of Food Deserts [Internet]. Washington
DC: USDA; 2012. Available from: https://www.ers.usda. gov/webdocs/publications/45014/30940_err140.pdf 4. Farley T. Health of the City 2019 [Internet]. Department of Public Health City of Philadelphia; 2017. Available from: https://www.phila.gov/media/20191219114641/Health_ of_City_2019-FINAL.pdf 5. Diabetes Data and Statistics [Internet]. Cdc.gov. 2021 [cited 2021 Aug 5]. Available from: https://www.cdc.gov/ diabetes/data/index.html 6. Berkowitz SA, Karter AJ, Corbie-Smith G, Seligman
HK, Ackroyd SA, Barnard LS, et al. Food insecurity, food
“deserts,” and glycemic control in patients with diabetes: A longitudinal analysis. Diabetes Care. 2018;41(6):1188–95. 7. Mezuk B, Li X, Cederin K, Rice K, Sundquist J, Sundquist K.
Beyond access: Characteristics of the food environment and risk of diabetes. Am J Epidemiol. 2016;183(12):1129–37. 8. Gucciardi E, Vahabi M, Norris N, Del Monte JP, Farnum C.
The intersection between food insecurity and diabetes: A review. Curr Nutr Rep. 2014;3(4):324–32. 9. Young CR, Aquilante JL, Solomon S, Colby L, Kawinzi MA,
Uy N, et al. Improving fruit and vegetable consumption among low-income customers at farmers markets: Philly
Food Bucks, Philadelphia, Pennsylvania, 2011. Prev Chronic
Dis. 2013;10(120356):E166. 10. National Research Council (US). Summary. Washington,
D.C., DC: National Academies Press; 2009. 11. Segal A. Food Deserts: A Global Crisis in New York
City [Internet]. New York, NY: Columbia University
Press; November 30 2015. Available from: https:// academiccommons.columbia.edu/doi/10.7916/
D8PG1RCG 12. Welcome to community health data base [Internet]. Phmc. org. [cited 2021 Aug 5]. Available from: http://chdb.phmc. org/


