42 minute read
Developing the Digital Sub-surface Model for Crossrail 2


UNLOCKING THE VALUE OF SPATIAL DATA IN A CONGESTED SUB-TERRANEAN ENVIRONMENT
Developing the Digital Sub-surface Model for Crossrail 2
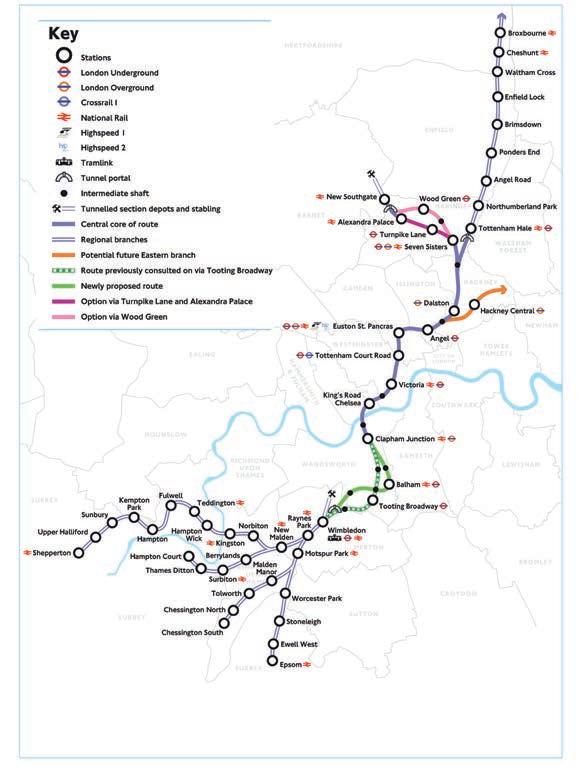
A 3D geological model has helped to save valuable time and millions of pounds in costs for the Crossrail 2 project, a proposed GBP30 billion railway line through 27km-long tunnels beneath London, UK (Figure 1). Developed early in the design process, the model identified geological hazards along the route and informed the tunnel alignment at and between stations. Targeted detailed studies reduced uncertainty in critical areas in advance of project-specific ground investigations. An automated tunnelling obstructions risk assessment incorporated the ground model to estimate building foundation depths for over 30,000 buildings along the route. This was key to reducing the risk of obstructions and informing alignment optioneering in a congested sub-terranean environment.
Figure 1: Map of the proposed Crossrail 2 route (last accessed 25 September 2019). (Image courtesy: Crossrail 2)
Geology in the London Basin is reasonably well understood. The bedrock in London is considered to comprise the Chalk Group beneath Thanet Sand, Lambeth Group, Harwich Formation and London Clay. Overlying Quaternary deposits present along the Crossrail 2 alignment include alluvium, head, brick earth and river terrace deposits. The London Basin is a broad, northeast to southwest-trending syncline with associated smaller folds, formed during the Paleogene (approx. 66-23 Mya) around the same time as the reactivation of deep-seated basement faults, resulting in outcrops of the deeper stratigraphy and fault blocks.
Faulting and other geohazards are increasingly well documented, but continue to create headaches for construction projects in London. For example, flint bands in the Chalk wear down the cutting tools on tunnel boring machines (TBMs), slowing progress due to increased maintenance. This resulted in alignment changes to Crossrail 1 to avoid them. Water-bearing sand channels and hard bands in the Lambeth Group present challenges to non-TBM tunnelling such as cross-passages and station enlargements. Deep drift-filled hollows have caused delays and safety risks to projects including the Thames Water Ring Main (Newman 2009) and Crossrail 1 due to sudden depressions in the London Clay surface.
DEVELOPING THE GROUND MODEL
The 1:50,000 scale 3D model of the London Basin by the British Geological Survey (BGS) was adopted as the initial baseline. Over 1,000 boreholes were collated, together with information from existing publications such as tunnel face excavation records, to review and refine the Project Stratigraphic Model. Digital tools such as ArcGIS, FME and Leapfrog Works facilitated the efficient development, interrogation and dissemination of the approximately 40km2 model and helped to communicate geological uncertainty.
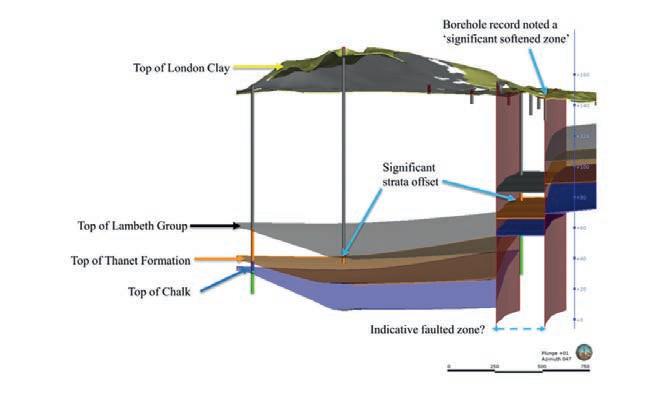
Conceptual geological understanding was key to identifying the best interpretation of the stratigraphy and geohazards, such as the alignment and characteristics of the Wimbledon Fault shown in Figure 2. Archive borehole records reporting softened zones associated with faulting helped to more accurately map the alignment in order to influence the tunnel alignment to reduce the risk of tunnelling through faulted London Clay.
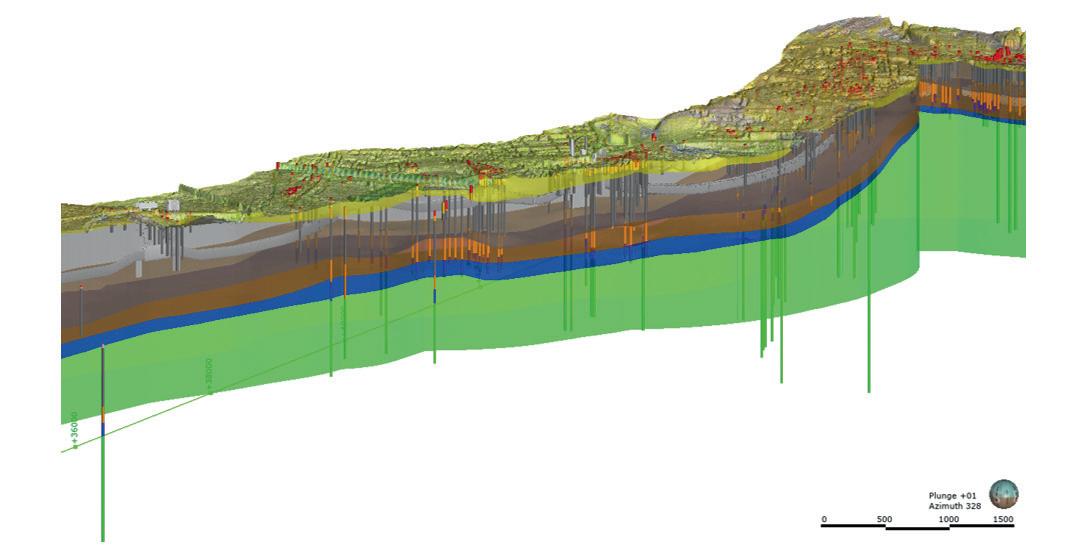
Detailed reviews of existing tunnel face excavation records from the 1930s joined the dots between archive borehole records showing sharp changes in stratigraphy across small distances (Figure 3).
COMMUNICATING MODEL UNCERTAINTY
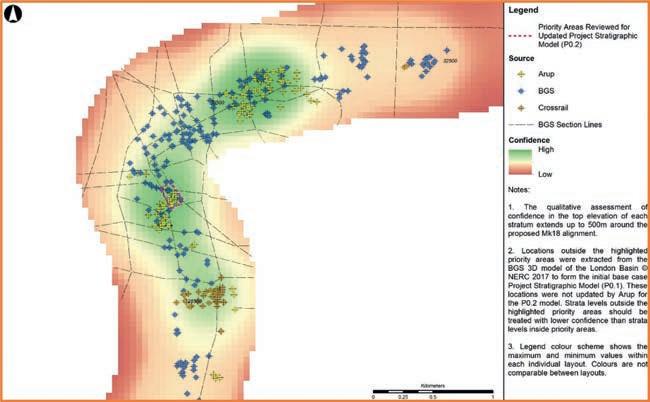
A high-level, qualitative assessment of uncertainty was undertaken to communicate the varying levels of confidence placed in each geological surface displayed in the Project Stratigraphic Model, based on the availability and quality of the data used to test and update the model. The factors considered at this stage were: the density of the control points and section lines created in GSI3D by the BGS; the existing boreholes, with relative confidence levels assigned based on the ‘reliability’ of the original; and the priority areas, where project-specific review was undertaken and the geological surfaces refined. Heat maps (Figure 4) were generated for each geological surface and overlaid with the proposed Crossrail 2 works to identify areas where further targeted review and subsequent ground investigation was required.
INFORMED EARLY DECISION-MAKING
Enabling early alignment optioneering decisions required an early understanding of the key strata and geohazards. An extract from the 1:50,000 scale 3D London Basin
Figure 2: Preliminary model of the Wimbledon faulted zone, which may consist of several faults, to be refined with the findings of further ground investigations.

Figure 3: Incorporation of published longitudinal sections in the Project Stratigraphic Model to compile multiple sources of geological information in three dimensions.
Figure 4: An extract from heat maps produced to inform viewers of the Project Stratigraphic Model of the level of confidence they should place on strata levels at particular locations along the proposed route.
geological model developed by the BGS was adopted as the baseline for the Project Stratigraphic Model, as it represented the best available route-wide understanding of the ground. Following the detailed reviews in critical areas, structural building information modelling (BIM) models were integrated
Automating the production of geological longitudinal sections that were updated as the
Figure 5: Combining structures and geology in 3D.
alignment changed enabled the immediate evaluation of the impact of alignment changes on the construction of these structures. This could then be rapidly fed into the decisionmaking process.
Station excavations through the Lambeth Group to the underlying Thanet Formation were value engineered. For example, proposed station boxes were raised or redesigned, taking account of other criteria driving the alignment, to reduce the difficulties associated with excavations in coarse-grained soil with high groundwater pressures. Cross-passages were located where possible to avoid excavations below the base of the London Clay, where coarse-grained waterbearing horizons and other geohazards inherent with construction in the Lambeth Group would need to be considered. Where this was unavoidable, robust assumptions (e.g. on the stratigraphy) were made and the cost estimate, programme and risks were captured.
TUNNEL OBSTRUCTIONS RISK
Obstructions are the main driver for the alignment design between nodes such as stations and shafts. It has always been a major challenge to undertake assessments on urban tunnel projects of the potential clash risks posed by proposed tunnel alignments to existing assets. This challenge is elevated at the early stages when alignment designs are being explored and information on assets may not be readily available to the designers. The alignment corridor of Crossrail 2 passes beneath more than 33,000 buildings and crosses hundreds of major utility and infrastructure tunnels. It would be time consuming to individually review each building along the tunnel route for each iteration of a proposed alignment and, subsequently, to manually assign a potential clash risk without delaying alignment design decisions needed to inform safeguarding and consultations with the public. Capturing thousands of individual asset information files and making them accessible and readily available to the project team required a data-centric approach. Producing plan and profile drawings to document the alignment and inform future design decisions is traditionally a laborious process. For Crossrail 1, for instance, each update of the plan and profile drawings took up to three months. This ultimately reduces the time available for designers to refine the alignment before a design freeze.
A new approach was therefore needed to perform dynamic obstruction clash risk
Figure 6: The Crossrail 2 Asset Portal is a digital tool for dynamic obstruction clash risk assessments, using algorithms developed to extrude foundation depths based on building height and age, together with the stratigraphy provided by the Project Stratigraphic Model.
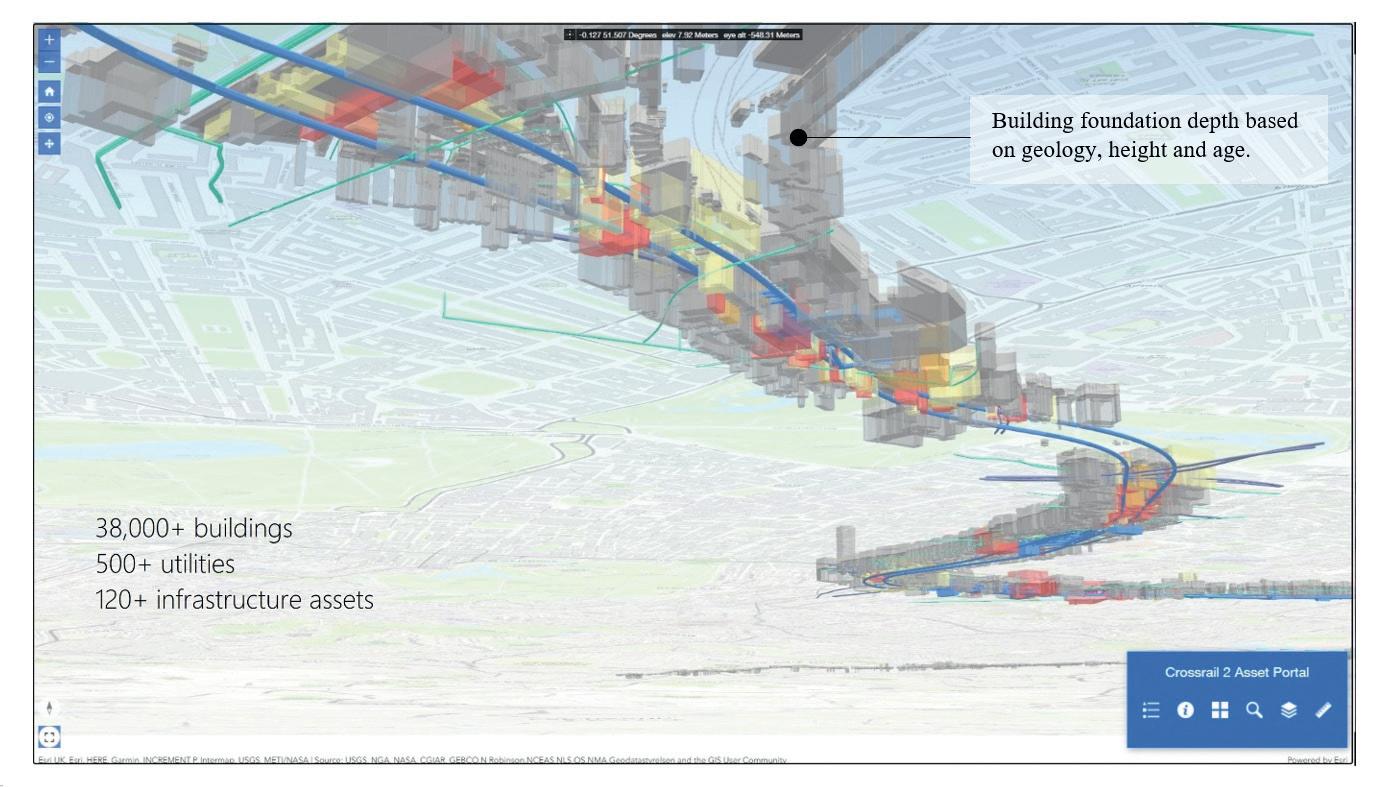
assessments, by capturing asset information, estimate building foundation depths based on algorithms inferring local geological conditions and building data, and to facilitate the automation of drawing production.
ASSET PORTAL
For Crossrail 2, data analysts, engineers, programmers and BIM technicians developed a geospatial tool called the Asset Portal. It is a bespoke multifunctional tool that optimizes the delivery and risk management of this major infrastructure project. The Asset Portal has been designed to be used throughout the project life, from early feasibility studies and optioneering, through detailed design and into the construction period. By providing an efficient automated risk assessment of the more than 33,000 structures which may be affected by the tunnel alignment and all its evolving iterations, it reduces risk and provides a common data environment that all parties can easily access and visualize.
The tool identifies potential clashes between the tunnel and existing underground
infrastructure using an automated algorithm, developed in-house by geotechnical and structural experts, to determine the notional depth of building foundations based on the height, age and Project Stratigraphic Model.
Obstruction risk assessments using the Asset Portal are far more detailed than those normally possible with the budget and resources allocated pre-hybrid bill, thus setting a new standard for de-risking the project at an early stage of the design development.
The Asset Portal was also designed to automate the production of plan and profile drawings over the >30km route. In this subsequent stage of production, asset geometry, geology and relevant data stored in the Asset Portal database is automatically plotted onto drawings with all relevant tags and information. This removes the manual process of creating these drawings, which usually occupies a team of engineers and technicians for months. As well as saving thousands of hours of labour for obstruction risk assessment, time savings of over two months were achieved by automating drawing production using the Asset Portal when compared to drawing production for Crossrail 1.
This approach resulted in more alignment changes being incorporated to improve the alignment design at an earlier stage and focused more effort on exploring improvements to the alignment for an extended period.
CONCLUSION
To inform early decision-making, cost estimates, programme estimates and risk assessments, a 3D geological model was developed to enable data-driven design decisions and obstructions risk assessments taken to an unprecedented level of detail on a major tunnelling project. Adjustments could be made to the tunnel alignment to avoid geohazards and potential obstructions far earlier in the design process than would typically be possible. This facilitated substantial cost savings for the project in excess of
tens of millions of pounds, and substantial programme savings in the order of two years. It also reduced the risk of future changes to the alignment requiring changes to safeguarding, land take and delays due to re-submitting for powers such as development consent orders. A user-friendly geospatial portal for inputting and viewing asset information has been established as a legacy for the project.
3D geological models are now routinely developed across Arup projects, such as on High Speed 2 (HS2), and work with Seequent has been aimed at further improving the integration of Leapfrog into the design analysis workflows.
The future of managing below-ground information and risk on infrastructure projects lies in continually improving access to highquality data and sharing dynamic insights obtained through the lifecycle of the project to enable accurate and predictive data-driven decision-making.
ABOUT THE AUTHORS
Ben Gilson is an associate in the London Geotechnics team and has worked on major linear infrastructure projects, alongside energy, residential and commercial projects since joining Arup in 2010. As lead geotechnical engineer for the Arup Crossrail 2 Tunnel and Systems Design contract, Ben has co-developed the ground model for the project, drawing on his experience of geology in the London Basin, including HS2 Euston Station and various public and private developments, and wider experience on geohazard studies in the UK and abroad.
Charlene Ting is a chartered senior geologist in the London Geotechnics team. Charlene has developed expertise in a range of engineering geological and geotechnical projects in the UK, Middle East and Central Asia. More recently, Charlene has been integrating her understanding of geology and geological processes with her experience in ground investigation to co-develop 3D geological models for major infrastructure projects, including the Crossrail 2 Project Stratigraphic Model. These 3D geological models have played a key role in informing geotechnical design.
Pietro Bologna is an associate director in the London Civil, Structures, Bridges & Tunnels team with over 14 years’ experience in civil and geotechnical engineering through design and construction phases. He has held key technical roles and led design teams on major railway and underground projects in the UK and overseas, including East West Rail, Crossrail 1 and Crossrail 2, the Northern Line Extension and Tideway.
FURTHER READING
https://crossrail2.co.uk/ route/route-map/
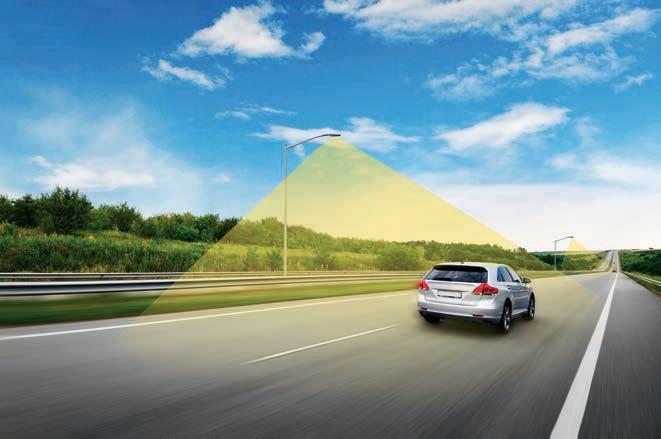
LIDAR FOR INTELLIGENT MOTION ANALYSIS
Smart Cities Benefit from Infrastructure for Autonomous Vehicles
Despite the name, a self-driving car cannot actually drive itself. Most manufacturers of autonomous and driver-assisted cars are keen to use Lidar sensors to provide the necessary guidance during the journey, but this market has been slow to evolve so far. GIM International spoke to Blickfeld, a relatively young Lidar manufacturer that is attracting significant global attention for its innovative and high-tech work on new sensors. It appears that there are many more relevant applications on the horizon beyond the automotive segment, such as monitoring the flow of all kinds of ‘traffic’ both indoors and outdoors.
Autonomous vehicles need to be able to perceive their environment reliably within smart infrastructures. The most commonly used sensors for this task are Lidar sensors, which deliver high-resolution and highly accurate 3D measurements of the surroundings under various weather conditions. So far, such sensors have been too large, technologically complex and expensive to be suitable for broad adoption. Now, however, new technologies are entering the market, plus key components such as detectors are becoming smaller, better and cheaper.
CRUCIAL IMPROVEMENTS
“Devices used to cost a five-digit figure just a few years ago, but a fragile sensor
costing US$50,000 was too expensive to integrate into autonomous driving or smart city applications. Nowadays, the price range starts at the three digits,” says Florian Petit, chief experience officer at Blickfeld, a fastgrowing German-based Lidar software and hardware manufacturer that was founded four years ago. A second crucial development is that the technology no longer requires specialist personnel to operate it. New software platforms have strongly improved the accessibility of Lidar for smart city applications, for example.
Blickfeld has chosen to focus on large market adoption possibilities. That has led not only to more ease of use, but also to an innovative system architecture and the company has already received numerous awards for innovation. Its software enables on-device motion detection through background subtraction; the static background within the point cloud is removed so that the device
transmits only motion information. Dynamic objects, such as people and vehicles, are highlighted along with their movements. Blickfeld is the first in the industry to include on-device processing features in its sensors to reduce the amount of data that is transmitted – mostly by more than 95% – while enabling immediate object detection.
A third key improvement concerns the size of the hardware, as Petit explains: “Our sensors stand out because of their extremely small size. That’s a big plus for integration, as the design aspect is often important –
THE STATIC BACKGROUND WITHIN THE POINT CLOUD IS REMOVED SO THAT THE DEVICE TRANSMITS ONLY MOTION INFORMATION
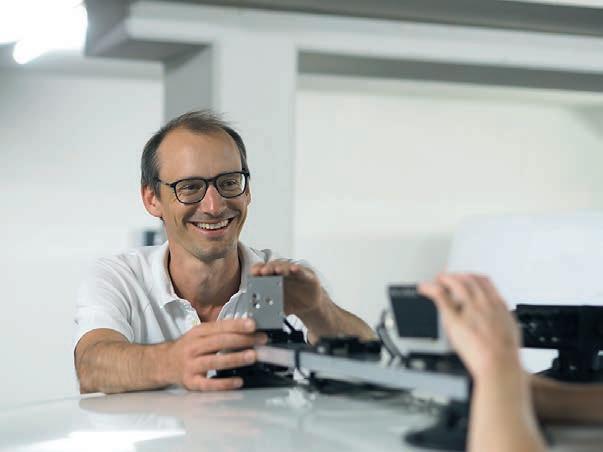
Florian Petit adjusting Lidar sensors on the roof of the Blickfeld car for a test drive in Munich.
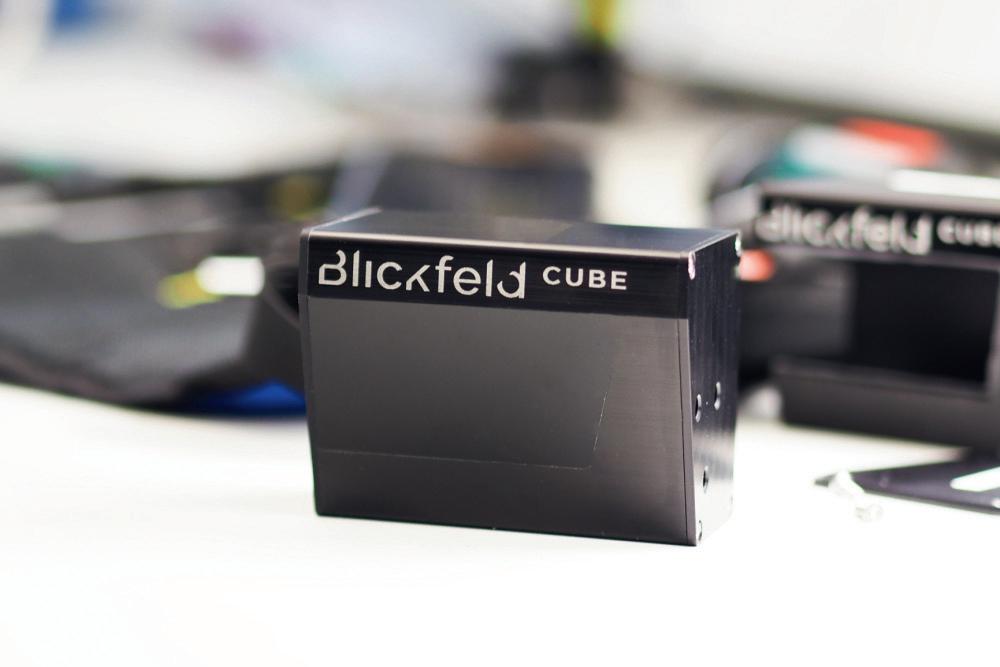
especially for passenger cars.” Blickfeld’s mid-range sensor measures just 5cm3. It can be incorporated into side mirrors, lights and pillars to achieve a 360° panoramic view. It has a field of view of up to 107° and a range of up to 150 metres. Meanwhile, the long-range sensor – designed for use at the front and rear of a vehicle – detects objects at distances of up to 200 metres.
SAFER TESTING IN REAL LIFE
But the widespread adoption of autonomous vehicles depends on more than just technology alone. For example, the European Commission has recently forbidden the activation of autonomous driving assistance (lane keeping, parking, etc.) in new cars in the EU because it is still considered too dangerous. Petit is convinced that autonomous or semi-autonomous driving will become mainstream eventually, but that it will happen gradually rather than overnight: “Autonomous guided vehicles for large warehouses or ports are less complicated. Equipped with sensors, the systems can avoid collisions and transport goods from A to B by automatically determining their position. Likewise, autonomous tractors or other self-driving agricultural equipment can assist farmers in automated precision farming. We even work together with Elbflorace team from TU Dresden that builds racing cars to participate in Formula Student competitions. This year, their car will compete in both disciplines: both with a driver and autonomously. But autonomous cars on public roads are a different matter. There are many issues that still need to be addressed, especially in terms of safety and regulation, but also related to sensor fusion, connectivity and data size. That’s why projects like IN2Lab are so important.” IN2Lab is a three-year project currently running in Ingolstadt, close to the German city of Munich. It is being led by Ingolstadt University of Technology with the aim of developing a safety system for testing automated driving functions in real-life environments. “Only reallife scenarios can cover the outlying cases, i.e. unknown and spontaneous situations,” states Petit. The IN2Lab research partners have integrated additional safety features into the road infrastructure – including roundabouts, crossroads, bus stops, bicycle lanes, traffic lights and parking spaces – in one part of the town. This enables the entire road traffic environment, including the manoeuvres of autonomous vehicles, to be monitored externally using sensors, 5G communication modules and artificial intelligence tools. Blickfeld is responsible for the environment perception sensors integrated into the infrastructure. The sensors collect detailed real-time information, and the detection software analyses the speed and direction of movement of each road user. The Blickfeld sensors are based on MEMS technology, featuring a particularly large aperture, widebeam deflection angles and high optical power.
SMART CITIES
In Petit’s experience, local authorities are keen to use smart city applications to optimize vehicle flows in their cities. Equipping the roadside infrastructure with Lidar sensors will speed up their adoption for traffic monitoring. The information can be used for near-realtime traffic flow control by adjusting traffic lights or road signs taking the movement of all road users into account. Historic analysis can be input for urban planning purposes.
Various municipalities are also preparing parking-space detection and guidance to save drivers the hassle of searching for somewhere to park. Mounted on lamp posts or traffic lights, the sensors monitor parking spaces and the integrated geometric analysis software determines whether each parking space is occupied, as well as its size. This application is aimed at reducing unnecessary driving and therefore pollution in urban areas, although some pessimists fear that making life easier for drivers in cities will actually stimulate traffic growth.
Meanwhile, Blickfeld is developing an algorithm library that includes a variety of pre-processing features in order to enable the on-device data analysis being implemented in many other use cases, such as security. For example, in the case of an intrusion, a sensor first measures the precise dimensions of the detected object (even in low-visibility conditions); the alarm is only triggered if the software identifies a potential (human) trespasser. The public and private sector alike are becoming more interested in better perimeter security – resulting in fewer false alarms and absolute privacy protection –
without the need for more human resources or external hardware.
PEOPLE TRACKING
One market segment in particular is growing rapidly, comments Petit: “In recent years, we have identified very strong demand for ‘people tracking’, and not only during the current pandemic. There are numerous situations in which institutions or organizations need to know how many people are present in a certain area and how they are moving around. Lidar sensors are ideally suited for this; with a large field of view, they usually cover bigger areas than cameras and they collect data independent of lighting conditions. We currently have a project with Frankfurt Airport, the fourth-largest airport in Europe, to track and analyse passenger flows. The sensors help to predict the passenger volume in the security check area so the authorities can take appropriate measures in advance.”
ABOUT BLICKFELD
Before founding Blickfeld in 2017, Dr Florian Petit worked on robotic control as part of his scientific work at the Technical University of Munich, Stanford University, the German Aerospace Center and ETH Zürich. He obtained his PhD in the field of human-machine collaboration. Today, Petit is Blickfeld’s chief experience officer. Blickfeld is based in Munich, Germany, and currently employs just over 100 people. It has received ten innovation awards. Blickfeld introduced industry-first functions for on-device pre-processing of Lidar data: a system-on-chip computing chip set enables the execution of algorithms on the sensors themselves. Blickfeld is expanding its algorithm library with a variety of pre-processing features to be used in applications for smart cities, security, agriculture and industry.
www.blickfeld.com
It is sometimes necessary to know how many people are on the premises and how the flow is moving in other places like museums, event venues, stadiums, pedestrian zones or on railway platforms, and new, smart Lidar applications are emerging for such uses too. Needless to say, what works for flows of people also works for objects, according to Petit. A Lidar device can immediately evaluate 3D-sensed data to provide information on occupancy and fill levels, so volume measurement and level sensing can enable companies to keep track of their inventory and the available space in warehouses, trucks or containers.
ABOUT THE AUTHOR
Frédérique Coumans is contributing editor for GIM International. For more than 25 years, she has been covering all aspects of spatial data infrastructures as editor-in-chief of various magazines on GIS, data mining and the use of GIS in business. She lives near Brussels, Belgium.

THE ROLE OF TECHNOLOGY IN MAKING CITIES INCLUSIVE, SAFE, RESILIENT AND SUSTAINABLE
How 3D Modelling Supports Game-changing Urban Development
Accurate digital representations of cities are game changers in urban development. By enabling virtual modelling and smart simulations, they allow decision-makers to explore, test and assess the measures taken. Hosted on cloud-enabled platforms, these digital twins also facilitate collaboration among stakeholders who can jointly optimize for outcomes that make cities smarter, safer, more livable and more sustainable.
Adapting to climate change and mitigating its impact is essential for governments and local authorities. Such aspects are at the core of major city planning decisions around the world. By analysing 3D models and meshes, leaders can compare conditions within cities over time and simulate possible future scenarios. Having the ability to visualize development plans in 3D allows stakeholders to better understand the consequences of interventions, comprehend interrelationships and recognize planning errors at a pre- investment stage. Professionals can also, for example, calculate the solar potential on rooftops, plan the optimal design of energy grids and critical infrastructure, and check urban vegetation for health. Green spaces in cities lessen the effects of pollution and alleviate the heat island effect which traps heat in urban areas. To preserve these crucial areas, trees can be modelled and monitored for health within 3D digital twins. Ensuring clearance from power lines and acknowledging changes in biomass can help detect diseases early and thus prevent the loss of vegetation. Communities can also use simulations to prepare for natural disasters such as floods and fires. The data and models help in identifying risk areas and planning evacuations.
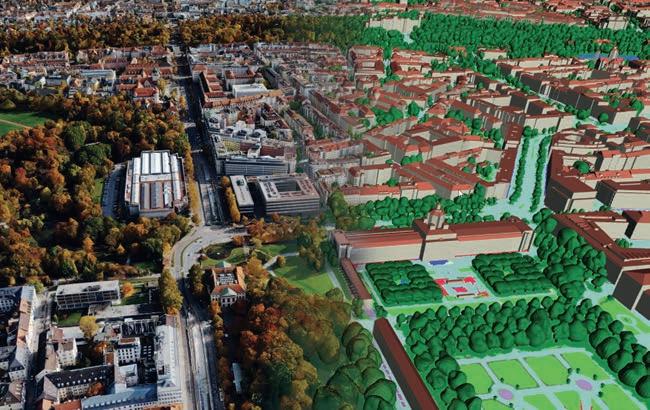
3D city model of Munich and the derived land use model.
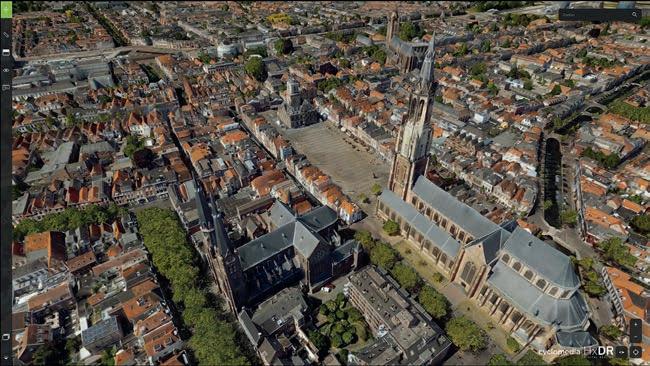
Cyclomedia’s 3DNL is a complete digital twin of the Netherlands, collected with the Leica CityMapper-2 and hosted on HxDR.
CITIES AS AGENTS OF POSITIVE CHANGE
“Cities can be massive agents of positive change, if they are well-planned, built and governed,” the UN’s New Urban Agenda emphasizes. More and more people live in cities, and developing cities responsibly will be a major factor in helping overcome global societal and environmental challenges. To become such agents of change and to achieve the UN’s Sustainable Development Goals (SDGs) – i.e. to make cities inclusive, safe, resilient and sustainable – city administrations must make informed decisions based on accurate data. Combining Lidar and photogrammetry can provide such crucial data to drive sustainable transformation.
Users must be aware that merely imagebased 3D models – even densely matched ones – have significant data gaps. Imaging data is hard to capture in narrow, occluded areas between buildings, shadow areas or under trees and can deliver dissatisfying results for smooth surfaces such as water or untextured roads. Introducing a second data
source significantly improves the accuracy and quality of 3D models and meshes.
One of the big technological advancements in 3D technology is hybrid data, and specifically the simultaneous capture of images and Lidar point clouds. Optical images have high point accuracy in the X/Y plane, while Lidar has high accuracy in the Z component. Lidar adds accuracy to mesh models as it penetrates foliage and detects objects in shadowed areas between buildings, whereas optical data provides clarity for top-surface models where four-colour images are preferred for interpretation. Digital twins based on hybrid data, such as the ones created by the Leica CityMapper-2 hybrid airborne sensor, contain greater detail and consistency. As a result, they are ideal training data sources for standardized, accurate, large-volume analytics, feature extraction and machine learning.
Integrating high-performance workflow software will produce a variety of deliverables from the imagery and Lidar datasets, such as referenced images, orthophotos and colourised point clouds. When teamed with comprehensive geographic information system (GIS) and building information modelling (BIM) data, the real world can be converted into an exact digital replica to facilitate analysis, planning and management.

3D CITY MODELS CREATING SUSTAINABLE CITIES
Due to the range of applications, cities worldwide are already putting 3D city modelling into practice. The city of St. Gallen in Switzerland collaborated with architectural firm GSI Architekten, the World Wildlife Fund (WWF) and Hexagon to create a digital twin of the city. Accurate 3D city models created with the Leica CityMapper-2 airborne mapping system helped urban planners and architects to identify suitable areas for green belts and fresh-air corridors.
Demand for such 3D data and models has risen steadily in recent years. Even entire countries are using digital twins for sustainable development. In the Netherlands, the nation’s 3DNL digital twin is hosted on HxDR, Hexagon’s cloud-based visualization and collaboration platform for geospatial data and services. 3DNL includes features such as mesh measurements, asset management and sun and shadow analysis that enable solar-capacity calculations and high-rise simulations as well as building cross-section analysis.
From protecting the precious green spaces in our cities to improving the safety of the streets we walk through, new technologies on the market can point cities around the world in the right direction to accomplish the SDGs by 2030.
ABOUT THE AUTHOR
John Welter is president of geospatial content solutions at Hexagon’s Geosystems division, based in Washington, DC, USA. With three decades of extensive and demonstrated experience in the information technology and services industry, Welter is an expert on topics including geospatial services, airborne mapping technology, big data concepts and IT strategy.

INTERVIEW WITH ULRICH HERMANSKI, TOPCON POSITIONING GROUP
The Surveyor’s Need to Embrace Data Management
Since graduating in Geomatics Engineering from Germany’s University of Essen in the 1980s, Ulrich Hermanski – chief marketing officer and executive vice president of geopositioning at Topcon – has seen the surveying profession change dramatically. In this interview with GIM International, he sums up the current status of the surveying profession. He reflects on the key advances in the ever-evolving geospatial business, emphasizes the vital role of geodata and discusses the role of surveyors – and of Topcon – in the future.
You graduated in Geomatics Engineering in 1985. How has the profession changed?
There have been a lot of changes since then, but the biggest in terms of geomatics is of course the impact of digital technology. This change hasn’t just impacted the way professionals take measurements and analyse findings; it has actually completely transformed the role of a geomatics engineer. Today, geomatics professionals are far more focused on data handling than in the past – or at least they should be. With masses of data now available on every job site, it’s vital that surveyors are able to translate this data into meaningful information for project teams. Back when I was studying, it was more important to focus on taking accurate measurements and avoiding human errors on site, rather than considering how the information would be digested by other stakeholders on the project. And in 1985, there was far less data available – not to mention there being no laptops, smartphones or tablets. Any computerized calculation was performed by a machine that took up half a room! So when you look at what technology is at a geomatics engineer’s fingertips now versus back then, you can’t even compare the two situations.
The role of the surveyor is still evolving rapidly, calling for a different set of skills. What are the biggest factors in this shift? And what can surveying professionals do to keep pace with the changes?
The most important skill for surveyors to embrace is data management and verification. It’s no longer just the quantity of data collected that is important to a project, but also the quality and how it is presented and communicated. In fact, we’re already seeing job titles change within the industry; what once was a surveying engineer is now a spatial data manager or geodata manager. The speed of data verification
has also increased exponentially in line with project teams’ expectations. Gone are the days of a two-week verification window. Surveyors now are expected to perform verification in real time, on site.
Although surveying has always depended on data, the level of interpretation and management of this data has evolved massively, as surveyors are now learning to leverage gigantic datasets, with cloud-based and software-as-a-service (SaaS) solutions helping to accelerate the process. As data capture solutions have improved, it’s no longer permissible for surveyors to rely on old approaches to data management, and it’s crucial they embrace these technologies in order to deliver value on a project. This is why it’s vital to make understanding data their main focus for the future – it will be all about working with the technology, not competing with it.
Do you believe our industry will be able to attract enough qualified personnel in the years ahead?
The issue around attracting skilled and qualified personnel again comes down to the changing nature of the job roles in our industry. The element of actually capturing data is becoming the smallest part of a surveyor’s role; it’s now all about bringing data into the construction workflow and helping to digitalize the entire process. This opens up possibilities for our industry to attract more tech-focused and IT-oriented people, and if we are able to make the roles attractive to those candidates, it will also help to accelerate a much-needed shift in our sector. One of the best ways we can encourage these individuals to apply is by targeting different universities and courses that are not related to traditional surveying, and showing them the opportunities that exist in geomatics. To put this into perspective, when I was at university in 1985, there were 200 students in my year of study. Now, there are cases of three universities having to join forces to get just 30 people enrolled. The race is on to attract new blood, as we need to ensure we’re all doing everything we can to avoid a skills gap.
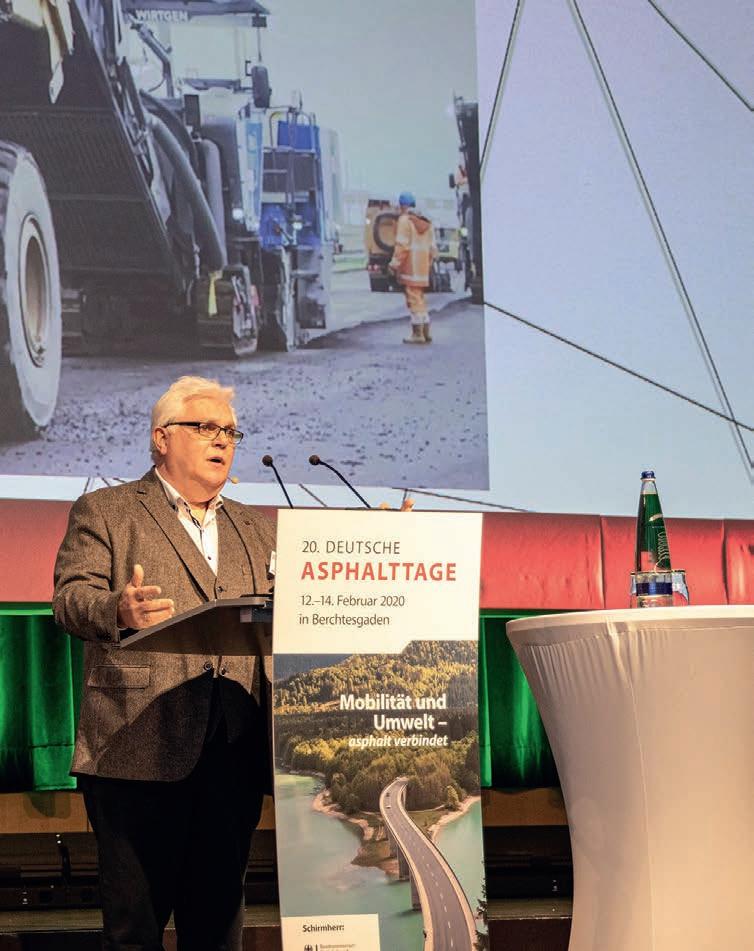
Ulrich Hermanski is a regular keynote speaker at construction industry events, such as this one which took place in Germany shortly before the outbreak of the pandemic.
There is a huge buzz around artificial intelligence (AI) including deep learning and machine learning. Will AI deliver on its promise? And how is Topcon anticipating the future impact of these technologies?
AI is not really affecting our traditional geomatics and surveying business, but it is having a huge impact on our positioning and machine control offerings. AI brings some really exciting opportunities for our product range, from creating 3D models to full-blown automation of machinery. When it comes to advancing AI across construction and positioning, the capability for the machinery to collect data is key. Therefore, one huge benefit of AI implementation comes from a mixture of intelligent software and high-level referring sensors on the physical machines. At the moment, we’re working on the next generation of sensors for our machine control systems. This will increase the speed with which information is sent to control boxes by more than 100x per second, meaning the machine is becoming smarter and more efficient with every movement.
Geospatial technology is increasingly intertwined with daily life. Which industries or organizations are currently missing out and could benefit from adopting it faster or more extensively?
I’d have to say that, globally, construction is still the least digitalized and automated industry. Construction is very traditional and historically sceptical of new technology. However, in order to stay ahead of the game, businesses and leaders in the sector need to adapt and transform their ways of working and introduce more advanced workflows. Although initial technology adoption may seem costly, the return on investment (ROI) and efficiencies gained further down the line will massively outweigh the investment costs.
When you compare construction to other traditional sectors like manufacturing, the disparity between technology adoption is stark. This sector has embraced digitalization and automation more readily, contributing to connected workflows, efficient data management and even machine learning. It’s vital that construction catches up and adapts to these new ways of working if we’re to meet the infrastructure demands facing us.
What are the main growth drivers for Topcon?
Our business is focusing on two main areas: automation of construction and automation of agriculture. Although these are more traditional industries, there is plenty of opportunity for advanced technology adoption, and certain areas are really spearheading the change. Automated machine control is huge in both construction and agriculture, with farmers also looking at the automation of feeding and crop growth processes. Permanent adoption of technology is also much easier when it comes to farming, as the location does not change year on year. With construction, however, the automation challenge is bigger as no two sites, projects or project teams are the same. Our growing global population will continue to fuel these sectors, as we all need infrastructure and food – but we simply won’t be able to service the world and bolster both local and international economies if we don’t embrace technology… and fast.
Which notable developments can we expect to see from your company in the short to medium term?
We’re currently working on more workflowdriven solutions. We’ve realized that, especially in sectors like construction, easy-to-use interfaces are the way forward and make our customers’ lives much easier. For on-site teams, it’s really helpful to have technology that is as simple and intuitive to use as an iPhone. Over the next six months, we’re also focusing on applying our technology to ‘mini-machines’. These are smaller machines, usually utilized within smaller-scale businesses that require automation and innovative technology just as much as larger developers. Coupling this equipment with easy-to-use interfaces will enable contractors, landscaping professionals and smaller-scale developers – the sorts of companies not used to having engineers on board – to use our solutions. We’re also looking at the portable possibilities of these minimachines. On big machines, GPS, antenna and prisms are normally fixed on the machine. With this smaller equipment, however, we have the opportunity to extract the solution and put it on a pole. This means a contractor can take a measurement easily, then put it back on the machine. It’s all about making things simpler for the end user.
Is there anything else you would like to share with the geospatial community?
One thing I would like to reinforce is that it’s vital that geoprofessionals understand exactly how tasks are performed on site and what data is needed to make this happen. Data management is key for the project teams on the ground, so those people providing the data need to know how to interpret it and communicate it in a meaningful way. By attracting a new generation of geospatial professionals – who, in reality, will actually be data managers – workflows can be transformed and projects can consistently be delivered on time and on budget.
COMBINING DATA FROM SMARTPHONES, GEODETIC SENSORS AND EXTERNAL DATABASES
A mobile app has been developed to improve the success of cadastral survey implementation in Indonesia. The country has set itself ambitious land registration targets by 2025. The national cadastral survey app called Survey Tanahku (‘My Land Survey’) is connected to external sensors for geodetic measurements and also to civil registry services. This solution turns cadastral survey from costly and inefficient into efficient and affordable.
In Indonesia, land registration is a national priority. The aim is to certify all unregistered land parcels and validate the quality of previously registered parcels before 2025. Complete and efficient land registration and land-information services are critical to achieving the Sustainable Development Goals and improving the ease of doing business. Efforts on this front rely heavily on the success of cadastral survey implementation.
Traditional cadastral surveys require cadastral officers or licensed surveyors to conduct field visits for a boundary survey related to ownership documentation. They use geodetic instruments such as global navigation satellite system (GNSS) receivers. Ownership documentation is manually collected on paper. This is validated by documenting the agreement between the landowner and the owners of neighbouring parcels on their common boundary. Such activities require different kinds of media for data storage as well as different data collectors. It is a timeconsuming and inefficient process.
CADASTRAL SURVEY APP
Smartphones are increasingly being used to collect data, either through dedicated apps or open-source apps such as OpenDataKit (ODK) and KoBoToolbox. However, the development of mobile data collection for land administration has been sporadic. A systematic land registration campaign is usually conducted by different teams (e.g. socialization, legal data collection, spatial data collection and verification teams). It is therefore difficult to achieve seamless data processing and integration. As a result, data standardization and data usability challenges arise in integrating spatial and legal data for either first titling or data maintenance.
The national cadastral survey app called Survey Tanahku (‘My Land Survey’) is an answer to these problems. Survey Tanahku is a smartphone app that provides cadastral mapping services based on a connection to external sensors for geodetic measurements. It also has a connection to civil registry services. Together, these turn cadastral survey from costly and inefficient into efficient and affordable.
The app allows data to be entered from both national cadastral databases (connected through land management services known as KKP services) and surveyors’ devices. If data on a new parcel is generated from a surveyor’s device, the boundary and land parcel attributes are stored locally as database records of GeoPackage, an SQLite container suitable for a geospatial mobile app. GeoPackage uses well-known binaries (WKBs) for storing geometries and raster data in the form of images/tiles and text (e.g. JavaScript Object Notation/JSON and National Marine Electronics Association/ NMEA). The app is designed to support data transfer and mapping flexibility across different databases for surveyors in the field. Thus, it provides users with a secure single sign-on and authentication that is integrated with the national land information system (known as KKP). This setting allows account management and the linking of different databases without revealing user credentials.
COMPLIANT WITH LADM STANDARDS
Since data collection with the app is aligned with the Land Administration Domain Model (LADM) standards, a survey mission can be completed quickly and efficiently. A mission involves collecting or verifying three important components: subjects (or party, e.g. claimants, neighbouring landowners, surveyors), objects (or land boundaries) and their subject-object relationships (or rightrestriction responsibilities implied to party over spatial unit). The app makes these activities straightforward and efficient in the field, including by displaying online land records and boundaries stored in national cadastral databases. After completing a survey mission, the surveyor simply uploads the survey data into the survey dashboard.
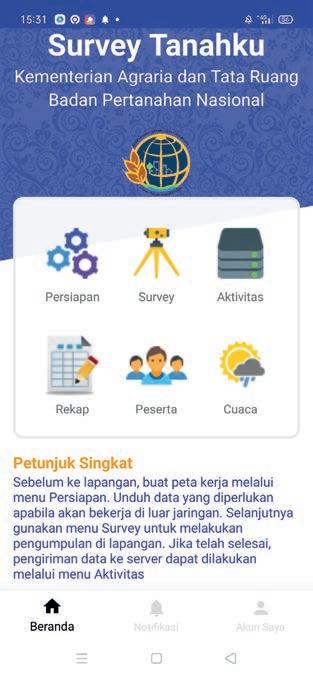
The main screen with menus for preparations (Persiapan icon) and surveying (Survey icon).
Before going to the field, the surveyor must first create a working map (Peta Kerja) to store data.
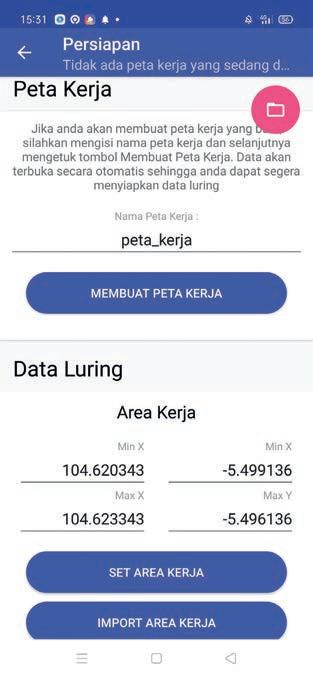
Figure 1: Preparing for a survey with Survey Tanahku.
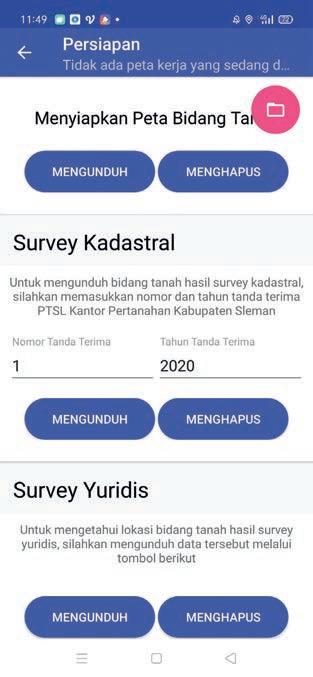
Surveyors can work offline by importing registered parcels of the area. They can also retrieve either boundary data through menus in Survey Kadastral or menus in Survey Yuridis uploaded by different teams.
SURVEY PREPARATIONS
Land surveyors prepare for a survey based on the following four steps: 1. Prepare a working map by defining an area of interest, either drawing it by hand or specifying coordinates 2. Import parcel maps from national cadastral databases (anticipating a weak internet connection in the field) 3. Upload imagery and orthomosaics (prepared as tiles and stored locally) into the app in the form of image tiles, or as an image (which will then be prepared automatically as standard tiles by GeoPackage) 4. Turn on the tracking tool to store details of the field visit (Figure 1).
CADASTRAL SURVEYS
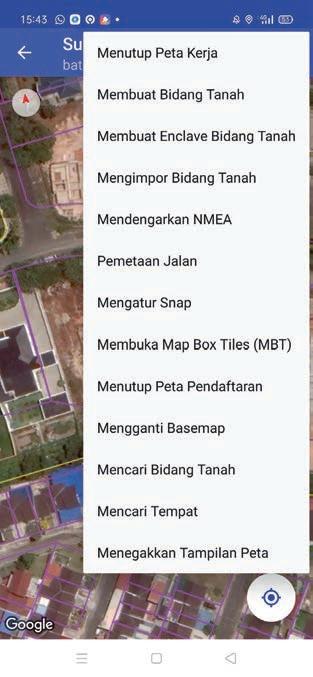
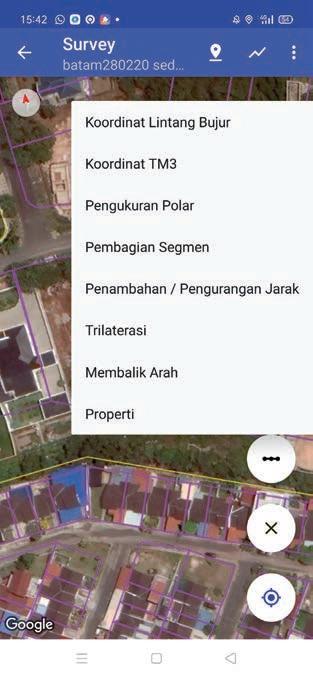
To create new land boundaries, points have to be created on the map canvas. Polygon points can be made by drawing on the map canvas (by selecting the ’Add a new parcel’ option) or via GNSS survey (by selecting the ’Connect to GPS via Bluetooth’ option) (Figure 2). The second option allows the mobile app to connect to an external GNSS receiver through Bluetooth. This helps store precise coordinates of boundary points agreed on by the claimants/landowners and neighboring landowners. NMEA-format data transfers the fixed coordinates gathered from the receiver to the app. During the measurement, if necessary and agreed to by the participants, the surveyor can also simply snap to existing boundary corner points. Once this process is done, the new surveyed land parcel is drawn on the mobile app. Participants can verify the position and edges of the new parcel against the surrounding land parcels. If the survey does not require measurements with a surveygrade GNSS device, the default method is to use the internal GNSS sensor unit in the mobile device. After creating points, surveyors can connect them or snap to existing points, lines or polygons in order to create a new parcel.
EXTERNAL DATABASES
The mobile app can connect with external cadastral databases and civil registry databases. The surveyor can request Web Map Service (WMS) data from cadastral databases within the KKP services to load an official cadastral map, showing registered land parcels with registration status attributes. This is an important feature to avoid redundant boundary demarcation and to assess whether overlapping spatial representation is likely if a new land parcel is created. Attribute information on registration data can only be retrieved online.
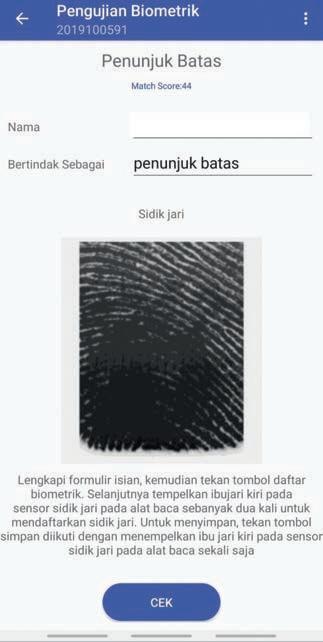
Every resident’s fingerprints are on their national identity card, which is entered into the civil registry databases maintained by the Civil Registration Directorate, Ministry of Home Affairs. This allows for efficient in-person validation for first land titling and in-field title validation for missing parcels.
FINGERPRINT READER
Either biometric-data or person-identifier queries can be used to search the national civil registry databases. In the Survey Tanahku app, biometric data is typically collected
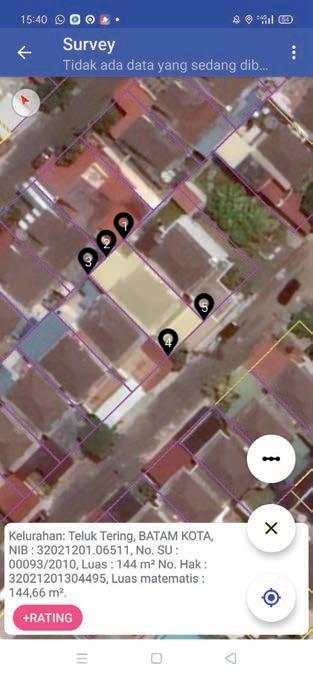
(a) A land surveyor can check registration data of existing land parcels.
Figure 2: Some of the app’s survey and mapping features.
(b) A surveyor can create a parcel by consulting an NMEA source (external GNSS connection), snap to other points, ping, create enclaves, open image tiles, display land parcels from cadastral databases within KKP services, and search locations.
(c) A surveyor can also create a new parcel with distance and azimuth data, mapping with polar measurements, segmenting lines, and displaying the TM-3 coordinates.
using a fingerprint reader connected via Bluetooth (Figure 3). The reader stores the fingerprint data and, when an internet connection is available, a query is sent to the server to verify the person’s identity from the civil registry databases. This biometric data collection includes fingerprints of claimants and adjacent landowners during field measurements for first land registration activities. It is then matched against civil registry databases. Supporting documents such as tax invoices, notarial deeds or letters of statement of land occupation provided by claimants can be annotated and photographed to be stored locally.
UPLOADING
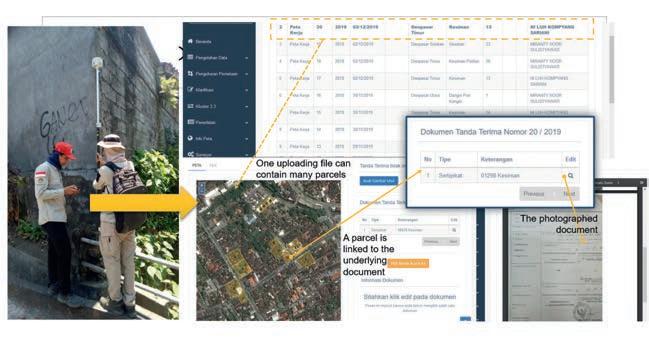
When there is a strong internet connection, the party, subject, spatial and documentation data for every parcel is uploaded automatically. If the internet connection in the survey area is weak, uploads to a survey dashboard are delayed until a stronger connection is available. A centralized survey dashboard enables users to download geometries of land boundaries and document sources or images related to first or forensic titling (solving missing parcels). Once the survey data is sent to the survey dashboard, office validation can be done by registration officers. If the field data within the survey dashboard is accepted, field data can be integrated into the cadastral databases within KKP services in the final stage.
SUPPORTING TRADITIONAL SURVEYS
If a GNSS measurement campaign is not possible for any technical or non-technical reasons (e.g. multipath challenges), the mobile app can facilitate measurements using distances and azimuth angles and distances. These can be handy for surveyors collecting data using tapes or laser-based distance measurers under intensive urban canopies in densely built environments. Where high-resolution satellite or drone images are available as orthomosaics, these can be imported into the app to facilitate general boundaries for community parcel mapping, usually applied for a fit-forpurpose land-administration campaign. This is especially useful for cadastral surveys in large rural parcels, when GNSS and distance measurements are inefficient. As long as claimants and boundary landowners agree, mapping can be done on top of the orthomosaics using mapping tools (snapping, drawing points/lines and creating a polygon).
MISSING PARCELS
Government surveyors can use the mobile app to identify land parcels in the survey area not depicted in the cadastral map. Based on textual ownership data registered in the title and other related data (e.g. property tax invoices), surveyors can conduct interviews with community leaders and occupants to collect information regarding missing parcels. This activity is referred to as forensic titling, tracing and tracking. Where ownership proof can be provided, the document can be photographed and the boundary survey
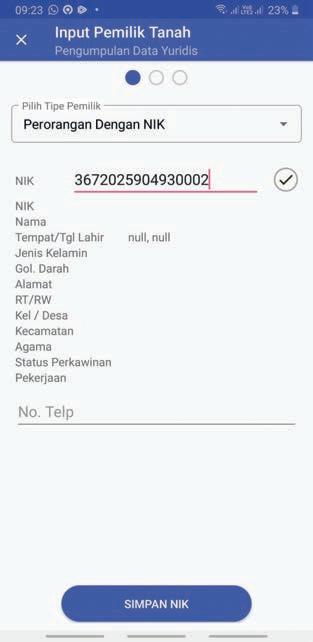
Retrieving a match based on the person identifier.
Fingerprint of a boundary survey participant can be collected in the field.
Figure 3: A person-identifier query and biometric data collection via the app.
Figure 4: Data collection from field survey and interview (left) uploaded to a survey dashboard (right) which has a summary table, map and file view.
can be validated. If necessary, video or voice recording can be added to support spatial and legal data collection.
CONCLUDING REMARKS
It is important to note that the app implementation in the field has faced some non-technical challenges, such as hesitation in submitting fingerprints into the reader, missing underlying documents and low landowner participation. Nevertheless, the use of the GeoPackage standard, sensors (fingerprint reader, camera, accurate GNSS sensors) and quick connection to cadastral databases within the KKP services has enhanced the mobile app’s data-capture efficiency. By the end of 2020, data on 695,000 parcels across three provinces had been collected for the Accelerated Agrarian Reform Project (AARP) in rural areas that are prone to forest fire – where cadastral surveys were conducted for first titling – in the space of four months. This demonstrated that, for first titling, the app can help surveyors collect an average of 15 parcel boundaries with their corresponding party and underlying registration documents per day. The app has also been tested for forensic titling in two local offices: Bangli and Klungkung districts in Bali Province. During three months of field survey, from September to November 2020, the mobile app helped field surveyors plot and validate 5,970 community-owned titles that had not been georeferenced by land offices in the past. In the field, a team plotted approximately 22 missing parcels in a day.
FURTHER READING
Aditya, T., Ary Sucaya, IKG., Adi, F.N., 2021, LADMcompliant field data collector for cadastral surveyors, Land Use Policy, Volume 104, May 2021, 105356. https:// www.sciencedirect.com/science/article/pii/ S026483772100079X Molendijk M., Morales J. and Lemmen C., 2015. Light Mobile Collection Tools for Land Administration – Proof of Concept from Colombia, GIM International 16/11/2015. https://www.gim-international.com/ content/article/light-mobile-collection-tools-for-landadministration Open Geospatial Consortium OGC, 2017. GeoPackage Implementations. OGC implementations. https://www.GeoPackage.org/implementations.html The International Federation of Surveyors (FIG), 2019. New Trends in Geospatial Information: The Land Surveyors Role in the Era of Crowdsourcing and VGI. FIG Publication 73. https://www.fig.net/resources/ publications/figpub/pub73/figpub73.asp
ABOUT THE AUTHORS
Trias Aditya is an associate professor at the Department of Geodetic Engineering of Universitas Gadjah Mada (UGM) in Indonesia.
I Ketut Gede Ary Sucaya is the head of the Land Office of Denpasar City at the Ministry of Agrarian and Spatial Planning/National Land Agency (MoASP/BPN).
Fajar N Adi is head of the Sub Directorate of System Development of Land Services at MoASP/BPN.


