58 minute read
Automated Mobile System for Mapping Mine Shafts


THE BENEFITS OF LASER SCANNING
Automated Mobile System for Mapping Mine Shafts
Mine shafts are governed by special rules, often difficult to access and known for their unfavourable conditions for measurements. A mine shaft is of strategic importance for the proper functioning of the mine in terms of air ventilation, transport of people and material extraction, for example. Therefore, not least for safety reasons, mine shafts require regular inspections and surveys. For this purpose, the company SKALA 3D has developed an automated mobile laser scanning system as a mining survey system (MSS) which facilitates fast and precise measurements. The result is a comprehensive 3D model of the mine shaft ready for further analysis.
Mobile laser scanning technology is developing dynamically in the mining industry. The current choice of laser scanners ranges from high-precision panoramic scanners to handheld scanners and backpacks based on SLAM algorithms. There has been extensive research and investigation into the use of this type of technology in surveying mine shafts in recent years. However, due to the characteristics of the object and the lack of GNSS satellite signal coverage, the task has not been easy. To calculate an accurate trajectory and consequently reconstruct an accurate 3D point cloud of the shaft, SKALA 3D has developed a methodology composed of: • Initial trajectory estimation based on alman ilter incorporated for IMU data processing
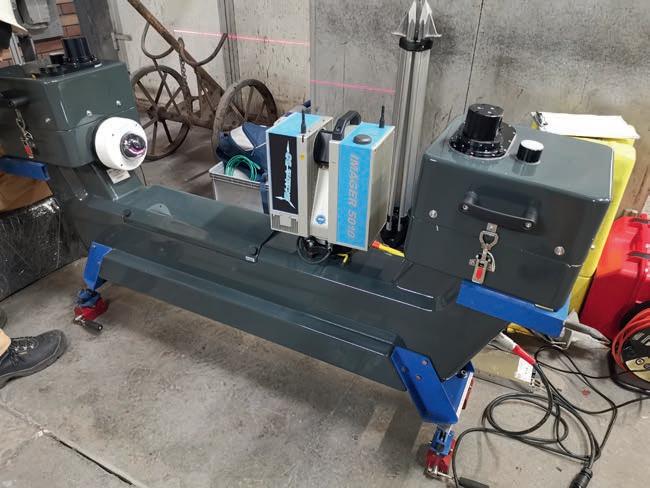
Figure 1: View of the mining survey system (MSS) installed on the roof of the cage, which consists of two Z+F 9012A profilers, one Z+F 5010X imager and an IMU LCI-100 unit.
• Calculation of relative poses (position and orientation) between consecutive trajectories based on an Iterative Closest Point algorithm when processing the Lidar point cloud • Re nement of nal trajectories based on a
Graph SLAM algorithm incorporating all the poses of the trajectories (vertices) and the relative poses (edges) • using georeferenced data into trajectory re nement. Since the design of the SKALA 3D MSS assures an overall 360-degree (panoramic) Lidar eld of view, the calculation of relative poses can be done in six degrees of freedom.
CHALLENGES ADDRESSED
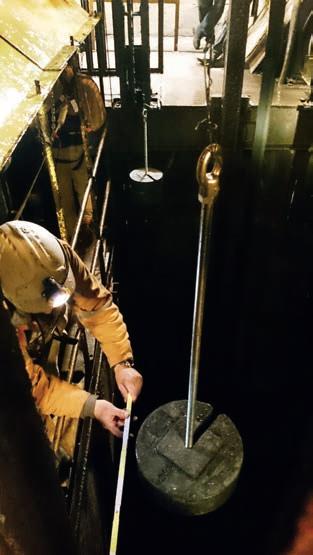
Three challenges are addressed: 1) automation of the shaft survey, 2) increasing the safety of mine surveyors, and 3) decreasing the cost of the survey by shortening the overall inspection time. The introduction of the appropriate technology made it possible to reduce the total working time of the mine surveyors and to minimize their exposure in the light of the shaft, in particular outside the cage. In other words, inspection using the MSS is not only faster but also enables safe operation on the inside of the cage (see igure 3), which is impossible to achieve with the classical approach.
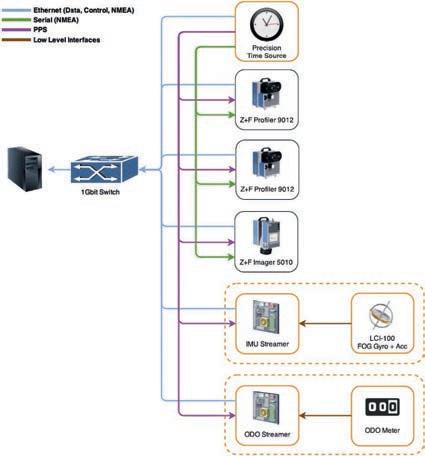
Figure 2: A diagram of MSS construction.
In addition to hardware challenges, there are also challenges in the amount of acquired data. Large numbers of mobile scanning surveys at low speeds generate large amounts of data, which calls for a lot of computational power. The parallel processing of orthogonal computational subproblems can thus improve the overall performance. Needless to say, this re uires signi cant investment in hardware and software to facilitate ef cient and reliable processing and alignment. But despite all these dif culties, there is currently no better, faster and equally precise technology on the market for the spatial inventory of mine shafts.
MINING SURVEY SYSTEM (MSS)
The whole technology is based on terrestrial laser scanning and measurements using a high-precision inertial measurement unit. The rigid measuring platform has also been tted with a set of vibro-isolator systems which prevents vibrations ascending from the moving cage and improves the quality and accuracy of the measurements. The effect of this vibro-isolator system can be likened to the suspension system on a traditional road survey vehicle – it makes the trajectory smoother and therefore the IMU readings more reliable. The end result is a calibrated system, which can supply complete spatial data in a short time (just a couple of hours).
The system includes software to control and post-process the data. The precision in a single measurement horizon is 2-3mm. Evaluations during many shaft surveys have shown that, thanks to the Graph SLAM algorithm, the accuracy of the position of the point on the
THE MSS IN PRACTICE
The measurement process and the methodology of the procedure are closely related to the scope of the work (elements to be measured). For example, determining the verticality of the shaft requires a different approach than merely measuring the geometry of the shaft lining and its construction elements. In order to obtain data in a specific geodetic coordinate system, it is necessary to perform georeferencing surveys on the geodetic control network points as for classic geodetic measurements or terrestrial laser scanning. Entire data registration process relies on a panoramic field of view, thus vertical and horizontal 3D landmarks (typically corners) contribute into Graph SLAM alignment. All trajectory nodes are considered as vertices (optimized parameters) and thanks to the Iterative Closest Point procedure it is possible to calculate relative poses between landmarks (and therefore relative poses between the trajectories). The alignment algorithm process all this information to minimize point-to-point Euclidean error. If georeferenced data is available, such additional landmarks are fused with other observation equations assuring global accuracy of the final 3D point cloud. Regardless of the purpose of the scan, the mining survey system is placed on the roof of the cage or skip. After setting up the measurement configuration, it is ready to scan. The system is fully automatic as an independent measurement instrument, so it does not require any additional effort. The post-processing procedures enable the fusing of additional georeferenced data if available.
The speed of the cage/skip passing through the shaft is selected depending on the desired vertical resolution. The operational speed is usually in the range of 0.5-1m/s. Typically, the measurement begins at the top of the shaft tower and ends at the lowest point in the shaft that can be reached through the cage. The scanning takes place when riding both down and up. The number of passes (surveys) depends on the geometry of the shaft. To cover the entire field of view, it is necessary to change the mounting position of the MSS on the cage/ skip since many elements of the infrastructure (e.g. robes, etc.) could introduce blind spots in the final 3D point cloud. Since there are usually two cages, the total number of surveys is typically four (one down and one up from the outside of each cage). For a mining shaft with a depth of 1,000 metres, one measurement (survey) using the MSS at a cage speed of 1m/s takes 1 hour (up and down plus additional time for set-up and the assembly of the scanning platform on the cage roof). Such a measurement configuration results in the average resolution of points on the object of 3x3mm. The global accuracy of the final 3D point cloud is less than 10cm at a depth of 1,000m. The relative accuracy between point clouds for different runs is 2-3mm.
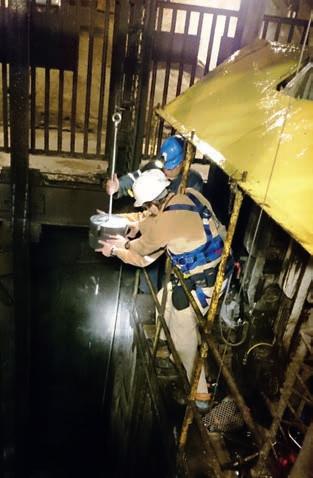
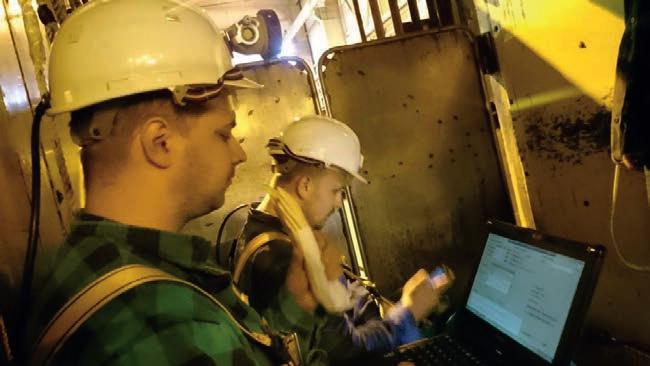
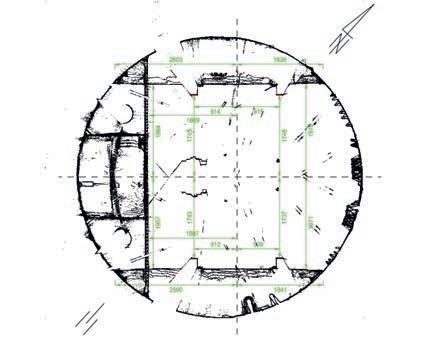
Figure 4: Controlling the mobile system from inside the cage. Figure 5: Dimensioning of a shaft cross-section.
thousandth metre below ground is up to 10 centimetres (average 5-6cm). Although some hardware/software components are already in use in other applications, this hardware set-up and overall design of the system is unique on a global scale. For example, the mechanical design (placement of the Lidar scanners resulting in a panoramic view), the vibroisolator systems and the dedicated mounting components make the system easier to deploy in extremely demanding environments. Industrial magnets allow for fast installation on the roof of the cage. Moreover, the automation of the entire shaft survey process reduces the manual intervention, thus adding signi cant value in terms of operator safety.
MEASUREMENT CHARACTERISTICS
The measurement characteristics for the cage skip at a speed of 0.5m s are as follows: • Point cloud pro le every 2.5mm from two 9012A pro lers and one 5010 imager • 2 x 200 pro les per second from two 9012A pro lers • Measurement of over 1 million points per second from all lasers • IMU readings at 50Hz fre uency • The total ride time (down and up) in a 1,000m-deep shaft is approx. 1.5-2 hours (including additional time for set-up, warm up and other deployment activities).
The cage or skip carrying the MSS can travel at a speed of between 0.1 and 12m/s. The impact of the speed on the Graph SLAM algorithm is minor due to the panoramic eld of view of the entire Lidar set-up. It is evident that higher speed will result in a lower resolution of the nal 3D point cloud from the direction of motion. For this reason, an operational speed of 1m/s is preferable as a compromise between the measurement time and the resolution of the resulting point cloud.
DIFFERENCES BETWEEN TRADITIONAL AND MOBILE MEASUREMENTS
The main factors determining the choice of technologies used in mine shafts are time and safety. The inspected shafts ranged from 650m to 1,100m in length depth. In classic geodetic surveys using the traditional method, surveying 1,000m of shaft usually takes three to ve shifts (2 - 0 hours), depending on the measurement speci cations. Regardless of whether a mechanical plumb line is lowered or laser plumbing is used, the surveyor has to stop every few metres and make several offsets. This means that only selected points are measured, plus it is a time-consuming task. In addition, the classic approach re uires the continuous presence of people in the shaft, which poses a risk in terms of operator safety – especially because they often have to work outside the cage (see igure 3). However, the biggest downside for mine owners of the traditional approach to measurements is that it interrupts the extraction of materials (known as ‘spoil’). In the case of the excavation shaft, every hour of downtime is a huge cost and this can cause signi cant nancial losses for the mine. Needless to say, it is crucial to reduce this time from an economic perspective,

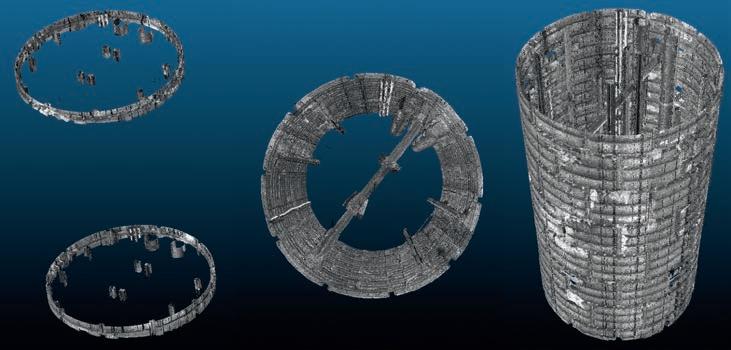
Figure 6: MSS on the roof of the skip before the shaft survey. Figure 7: Examples of point clouds of the shaft obtained by the MSS.
and that was the main motivation behind the development of the MSS.
In fact, mobile laser scanning can reduce the time of the inspection by at least 50% and as much as 70% compared to traditional technology. Depending on the scope of the work, a complete survey takes just one or two shifts (8-16 hours). The technology is fully automated, which means that the involvement of the human operator is limited to the plumb lining (if necessary). or safety reasons, the MSS is operated from inside the cage.
The entire shaft image (point cloud) is acquired in just a couple of hours. Many different options for monitoring and comparing the state of the object are possible. Most importantly for mine owners, the cost of surveying the shaft using the MSS is considerably lower than the cost of the shaft being out of action for some time.
POSSIBLE ANALYSIS SCENARIOS
The complete and accurate geometrical and photorealistic documentation of the shaft casing and its construction elements allows for a wide spectrum of analysis scenarios, such as: • ull 3D model of whole shaft pipe • Documentation and monitoring of damage and physical changes, including deformations • Possibility to design the location of new devices, e.g. pipeline, air conditioning • Designing the renovation of selected places in the shaft based on one measurement • Collision control during transport of largedimension objects (machines) • The possibility of dimensioning on crosssections anywhere in the shaft • erticality and straightness of the shaft and its components (shaft guidelines).
CONCLUSION
As shown above, the MSS automatic shaft measurement system works well in real life. The point cloud resulting from laser scanning is of good quality and requires much less work on-site than the classic approach, thus signi cantly reducing the overall costs for the mine owner. The ef ciency of mobile laser scanning is much higher than conventional methods, without the inconvenience and safety problems associated with the work of mining surveyors in the shaft. In view of all these aspects, the authors maintain that automating mine shaft surveys can ef ciently increase operator safety and reduce the inspection time, resulting in a cost-effective solution.
ABOUT THE AUTHORS
Artur Adamek is a surveyor, scientist, polar explorer and inventor. He has been the owner of SKALA 3D since 2003. He primarily creates mobile measuring systems based on laser scanning technology for mining. Together with the team, he developed the mining survey system for the spatial inventory of mining shafts.
Janusz Be˛dkowski, DSc, PhD, from the Institute of Fundamental Technological Research at the Polish Academy of Sciences, is working on automating mobile mapping systems. His main interest lies in solving optimization problems related to fusing different modalities from IMU, odometry, Lidar and camera measurement instruments. He is working in the mobile robotics domain with a focus on autonomous navigation and map building.
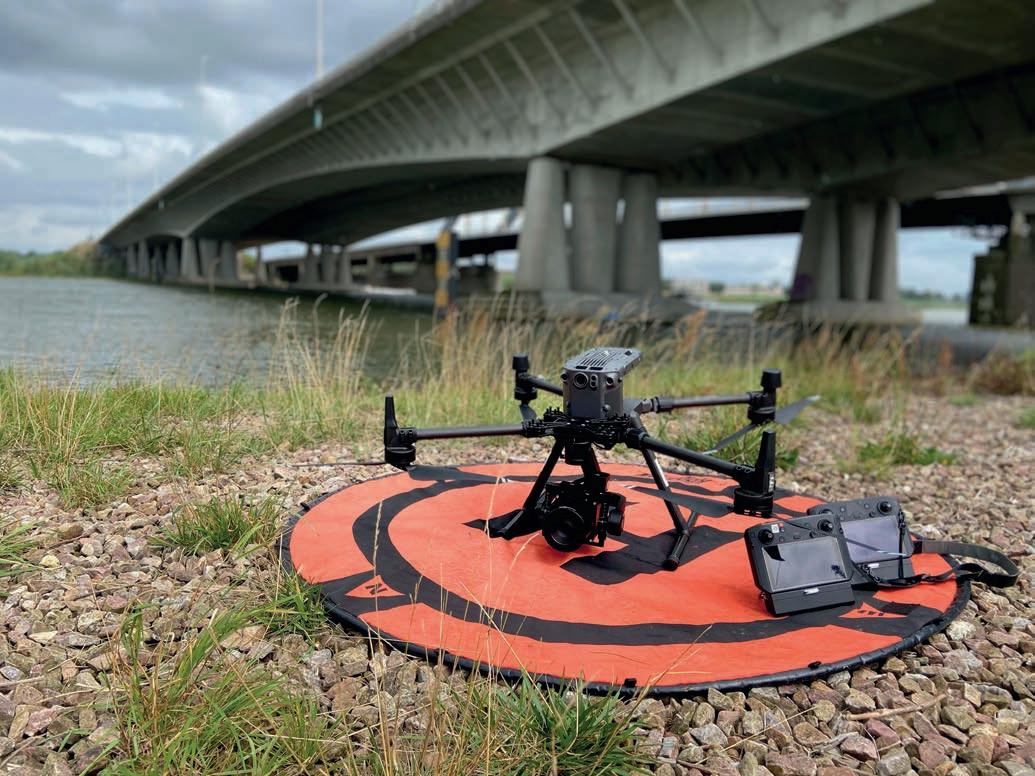
Acquiring High-resolution Aerial Data in Congested Areas and Controlled Airspace
Phase One Drone Supports 3D Bridge Inspection in the Netherlands
The use of a Phase One iXM-100 enabled EyeFly BV to fly closer to the Buggenum rail bridge in the Netherlands for the required annual bridge inspection. This achieved a resolution of close to 1mm ground sampling distance (GSD) and an image footprint of 12m x 9m from a flight height of 10m distance. The data has been used to create a 3D mesh of the structure.
Dutch company EyeFly BV is one of the few fully certified operators of unmanned aerial vehicles (UAVs or ‘drones’) in the Netherlands. The company has obtained all the permits regarding the commercial use of drones as well as additional certificates for flying in congested areas and controlled airspace. EyeFly is focused on performing inspections and mapping (2D and 3D models) using aircraft that have been tested by the Netherlands Aerospace Centre and registered in the aviation records.
The company offers a specialist level of expertise and skills in infrastructure, construction, geoinformation and surveying. Achieving the best possible results using EyeFly’s existing certified equipment means acquiring high-resolution cameras that are ready to integrate. The Phase One Industrial iXM-100 camera easily incorporates with the company’s DJI M600 and Freefly Alta UAVs, plus it provides close-to-1mm resolution data with a large footprint at a safe enough
distance from the object to meet the safety requirements.
ANNUAL MAINTENANCE INSPECTION OF BUGGENUM BRIDGE
EyeFly supports Strukton Rail with the annual maintenance inspection of Buggenum rail bridge in order to identify changes in the structure from year to year. Areas of wear and damage are identified, and areas with the biggest changes are given priority for repair.
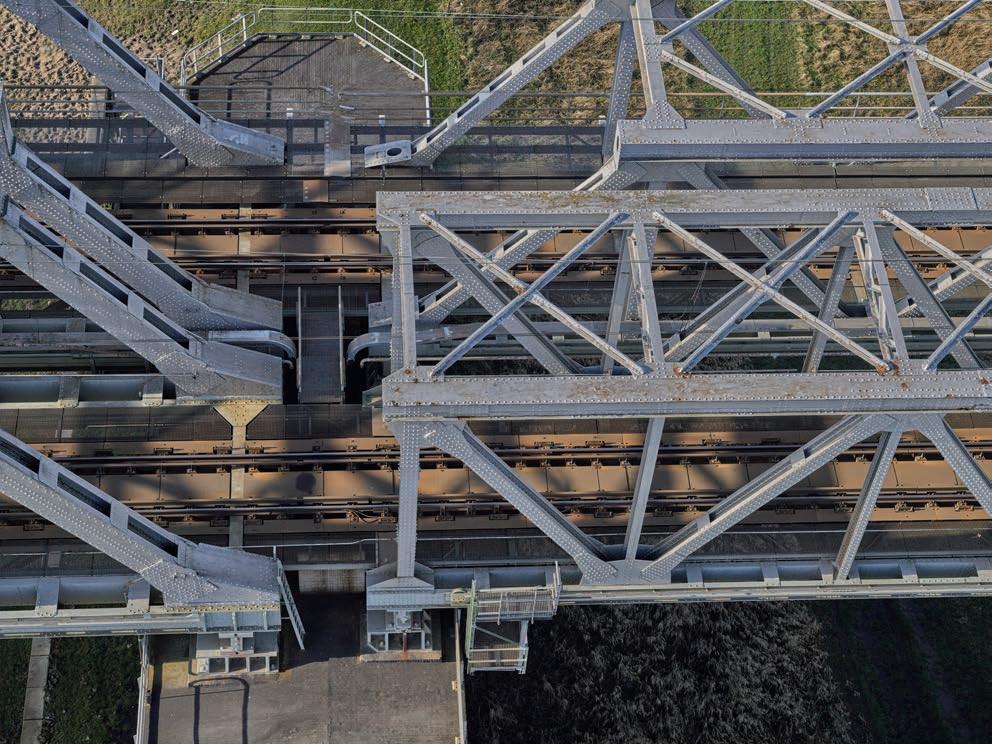
Previously, EyeFly faced the challenge of obtaining a resolution/GSD of close to 1mm while keeping the UAVs at a safe distance from the bridge. Lower-resolution sensors meant tens of thousands of images with smaller footprints had to be captured over a number of days. It was difficult if not impossible to generate a 3D mesh of the structure. Images were provided to the client using a sharing platform such as WeTransfer. There was no ability to correctly trace back every image.
LARGE FOOTPRINT WITHOUT REDUCING THE LEVEL OF DETAIL
Remco Kootstra, director of EyeFly, explains: “We chose the iXM-100 as it easily integrates with our DJI M600 platform in combination with the IOS IX Capture application. The camera is used on both our DJI M600 and Freefly Alta UAVs. The M600 is used for capturing the top and sides of the structure and the Alta enables us to perform an inspection from the underside of the bridge because of the ability to mount the IXM-100 on top.”
EyeFly uses the RSM 35mm lens as it has a focus of 10m to ∞ while the RSM 80mm AF lens is only 30m to ∞. The 35mm lens enables the UAV to be flown closer to the bridge and achieve a resolution of nearly 1mm with an image footprint of 12m x 9m from a flight height of 10m distance from the object.
DATA ACQUISITION
Since availability of GPS is limited on the underside of the bridge, the images are captured with a large overlap so that the processing software can provide orientation parameters and position data. The iXM-100 has enabled EyeFly to significantly reduce the number of images; 5,000 100MP images were captured in two days covering the top, side and bottom of the structure.
Additionally, it is now possible to create a 3D model of the entire project on EyeFly’s web-based platform with inspection functionality. This allows clients to perform an inspection much more efficiently, without losing detail or making any compromises.
SATISFIED END USERS
“Phase One’s 100MP camera is the best on the market and integrates very well into existing UAVs. The sensor never compromises on detail or accuracy and it always delivers. The large dynamic range means that fine details are captured, even in poorly lit areas,” states Kootstra. “Our business has grown since we started with Phase One cameras as we are able to provide our customers with all the data that they need in one flight. The result is satisfied end users who come back time and again, as we can provide them with more details and better accuracy than we could with lower-resolution sensors,” he concludes.
MORE INFORMATION
www.eyefly.nl geospatial.phaseone.com
ABOUT THE SYSTEM
The integrated system includes: Phase One Industrial iXM-100 medium-format camera RSM 35mm lens RSM 80mm AF lens DJI M600 Freefly Alta UAV
APP CELEBRATES 100 YEARS OF INNOVATION AT HEERBRUGG
Bringing History to Life Using 3D Interactive Computer Graphics
Modern didactic and historical research related to digital humanities requires 3D digitization and dynamization of tech heritage. One example of such a project is the decision to celebrate 100 years of great innovations at Heerbrugg in the development of geodetic and photogrammetric instruments by 3D digitizing an iconic WILD T2 theodolite from the 1927 series and developing an app for Android, iOS and Windows devices.
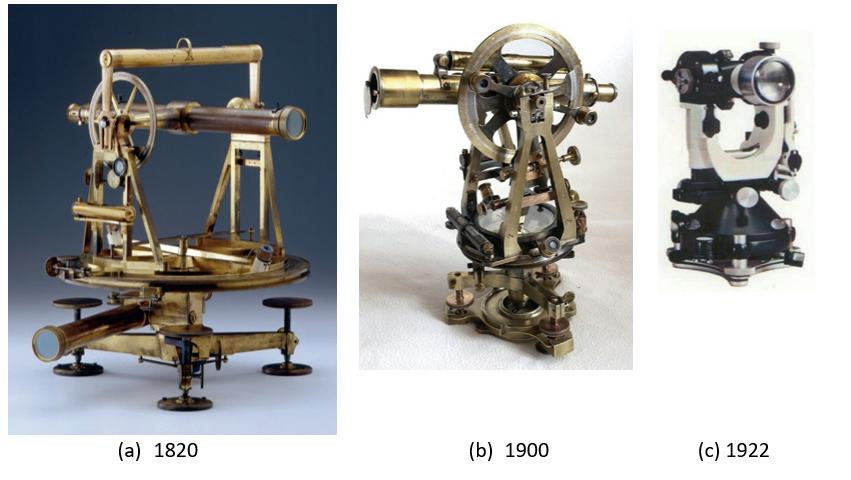
WILD Heerbrugg, which is today owned by Leica Geosystems, part of Hexagon, celebrated its centenary earlier this year. It all started in late autumn 1920 with a telegram from Heinrich Wild, at that time head of the Geodetic Instruments Department at Carl Zeiss, Jena, Germany, to Dr Robert Helbling, a mountaineer, mountain cartographer and owner of a surveying office in Flums, Switzerland: “I have designed a new autograph for the photogrammetric production of maps, which will be much cheaper than the model currently on the market”. In search of a sponsor to establish a new company, Dr Helbling approached Jacob Schmidheiny, an influential and highly respected entrepreneur from the Alpine Rhine Valley. After extensive contract negotiations, the partnership agreement for the new company called ‘Heinrich Wild, Werkstätte für Feinmechanik und Optik, Heerbrugg’ was signed on 26 April 1921. The new company started with about 30 employees. In addition to designing the autograph, Heinrich Wild began designing and building a photo theodolite and, simultaneously, the world-famous T series: the T1, T2 and T3. The WILD T2 was designed as a universal theodolite, with an angular measurement precision of 1 arc-second and revolutionary features. Previous arc-second or so-called ‘repetitive’ theodolites were large and difficult to use (Fig. 1), so the T2 soon became popular. In fact, more than 90,000 units were sold over seven decades. So what made the WILD T2 so special?
ABOUT THE WILD T2
When designing the T2 theodolite as a further improvement of the ZEISS T1, the following features were important to Heinrich Wild: - Very compact telescope with 24x magnification, internal focusing lens and to be illuminated. - Cylindrical standing axis made of hardened steel and mounted on ball bearings (Fig. 2a) - Glass circles with 1 arc-second reading precision and therefore very precise etching of the graduation lines (0.15µm) (Fig. 2b) - Coincidence microscopes for horizontal and vertical circles for reading diametrical pitch circle locations (Fig. 3b)
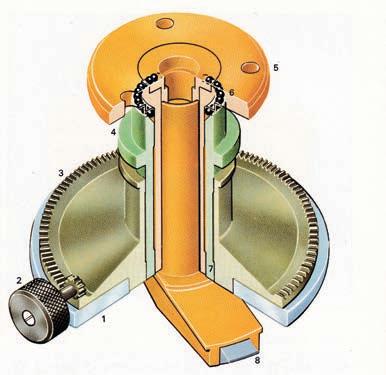
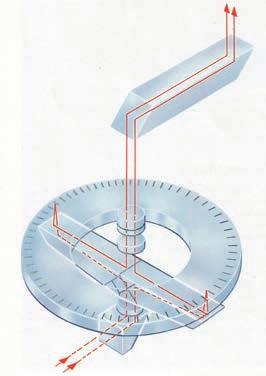
Figure 2: Cylindrical standing axis mounted on ball bearings and diametrically readable glass circles.
- Very compact and closed housing weighing about 4.5kg - Dust-tight container for easy transport
The coincidence microscope for reading the two diametral pitch circle positions was realized by a plane plate micrometer and achieved significant time savings compared to the reading of only one pitch circle position (Fig. 3a).
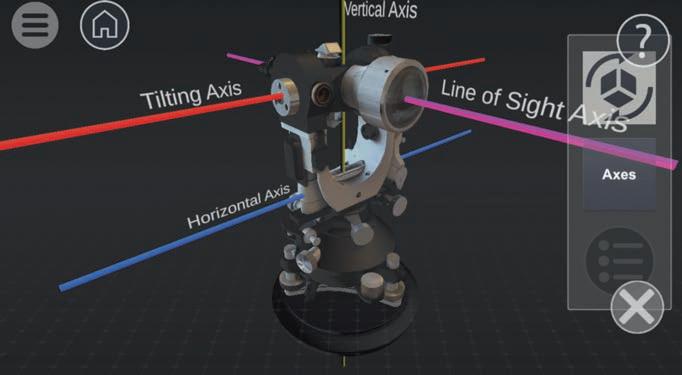
In 1923, the first 24 instruments were delivered, despite adverse conditions in series production. Difficulties included the production of the horizontal circles (d=90mm) and vertical circles (d=70mm). These were made of glass, which was a novelty at that time as they had previously been made of brass. The first devices were delivered in noble black/white (about 1,800 pieces). The transition to the classic WILD green happened in 1927. or ‘edutainment’. This form of presentation and visualization will almost certainly help to spark young people’s interest and fascination in 3D digitization technology, tech heritage preservation activities and perhaps even geodetic instrumentation. Therefore, in the summer of 2020, the three authors decided to develop an interactive 3D app presenting the iconic WILD T2. First of all, a storyboard was created to provide guidance throughout all stages of the app design. It tells 15 stories in total – including about the foundation of the company, the features of the WILD T2 and the interior elements of the theodolite. Embedded in the historical text are audio messages, images and static and animated 3D models. The animations are generated by 3D interactive computer graphic, to keep users interested in the various stories and to highlight some important features. The app is available in German, English and Chinese (Mandarin) (Fig. 4).
The 3D digitization was based on a 1927-series WILD T2. It was scanned by a composite of up to 800 photos and transformed into a coloured 3D point cloud by photogrammetric bundle block adjustment (based on structure from motion, SfM) and dense image matching (DIM) (Fig. 5).
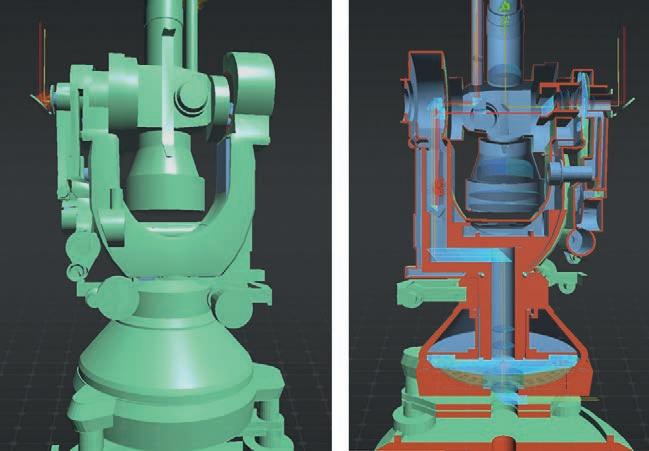
Since the coloured point cloud of the WILD T2 was about 600MB in size, it could not serve as 3D base model in the app. Therefore, a transformation process was necessary to convert the point cloud into a vectorized 3D model. Techniques to automatically transform point clouds into kinematic 3D models, e.g. using machine learning (ML) and deep learning (DL) methods, are still in the early stages and therefore have very limited application, although that may change fundamentally in the next five to ten years. In this case, the point cloud was transformed into 3D CAD elements in an interactive computer graphics process called constructive solid geometry (CSG). This breaks down the point cloud model into its vectorial components and these are then textured accordingly (Fig. 6). The CSG 3D model could then be textured with the WILD T2 texture from the past decades, animated and dynamized as desired: rotation around the alidade axis, telescope traversal, tilted and zoomed. Moreover, a decomposition into the optical components (using sectional drawings) allows for camera flights along the ray paths for the horizontal and vertical circles, representation of axes systems, and
In response to sustained worldwide demand, the WILD T2 continued to be produced until 1995 and was adapted to technological progress over the decades. For example, partial digitization of the glass circles in 1972 avoided errors in the ten-minute readings.
DESIGNING THE WILD T2 APP
It is widely recognized that animated and dynamic models help to foster a better understanding of design elements, to digitally open up information to members of the public and to inspire youngsters about possible areas of study or future career options. This newly emerging form of didactics is also known as ‘education entertainment’ Figure 3: Readings at glass circles: (a) beam path with one reading point, (b) mirroring two reading points.
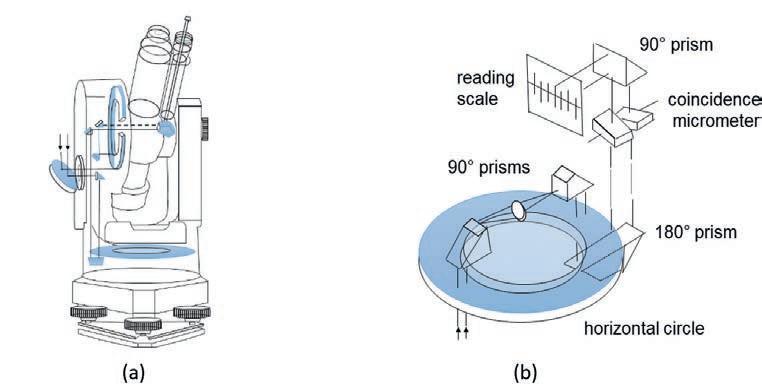
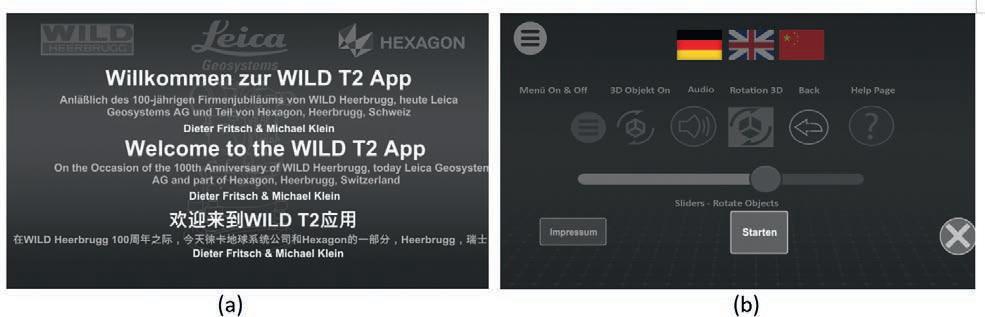
Figure 4: The WILD T2 app: (a) Welcome Screen, (b) Language selection and help symbols.
much more. Users of the app user can also play around with the 3D virtual reality (VR) model – or ‘digital twin’ – of the T2.
The app operates in panoramic mode and the screen is subdivided into three parts: the story headings on the left, the stories with images in the middle and the help symbols on the right. 3D models and animations are displayed in the middle of the screen and symbolized by the rotating cube symbol. The buttons on the top left lead to the story headings and to the home screen. Audio embedded in the corresponding stories can be activated using the loudspeaker button. The 15 stories provide app users with a comprehensive overview of the company history and its locations over time, the T2 features and updates, and some interior elements of the theodolite which are animated to demonstrate its compact and revolutionary design.
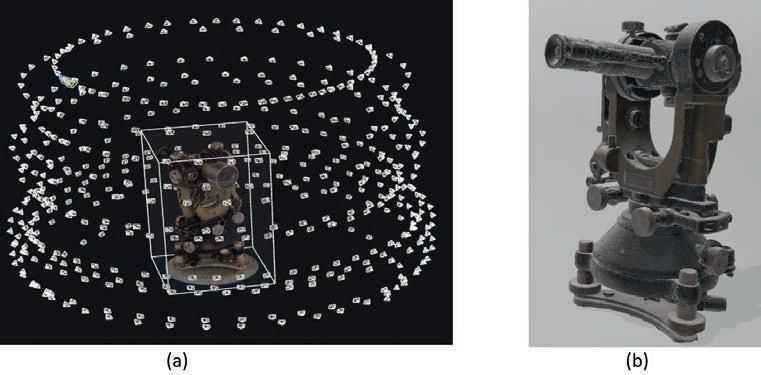
Figure 5: Photogrammetric digitization of the WILD T2 (1927): (a) photo bundle, (b) 3D point cloud.
ANIMATIONS AND RENDERING
All interactive computer graphics 3D models have been generated using Autodesk 3ds MAX. The point clouds were used only for scaling the final 3D CSG model. The photos of the T2 over time (1923-1995) served for texturing the digital twins, according to a selected point in time. The app offers three digital twins for the following time periods: 1922, 1929 and 1962. Several cross-section models (one of which is shown in Fig. 7) were used to create a very detailed 3D model with numerous design elements, which the user can also ‘explode’. This feature is aimed at inspiring the younger generation about the possibilities of interactive computer graphics, which can also be used to provide impressive animations and simulations in sectors where 3D data capture is emerging, such as architecture, engineering & construction (AEC).
The 3D text, audio, image sequences and 3D models were integrated into the app using the Unity 3D game engine. This enabled the animated interactive 3D models to be exported and rendered and finally prepared for mobile operating systems, such as Android and iOS. During this processing step, a Windows version was also generated to be scaled for several screen resolutions. Fig. 8
shows an excerpt from Story 15, featuring animated flights through the optical systems for reading the horizontal and vertical circle.
CONCLUSION
The WILD T2 theodolite was a milestone in geodetic instrument development. For more than seven decades, it had the most modern design and revolutionary features of its time, such as the cylindrical standing axis, horizontal and vertical circles made of glass, diametrically readable graduated circles, precise readings by coincidence micrometers, a compact telescope and low weight. By summarizing the most important facts and features of this innovative and bestselling theodolite, the WILD T2 app recognizes the outstanding performance of the engineers, technicians and managers at Heerbrugg, within the company that is today known as Leica Geosystems and part of Hexagon – over the past 100 years. The developers hope that the WILD T2 app will contribute to the public understanding of science and technology by presenting 15 stories about the background of WILD Heerbrugg and the T2 including a variety of 3D reconstructions, visualizations, animations, image sequences and audio. In these times of digitalization and new didactic elements in higher education, it is hoped that the app will help students and also the general public to gain a better understanding of the history of geodesy and geoinformation science through the playful use of new technologies.
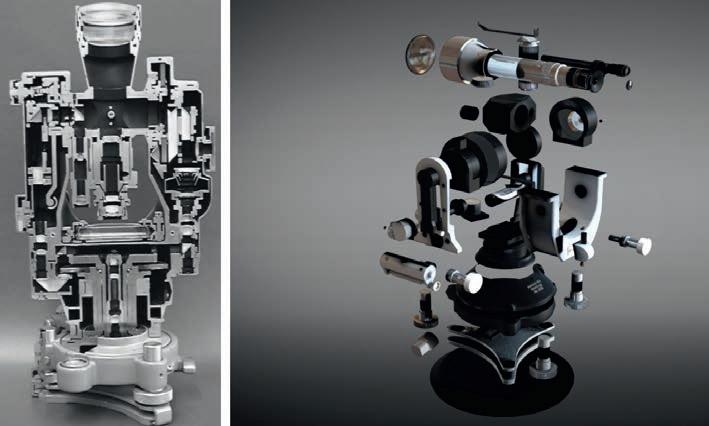
Figure 7: The app allows users to ‘explode’ the digital twin of a T2 from 1922 into its design elements.

FURTHER READING
https://fb.watch/596MIJ14vW/ Download the WILD T2 app free of charge: Android: https://play.google.com/store/apps/ details?id=net.sreasons.WILDT2 iOS: https://apps.apple.com/us/app/wild-t2/ id1564103981
ABOUT THE AUTHORS
Dr Dieter Fritsch is research professor and professor emeritus at the University of Stuttgart, Germany. He spent 24 years as director of the Stuttgart Institute for Photogrammetry, has managed more than 110 research projects and published 460 publications related to photogrammetry, laser scanning, computer vision, GIS and statistical inference. In addition, he was vice-president and president of the University of Stuttgart (1998-2006) and currently serves as a consultant on geospatial technologies and intercultural management. dieter.fritsch@ifp.uni-stuttgart.de
Michael Klein has been active as the CEO of 7reasons, Vienna, Austria, in the fields of virtual archaeology and digital cultural heritage for over two decades, with a special interest in disseminating scientific knowledge to a broader audience. The objective of 7reasons is not only to produce the final media in terms of wellresearched and scientifically backed animations, interactive applications or representative short films, but also to aid scientific personnel during research with new methods and possibilities offered by computerized tools and simulations. mk@7reasons.net
Dr Jürgen Dold has been with Hexagon since 1995. In 2020, after leading Hexagon’s Geosystems division since 2010, he assumed a senior leadership role managing Hexagon’s Geosystems, Geospatial and Safety & Infrastructure divisions where he is responsible for the vision, strategy and portfolio roadmaps of all three businesses. Before joining Hexagon, he served as academic counsel and assistant professor at the Technical University of Braunschweig, Germany, and held various management positions within Leica Geosystems. juergen.dold@hexagon.com
Welcome to the New Geospatial
Teledyne Optech and Teledyne CARIS have united to form Teledyne Geospatial in response to the evolving marketplace needs. Under the Teledyne Imaging group, the harmony between the two business units was clear and the two teams were brought together to offer added value to customers through solutions across hardware, software and workflows.
Andy Hoggarth, vice president of sales and marketing at Teledyne Geospatial, has been with Teledyne CARIS for almost 20 years. Having begun his geospatial career as a multibeam sonar processor using CARIS software at sea, he transitioned from working on the technical side of the business and is considered an expert in ocean mapping. Teledyne CARIS has carved out a solid niche within the marine sector, only to become broader via this new collaboration. For Hoggarth, the synergies were clear: fusing the two companies reflects the natural evolution of the geospatial industry.
NEW OPPORTUNITIES FOR CUSTOMERS
“What’s new about this model is our ability to streamline and centralize our service provision, offering more to both new and existing customers across the spectrum of needs,” comments Hoggarth. “Having a single contact point across all requirements means efficiency gains in terms of workflow, saving time and ensuring our customers get what they need earlier. The needs of professionals are evolving to no longer focus solely on land or sea, and both geospatial and maritime enterprises are increasingly expected to offer a more comprehensive suite of services. Bringing Optech and CARIS together enables leveraging the world-leading expertise of both companies, ensuring customers can take full advantage of their ability to provide targeted solutions for land, air and sea. We see new opportunities to connect existing hydrographic customers to the broader geospatial sector. We can offer solutions to a new spectrum of clients on the topographic mapping side through the latest geospatial workflow software including tools like artificial intelligence (AI).”
Hoggarth explains that he is most excited about the new possibilities the merger provides for Teledyne customers to gain a competitive advantage in terms of what they can deliver. “For example, processes will be further streamlined: customers can log their high-density, high-resolution Lidar data, store it in the CARIS cloud for immediate processing and analysis, and then move into downstream product creation workflow. This gives a clear operational advantage. This, in turn, enables our customers to offer added value to their own clients in terms of the breadth of services they’re able to offer.”
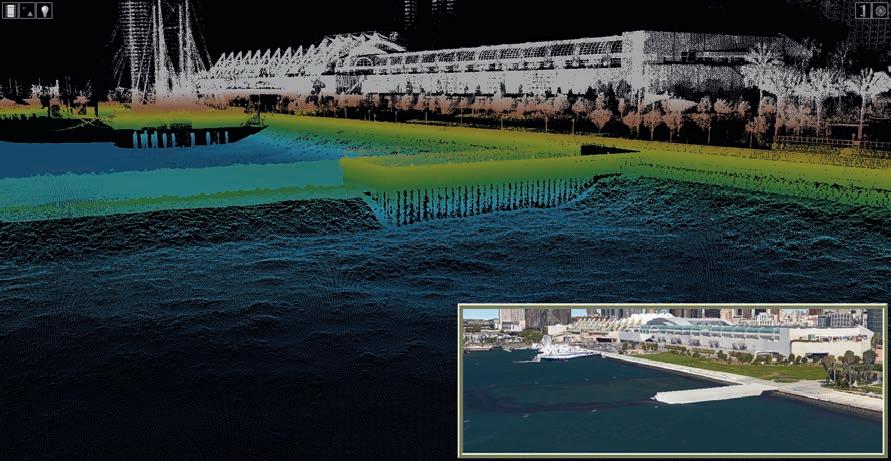
Ease of data collection through to final products is enhanced with efficiency-driving AI algorithms and real-time quality control. (Image courtesy: Mike Stecher)
CONSEQUENCES OF THE MERGER FOR THE TEAMS
Joining forces means the teams are gaining new skills across disciplines and ensures retention of the field-specific expertise they’re known for. The market is familiar with the strong customer service and support model, from engineering to sales, and that will not change. Teledyne’s arsenal includes hydrographers, physicists, surveyors and GIS professionals, as well as AI specialists, engineers and computer scientists. Going forward, as the market transitions to digital, the skills and expertise needed most in the field are at the intersection of traditional domain knowledge and the diverse aspects of computer science. “There is an evolution underway in industry, and enterprises that can recruit highly skilled teams with expertise across the geospatial spectrum will be the ones to engage with,” suggests Hoggarth. “Our teams are industry professionals who understand both hardware and software and we see this as an opportunity to develop holistic solutions for hydrographic and topographic mapping.”
DELIVERING A COMPETITIVE ADVANTAGE
Teledyne Geospatial will have access to the full range of sonar, Lidar and software solutions, enabling customers to gain full value from their Teledyne investment with the most advanced sensors in both ocean and land environments. “In that respect, we are unique,” notes Hoggarth. “Whilst some providers have topographic sensors with integrated software, even bathymetric Lidar, our software workflow goes much further; others are not involved in the final delivery of data, whereas we have end-to-end capability. This is a huge advantage for our customers who will be able to integrate workflows, create efficiencies and reduce silos. We will reduce the need for separate infrastructure for land and sea since we can support our customers on both. This is strategic for our customers at the business level but also makes life easier in challenging and extreme environments such as the Arctic, for example. This industry acumen means Teledyne Geospatial is the ideal partner for a full range of projects.”
HELPING SURVEYORS TO GET AHEAD OF THE GAME
The role of the surveyor is still evolving rapidly, which calls for a different set of skills – not least due to the transition to unmanned aerial vehicles (UAVs or ‘drones’). “For survey businesses to keep up, they must consider how many pilots they need, whether to hire a land surveyor and what the best Lidar investments might be,” comments Hoggarth. “Hiring a land surveyor will increasingly require knowledge of drone-
Customers benefit from a competitive edge, mapping and delivering data products inside of one workflow. (Image courtesy: Chris Esposito)
based data collection, and our compact Lidar solutions will be particularly relevant for these customers, who would have conducted conventional land-based surveying in the past.” The theme of integration between land and sea continues to emerge: geospatial teams should be interested in the sea as well as the land, covering both green and red lasers. “Why would we map a mountain range, but neglect the river that comes through it?” asks Hoggarth. “Armed with comprehensive data, we can help our customers deliver a broader range of insights on flood prediction, environmental impacts and other services.”
KEY EMERGING INDUSTRY TRENDS
Teledyne Geospatial is anticipating the future of AI technologies with its newly launched Mira AI Marketplace concept. AI can be leveraged to meet new challenges, enabling enterprises to shift from being product-centric to data-centric, introducing possibilities for enterprises to expand their product and service portfolios. This could contribute to business growth and greater client satisfaction due to a wider suite of service offerings and faster project delivery timeframes. “At Teledyne, we recognize the immense expertise within the field and aim to harness this, embedding AI, machine learning and deep learning within a range of our systems and solutions to capitalize particularly on the automatic and data processing benefits offered by AI,” states Hoggarth. There are ample other solutions that will be critical to solving the ever-more complex problems faced by geospatial professionals, such as compact Lidar systems lightweight enough to be deployed on a drone. Surveygrade solutions developed for accuracy and quality will be increasingly essential, and integrated solutions that make life easier for surveyors are a must. Teledyne understands these challenges and has developed workflows that support this, considering key factors including where the data resides and accounting for asset management. “For example, Teledyne Geospatial provides AI for asset management and tracking via the cloud, bathymetric Lidar, building on the natural synergies between CARIS and Optech,” he continues. “The tools and technologies that are available to the hydrographic field are indeed transferable into topographic mapping systems, such as the Galaxy range of sensors that provide superior capability for complex terrain like forestry mapping, for example. These are compact, powerful and precise, even to the level of identifying tree species and differentiating canopies to understand forest floor/undergrowth.”
WHAT TO EXPECT FROM TELEDYNE GEOSPATIAL IN THE YEARS TO COME
Integrated solutions lie at the heart of Teledyne Geospatial. The offering will include turnkey systems, Lidar, sonar, integrated workflows and a range of systems and solutions that support full, precision data collection. Teledyne Geospatial will also work closely with Teledyne Marine, in particular concerning sonar systems; both sonar and Lidar can be logged in CARIS’s recently launched Onboard360 acquisition software. “With Onboard360, our near-real-time and autonomous data acquisition and processing solution, it will become possible to create a common workflow using AI and cloud-native technology,” says Hoggarth. “For example, customers will be able to log data to the cloud with their hardware, streamlining their product timeline. A streamlined workflow for customers is a central, underpinning goal of Teledyne Geospatial.”
NEW PRODUCT DEVELOPMENTS IN THE SHORT TERM
Hoggarth regards software as a key differentiator in combination with customers’ hardware: “We will be releasing new software products in the coming months which will allow users to get the most out of their sensors. One example of this is the recently launched CZMIL SuperNova, which combines Optech’s powerful bathymetric Lidar with CARIS’s comprehensive processing software.” Terratec AS, a leading Norwegian mapping company, has purchased and flown CZMIL SuperNova for airborne survey projects, collecting and processing marine coastal zone base maps and mapping arctic lakes. Working with the CZMIL SuperNova sensor and AI techniques, they conducted automatic discrimination and noise classification capitalizing on the system’s advanced capabilities and software workflow integration.
The company will be presenting itself under the new Teledyne Geospatial banner and revealing CZMIL SuperNova – as well as discussing other upcoming combined solutions – at key industry events including Intergeo in September, Ocean Business in October and GEO Business in November.
ABOUT THE AUTHOR
andy.hoggarth@teledyne.com
FIG E-WORKING WEEK 2021
A Success Story of the New Reality
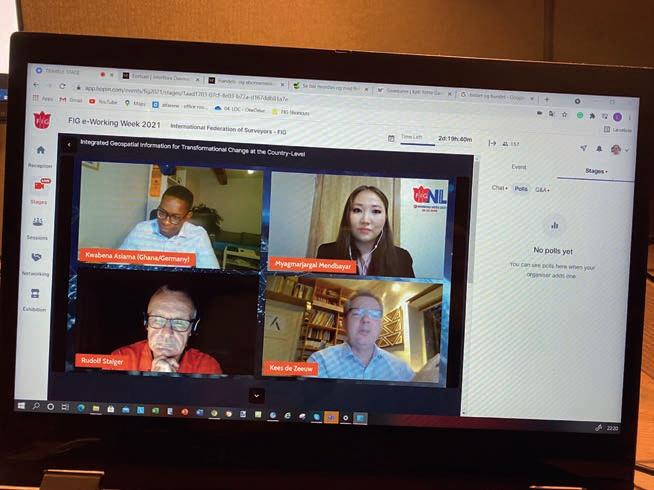
The FIG e-Working Week took place online in late June, hosted by FIG and the Dutch organizing partners GIN, Kadaster and ITC. It brought together over 1,300 participants from all over the world for a week packed with inspiring sessions. The online platform facilitated lively interactions between international colleagues and friends and enabled them to catch up on the latest updates, research and developments. The event can be regarded as a success story of the new reality.
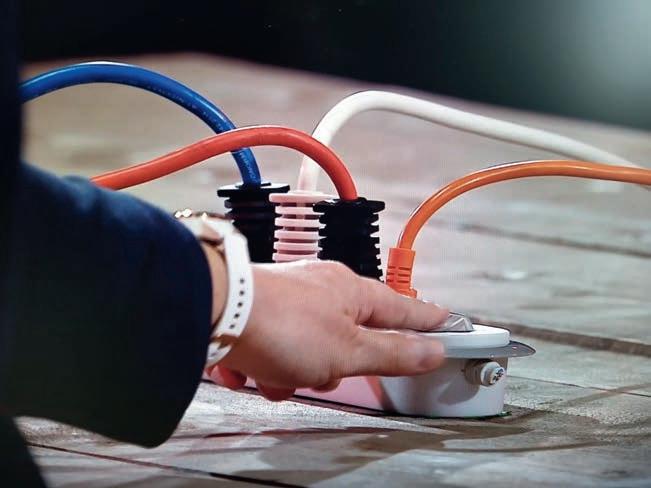
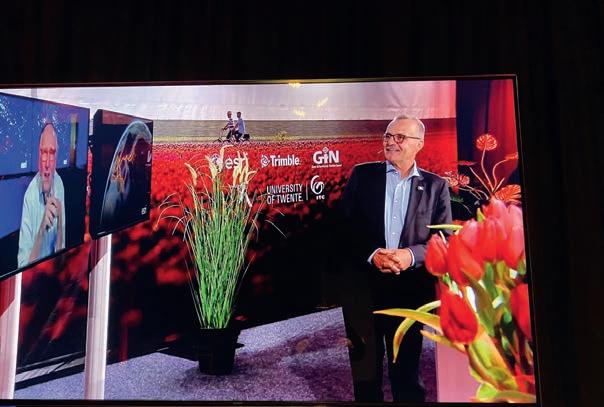
Official opening of the FIG e-Working Week. All partners ‘plugged in’ with the colours of the cables representing the Dutch flag and banner.
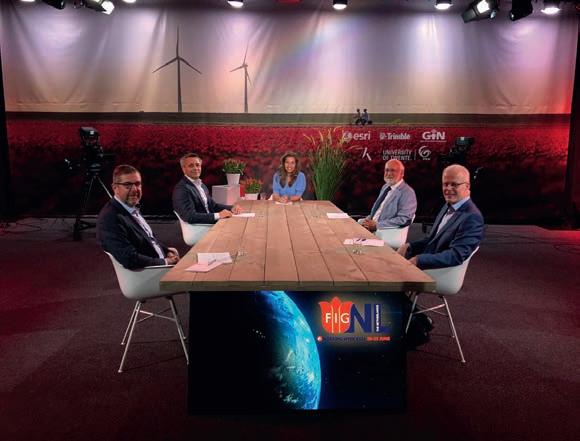
Organizing partners of the FIG e-Working Week 2021: Freek van der Meer (ITC, University Twente), Frank Tierolff (Kadaster), Rudolf Staiger (FIG), Paula Dijkstra & Louise Friis-Hansen (conference directors) and Ron Rozema (GIN).
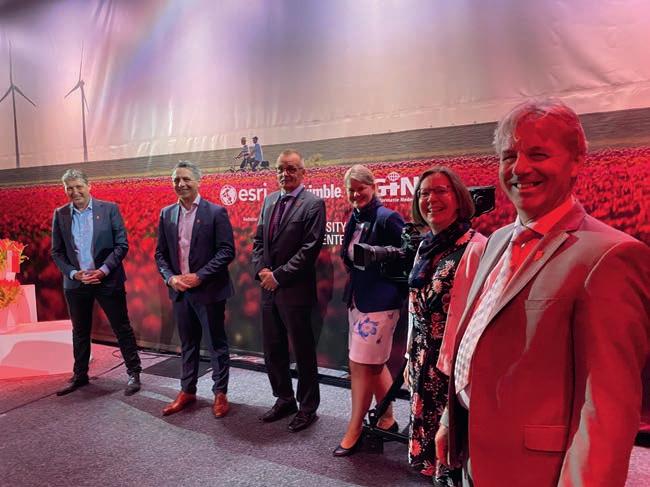
FIG and the Dutch local organizers were keen to not ‘merely’ organize some sessions, but instead to create the sense of a fully-fledged conference to make the participants feel truly part of the surveying community. The current COVID-19 pandemic situation has forced other conference organizers to either connect online or cancel the event. FIG and the local organizing partners embraced the challenge and were motivated to explore the new horizons.
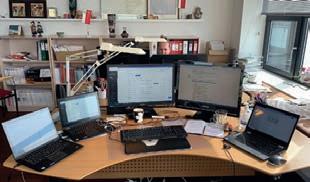
FIG President Rudolf Staiger and Director Louise Friis-Hansen were able to travel to the Netherlands for the occasion. In the Dutch city of Apeldoorn, a studio was set up to broadcast the event, as well as a technical support hub. Another technical hub was set up at the FIG offices in Copenhagen, Denmark, as well as a hub for those who supported from their home offices.
7 INSPIRING KEYNOTES
The event was defined by seven unique sessions. Besides aligning them with the theme of ‘Smart Surveyors for Land and Water Management, Challenges in a New Reality’, the aim was twofold: to create dynamic keynote sessions, and to support diversity. One advantage of the virtual setting was that speakers from around the world, who would normally struggle to travel to events due to their busy schedules, could now make a contribution after all. The use of a professional studio created a dynamic experience for viewers, even when a speaker was broadcasting from their home office.


In total, 27 speakers and chairs were involved in the keynote sessions, representing both the public and private sector as well as academia and NGOs, different regions and generations, and with a good gender balance.
This combination of having high-level speakers on relevant topics, spread out through the event and with a focus on diversity as well as the television-style broadcast gave the keynote sessions an inspiring and professional character. More details of each keynote session will be published over the coming months.
OVER 70 OTHER SESSIONS
The event organizers put a lot of effort into creating and designing sessions that would work in an online setting. Session organizers were informed about the options beforehand and encouraged to include interviews, chats, panel discussions and so on to maximize the dynamism. The online platform supported this, with the option to adapt the layout of speakers and presentation screens.
Of the 335 accepted abstracts, only a few were upgraded for presentation in a session. All authors were given the option to produce a video presentation for publication in the proceedings together with the full papers. All abstracts were connected to a session and were used for reference material, and the authors also had a role in the ‘Ask-meanything’ (AMA) sessions after the actual session.
The FIG e-Working Week was organized as a global event. All time zones were considered, but it was challenging – and not always possible – to accommodate all of them. That sometimes meant that speakers contributed at inconvenient times (e.g. in the middle of the night) or from unusual locations (e.g. the backseat of a car). Many sessions were well attended and numerous viewers actively participated in the chats.
The online system made it easier to move from one session to another as well providing the opportunity to switch between several parallel sessions. Another valuable addition was that all sessions could be easily recorded, so that they could be made available to registered participants after the event.
NEW: A WORKSHOP DAY
Instead of pre-events, the organizers chose to hold a virtual workshop day within the
technical programme. The workshops enabled the participants to take a deep dive into the content of the workshops and allowed more interaction between the workshop hosts, speakers and attendees. Based on the positive feedback, this could become a successful feature for future (virtual) events.
AN EVENT WITH A DUTCH TOUCH
By bringing the Working Week to the Netherlands, the organizers wanted to highlight the role of the surveyor in land and water management, which is a topic close to the nation’s history and future. For centuries, the Dutch have succeeded in building and managing a densely populated coastal country, of which almost half of the land area is below sea level. And that expertise is even more crucial today in the context of protecting the country against the impact of sea-level rise caused by climate change.
Throughout the event there was a Dutch touch. In the opening ceremony the scene was set by the four Dutch members of FIG: GIN, Kadaster, ITC and GIM International. The first three welcomed the participants with opening statements. GIM International prepared a trilogy related to the theme of the event. The importance of integrated land and water management, the added value of cooperation in the triple helix with government, private sector and academia, as well as our joint responsibility to achieve the Sustainable Development Goals were addressed in keynote sessions as well as technical sessions. Several Dutch organizations and leading Dutch experts contributed to the technical programme. The opening ceremony can be viewed from the proceedings.
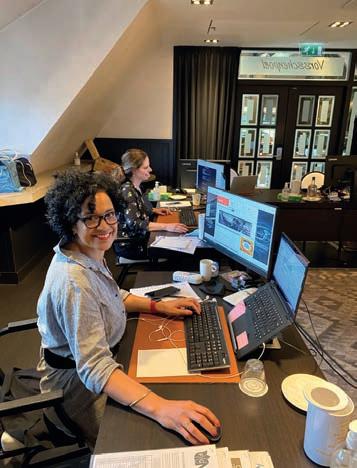
The technical support by the organizing team was also tangible throughout the event, with team members working from early morning until late at night – both on location and from home – to support all sessions and to solve any issues as quickly as possible.
THE BIGGEST DIFFERENCE
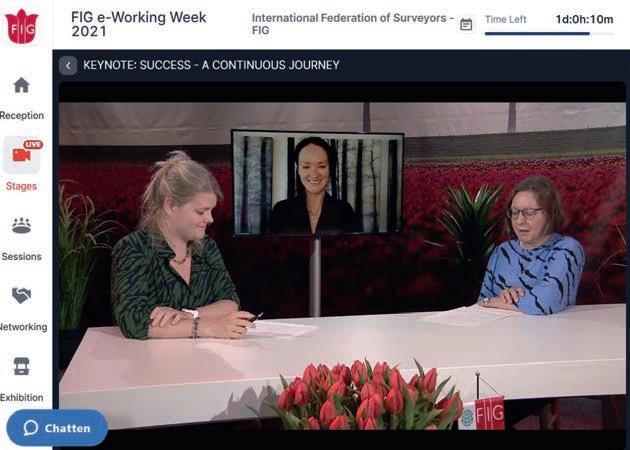
Organizing an entirely virtual event is different, more time consuming in advance and presents more uncertainties than a face-toface event. Nobody within FIG nor the Local Organizing Committee (LOC) had organized a major international online event before. It was new territory and there were no guidelines or manuals to answer questions such as: What Impression of a technical session during FIG e-Working Week.
are the options for a virtual platform? How should sessions be designed? What can we offer to sponsors? What is a reasonable fee? And how many participants can we expect?
The organizers embraced the challenge and extended their virtual horizons, with FIG and LOC working as team. After selecting the platform, the next steps were the redesign of the technical programme, adapting the sponsor opportunities and expanding the support team from 10 to 30 people. It was hard work, with a lot of effort put into creating a balanced programme and engaging the community. The team were convinced that if they provided a solid foundation, the FIG community would bring the spark to light the flame.
Needless to say, there were some challenges throughout the event, but the knowledge and teamwork of FIG and LOC paid off in being able to quickly tackle any issues.
LESSONS LEARNED
In challenging times, the organizers have shown that a virtual event works. It was the perfect solution in the current phase. It demonstrated the added value of staying connected to exchange visions of what

lies ahead and to inspire each other with perspectives and knowledge.
FIG can certainly use the experience gained during this event for future smaller FIG events and meetings. However, it is still crucial to meet face to face once in a while. Spending time together at a gala dinner, going on a technical tour together and simply looking each other in the eyes all help to create a solid foundation for future successes.
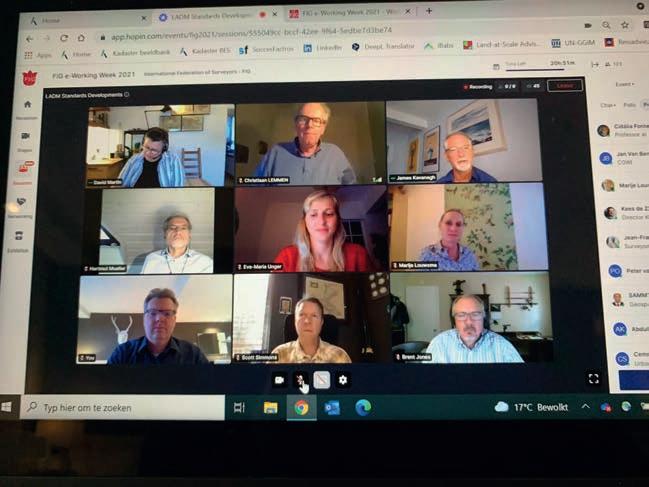
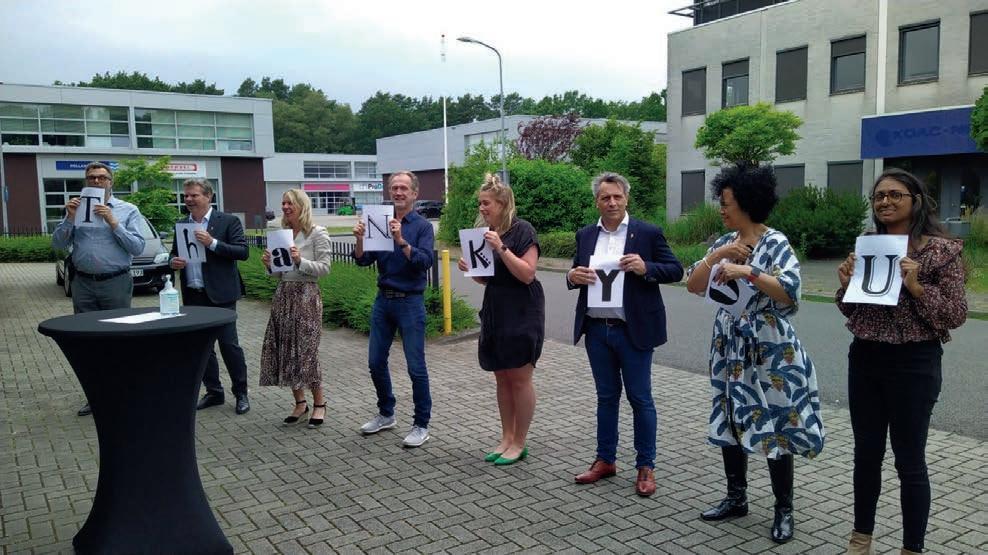
The local hosts look back on the success of the event with a sense of pride. The cancellation of FIG2020 and the acceptance of taking over the organization of FIG2021 from Ghana came somewhat unexpectedly. Nevertheless, they rose to the challenge of hosting the FIG Working Week virtually. Together with FIG, they explored the options and defi ned their goals – both motivated and ambitious to create more than ‘just’ a conference, even though it entail much more work than for a ‘normal’ Working Week. The organizers would like to thank everyone who contributed to the success of the conference. An impression of the support provided by FIG and LOC during the FIG e-Working Week 2021. and LOC during the FIG e-Working Week 2021.


Helpdesk support by Mila Koeva from home.


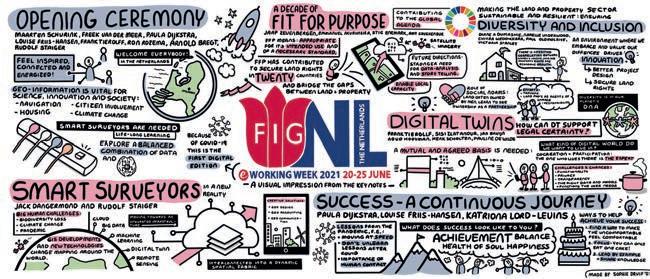
A creative visualization of the keynotes during the FIG e-Working Week 2021.

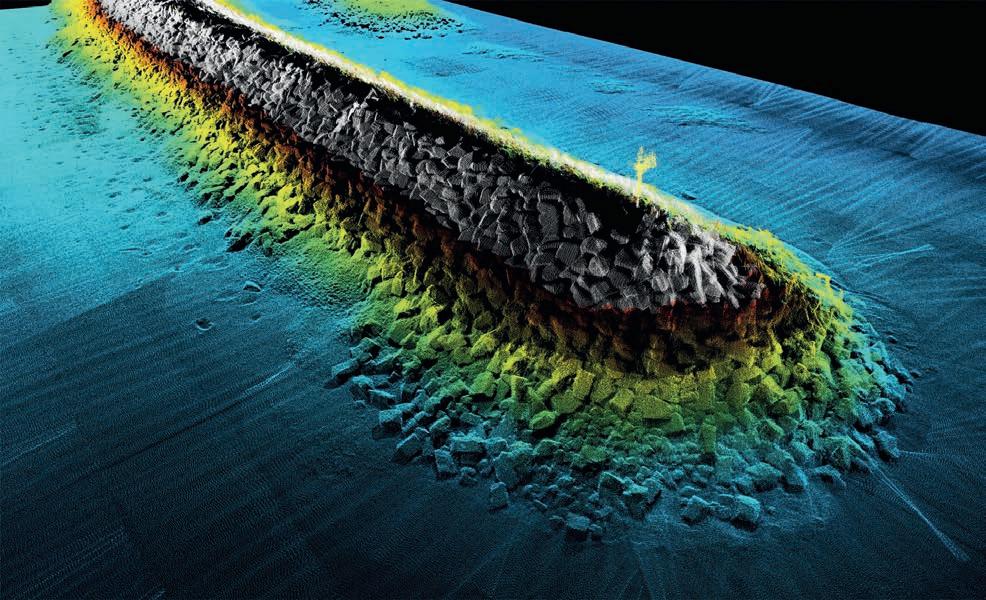
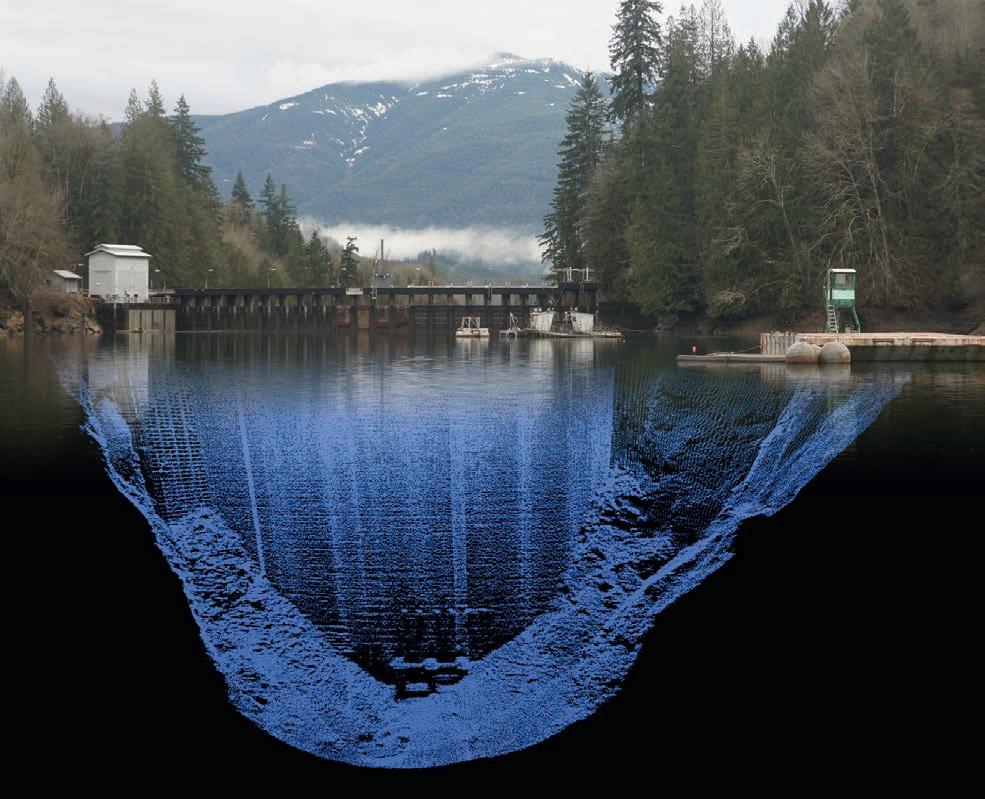
SEASHORE LARGE-SCALE MAPPING ACCELERATION USING LIDAR BATHYMETRY
Towards a Coastline Base Map in Indonesia
The accuracy of coastline data in Indonesia could be much improved by making use of Lidar bathymetry technology. In this article, the authors describe how Lidar bathymetry survey techniques were applied to a section of coastline in the Sunda Strait.
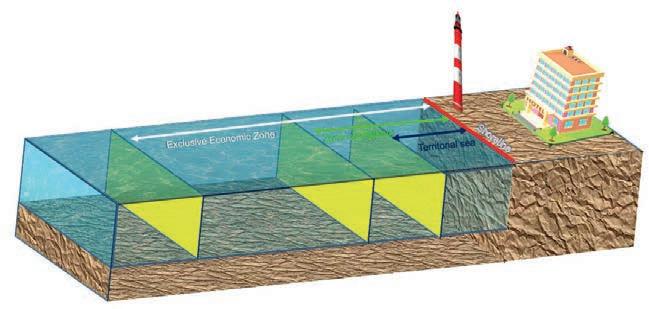
The determination of a sea or coastal area depends on the availability of coastline data, as it is based on the coastline reference (see Figure 1). The definition of the area of Indonesia’s sovereignty could be improved if it were based on accurate coastline data. Unfortunately, a coastline base map at a scale of 10,000 was only available for about 8% of the total of 108,000km of coastline in Indonesia in 2019. Shoreline data was therefore generated by integrating elevation data in a digital elevation model (DEM) for land and sea that was obtained by topographic and bathymetric surveys. However, the topographical conditions in Indonesia are unique, with shallow water characteristics. Furthermore, some of the coastal areas are inland seas that are difficult to access using technologies such as sounding sensors. An alternative method is therefore needed to accelerate the availability of coastline data in Indonesia that utilizes Lidar technology for bathymetry survey activities. Improving the availability of coastline data on a large scale is expected to benefit the national economy, in particular the maritime sector.
AIRBORNE LIDAR BATHYMETRY
Lidar is part of a remote sensing system that uses active sensors and that works by comparing the characteristics of the transmission signal with its reflection; namely, the differences in pulse propagation time, wavelength and angle of reflection. In the Lidar bathymetry application, the laser used is a green light that can penetrate to the bottom of the water. When the laser hits the surface of the water, part of the laser wave is reflected and refracted in all directions and another part penetrates the water. The basic principles of Lidar bathymetry are shown in Figure 2.
ACQUISITION OF LIDAR BATHYMETRY IN INDONESIA
To accelerate the availability of national coastline data, airborne Lidar bathymetry was conducted in 2020 around the Sunda Strait. A differential positioning method was used to provide an aircraft position with an accuracy of 10cm. All resulting positions were referred to the geodetic datum in Indonesia, SRGI2013. The altitude used was about 600m, and the distance between flight lines
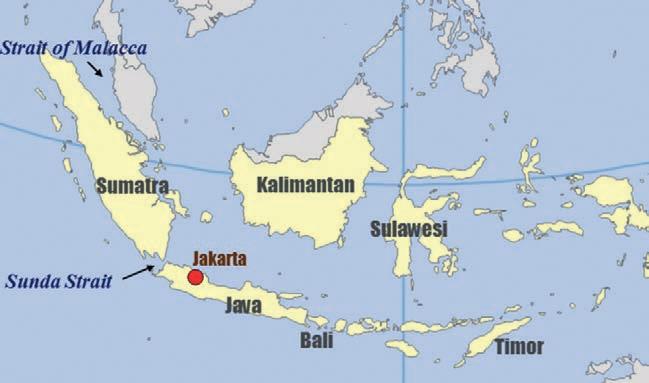
The Sunda Strait – connecting the Java Sea to the Indian Ocean – is the strait between the Indonesian islands of Java and Sumatra.
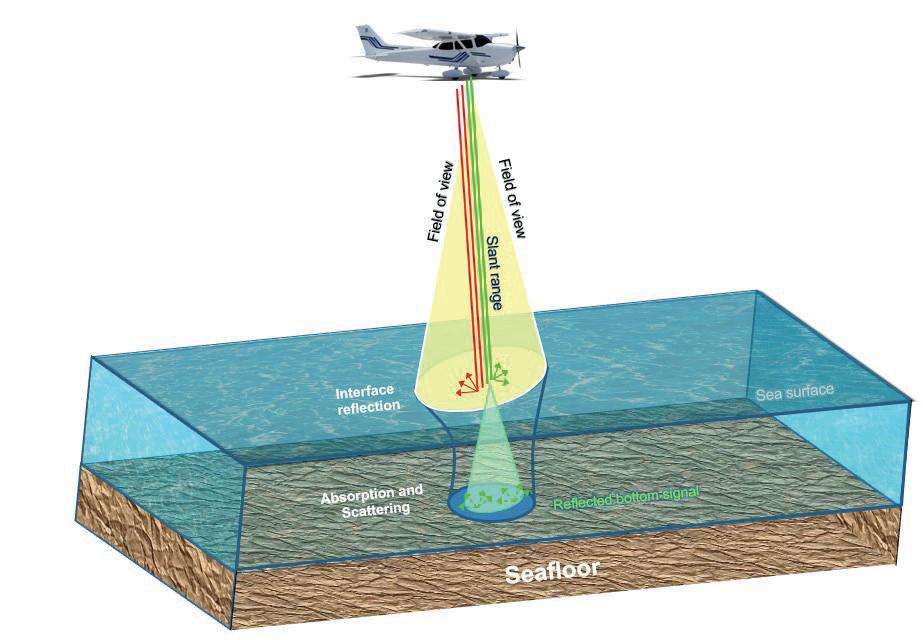
Figure 2: Basic principles of Lidar bathymetry.
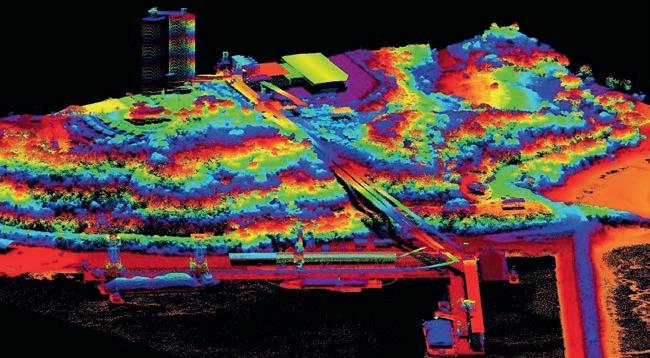
Figure 3: Extraction of DEM data from the results of Lidar bathymetry measurements.
was 280m. A higher altitude can effectively increase the coverage area while maintaining the density of the point clouds, and Lidar acquisition can be carried out over a large area in a single flight. The capacity of the Lidar bathymetry acquisition was around 145km per day, with a total mapped coastline of 1,000km. Acquisition of Lidar bathymetry in the Sunda Strait reached a depth of up to 5m, because the measurement location was not fully in clear water. In this case, the Lidar bathymetry acquisition took just two months to complete the entire Area of Interest (AoI). Based on this capacity, the Indonesian archipelago could be mapped quickly; however, the biggest difficulty during data acquisition was the rainy season in the area around the Sunda Strait.
There are other difficulties in southern Java, as the region is dominated by high waves (high wave regime domination). In bathymetry surveys, the surface of the water is considered to be a horizontal plane of reflection where the laser beam refracts into the water based on the off-nadir beam angle. If the surface ripples, the laser will be refracted in all directions, changing
the angle of incidence of the laser beam. This makes it difficult for laser to penetrate to the bottom of the water in such areas. The geometry of the beam path refracted from the laser under water therefore depends on the conditions of the water surface plane above it. An illustration of the DEM data extracted from the Lidar bathymetry measurement results can be seen in Figure 3. As this shows, objects around the coast can be mapped in detail, including the water area.
LEVEL OF DETAIL OF AIRBORNE LIDAR BATHYMETRY
Lidar bathymetry uses infrared to produce land topography and green lasers to obtain the seabed. Therefore, Lidar bathymetry can produce a single seamless land and sea DEM, which greatly facilitates the data integration process as the resulting DEM is based on the same reference system. In addition, Lidar bathymetry can be conducted in areas such as shallow waters or coral reefs, which are difficult to survey using acoustic sensors, as can be seen in Figure 4. Figure 4 also shows that shallow water areas with corals are depicted very clearly using Lidar bathymetry, in contrast to multibeam which results in less detailed seabed mapping. Lidar bathymetry therefore produces high-resolution DEM data, making the extraction process of the shoreline easier.
EFFECTIVENESS OF AIRBORNE LIDAR BATHYMETRY
Sounding technology has a capacity of about 50 line km per day when acquiring marine DEM data. Furthermore, the integration of marine and land DEM requires a time-consuming topographic measurement, and problems arise during the DEM integration process between land and sea due to the use of different technologies and different measurement conditions when collecting the data. In addition, there are problems due to the differences in the references used, so that the DEM elevation values are not the same. Although the depth results using a sounding sensor are very accurate, the sounding sensor cannot be used in shallow waters and inaccessible areas.
Lidar bathymetry can, however, acquire data over a large area in a single flight,
making it highly efficient in terms of time. Its capacity for mapping coastlines is up to about 145 line km per day. For this reason, Lidar bathymetry is able to almost halve the survey time compared with the technology currently used. With such a capacity, the use of Lidar bathymetry for hydrographic survey activities provides many benefits, especially
in terms of data acquisition cost efficiency. Therefore, Lidar bathymetry technology is very much worth considering as a method for and part of the coast) were compared with field measurements using precise GNSS tools. The accuracy test was therefore carried out
around the coast and in water areas that can be accessed using GNSS geodetic devices. The results of the accuracy evaluation show that the accuracy of the Lidar bathymetry measurement is 0.3m with a 90% confidence level. These results are in accordance with vertical accuracy standards in Indonesia. Lidar bathymetry results can therefore be used to produce maps at a scale of 1:5,000.
accelerating the availability of a large-scale coastline map in Indonesia.
ACCURACY ASSESSMENT OF LIDAR BATHYMETRY
An evaluation of accuracy was carried out to compare the accuracy of the DEM with the Lidar bathymetry measurement results. Furthermore, the z coordinates (both on land

Figure 4: The level of detail of Lidar bathymetry measurements compared to multibeam echosounders (acquisition area Kolaka, South Sulawesi).
CONCLUSION

Lidar bathymetry surveys are very effective in shallow water locations and inaccessible areas, such as in archipelagic areas in Indonesia. Another advantage is that Lidar bathymetry produces seamless DEM, making it easy to integrate land data with marine data. In addition, the high altitude flight range of the aircraft means that the Lidar bathymetry survey has a large coverage area in a single flight. These advantages can help to accelerate the availability of a coastline base map in Indonesia.
It should be noted that the success of a bathymetry Lidar survey is highly dependent on the ability of the green laser to penetrate the water column. For this reason, bathymetric Lidar surveys depend on environmental conditions such as water turbidity, the water surface plane and weather conditions. Lidar bathymetry is therefore highly suitable for use in areas of Indonesia with clear and calm waters that are influenced by non-dominant sediment processes. However, the penetration ability of the Lidar bathymetry system to the bottom of the water column decreases in coastal areas with poor water quality, so that data collection needs to be done using sounding sensors and terrestrial methods. This combination of technologies obtains maximum results.
The original version of this article appeared in Hydro International, a sister publication of GIM International focused towards the hydrographic profession.
ABOUT THE AUTHORS
Agung Syetiawan is a researcher in the Geospatial Information Agency of Indonesia. He received his Master’s degree in Geodesy and Geomatics Engineering from Bandung Institute of Technology, Indonesia. His research activities include oceanography, UAV and GNSS processing. agung.syetiawan@big.go.id
Herjuno Gularso is a mapping surveyor at the Center for Marine and Coastal Environment Mapping at the Geospatial Information Agency. He received a Bachelor’s degree in Geodesy Engineering from Diponegoro University. His research activities include UAV, photogrammetry and shoreline extraction.
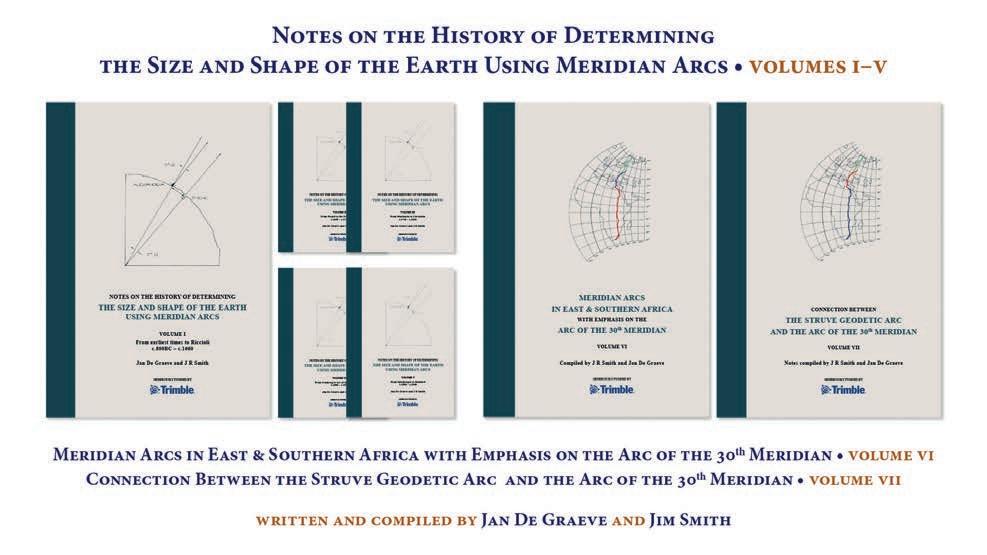
Three Milleniums of Measurement of Earth: A Special Edition Box Set
FIG, FIG Foundation and Trimble proudly introduce a Special Edition box set of seven outstanding books on the history of surveying. The books, comprising 3,000 pages and over 350 illustrations, represent life-long research and work by Jim Smith and Jan De Graeve. Both are FIG honorary members and founders of The International Institution for the History of Surveying and Measurement (IIHS&M) – a permanent institution within FIG. Their research represents 35 years of dedication, perseverance and extensive research. Richard Wonnacott, South Africa, has assisted Jim and Jan and has also proof-read all volumes.
VOLUMES I-V: NOTES ON THE HISTORY OF DETERMINING THE SIZE AND SHAPE OF THE EARTH USING MERIDIAN ARCS
Jim Smith and Jan de Graeve have compiled the methods used by mankind over a period of approximately 2,760 years to determine the size and shape of planet Earth. Jan and Jim take the reader through the efforts of the early Babylonian, Egyptian, Indian and Greek astronomers and the work of the 3rd-century BCE Greek mathematician, Eratosthenes, who estimated the circumference of the Earth with remarkable accuracy using the shadow cast by the sun and known latitudes of places in Egypt. They then come to the arc measurements in Europe, Lapland, Peru, Eastern Europe, India, South Africa and many others and end in the 1950s, before the introduction of electronic computers and distance measuring devices and satellite navigation systems.
VOLUME VI: MERIDIAN ARCS IN EAST & SOUTHERN AFRICA WITH EMPHASIS ON THE ARC OF THE 30TH MERIDIAN, AND VOLUME VII: CONNECTION BETWEEN THE STRUVE GEODETIC ARC AND THE ARC OF THE 30TH MERIDIAN
Although these two books can be considered as two separate volumes, they are in fact companions. These books give a feeling for the magnitude of the task to measure what turned out to be the longest terrestrial measurement covering an amplitude of approximately 105° or 11,635km from Hammerfest in Norway to Port Elizabeth in South Africa. The second of these two volumes, as the title suggests, only covers the connection between the Struve Arc and the Arc of the 30th Meridian in Africa.
It is important to note that, through the efforts of FIG IIHS&M, the Struve section of Arc became a UNESCO World Heritage Monument called Struve Geodetic Arc in 2005, and that efforts are in place to get that extended eventually to the south end of the 30th Arc, i.e. South Africa.
Sadly, Jim Smith passed away on 12 August 2021, before he could hold the books in his hands. He was however vividly involved in the printing preparations and was looking forward to the launch of the books. The printing of these remarkable books has eventually become possible generously sponsored by Trimble by initiative of FIG Foundation President John Hohol. All proceeds from the sale of these books will therefore be donated to the FIG Foundation so it can continue and further grow its charitable activities in helping to build a sustainable future.
Only 100 Special Edition sets of the seven volumes have been printed. To find out more about how to secure one of these sets for yourself, go to: https://fig.net/news/ news_2021/08_History-of-Surveying.asp
Louise Friis-Hansen
More information
www.fig.net
2021 Digital Edition of the XXIV ISPRS Congress Completed Successfully
The 2021 edition of the XXIV ISPRS took place online from 5-9 July 2021. While the 2020 digital meeting was basically a set of scientific presentations, this year’s event had nearly all features of a complete congress. In particular, the event included an opening session, a total of seven exciting keynotes demonstrating the breadth and scientific depth of our field of work, and various awards ceremonies to honour those who have showed truly outstanding performance which has a lasting impact. A live science track with the best congress submissions, interactive poster sessions and a technology track as well as a digital exhibition demonstrated the latest progress in our field, in both science and development, in academia and in industry. Two fora brought together different stakeholders, from within and beyond ISPRS, to discuss some of the most important applications of photogrammetry, remote sensing and geospatial information. Lastly, on Friday, a geo-lecture day with various one-hour tutorials was held, which attracted a large number of participants as well.
Earth observation, space imagery and their use for science and society at large was a major topic of a number of keynotes. Emanuel Flory from Airbus introduced the Pléiades Neo constellation with four satellites, exhibiting a spatial ground resolution of 0.3m. Airbus also asked ISPRS to organize an independent working group to independently assess the quality of the Pléiades Neo imagery and to report its results at the Nice Congress in summer 2022. Space imagery was also at the centre of the presentation by Claudio Almeida from the Brazilian Space Agency INPE. Claudio presented the large and successful efforts INPE has carried out during the last two decades to document and monitor vegetation and deforestation in the Amazon and other parts of Brazil. A.S. Kiran Kumar, the former chairman of the Indian Space Research Organization ISRO, reported on the Indian space programme and demonstrated its sustained success in linking the latest technology with the needs and desires of the common man. Sara Gallagher, an advisor to the Canadian Space Agency, discussed the important role of Earth observation for sustainable development and presented Canada’s contributions to space imagery, the Radarsat satellite and the new Radarsat constellation.
TECHNOLOGICAL ADVANCEMENTS
The relationship of photogrammetry, remote sensing, spatial information sciences and computer vision/computer graphics and their link to artificial intelligence, machine learning and big data were other overarching topics of the digital event at large and of the keynotes in particular. Marc Pollefeys from ETH Zürich discussed new possibilities of the
Hololens, a portable device to interactively mix human and virtual vision resulting in new and fascinating augmented reality applications. Christoph Stiller, Karlsruhe Institute of Technology, presented the current status of autonomous driving and, in particular, pointed out the relevance of geospatial data in this context. Predicting safe traffic actions is only possible with precise knowledge of the geometry of the lanes ahead, combined with traffic rules and thus admissible actions to be expected by other traffic participants.
Lastly, Chenghu Zhou from the Chinese Academy of Sciences demonstrated the contribution of geospatial sciences and geospatial data in documenting, mitigating and overcoming health pandemics such as COVID-19. He clearly showed that mapping the distribution of the disease over time, detecting spatial and temporal infection patterns, investigating chains of infection, determining and tracking physical distances, as well as predicting future outbreaks based on mobility data all critically depend on data and tools made available by our community.
This topic was also at the centre of one of the fora, organized by Fazlay Faruque, University of Mississippi, and Laurent Polidori, Federal Rural University of Amazonia (formerly CESBIO/CNRS Toulouse) on ‘Geo for Pandemics’. Experts from space agencies, the health sector and the geospatial field from around the world presented and discussed the overlap of the different fields in an attempt to define a roadmap for ISPRS to follow in the years to come.
TRANSFORMATIONAL CHANGE
The second forum, entitled ‘Towards Transformational Change: Potential Contributions of ISPRS and the Role of the Youth in Sustainable Development’, was organized by the ISPRS Student Consortium under the leadership of Sheryl Rose Reyes, University of the United Nations, together with Adele Roccato and Pierre Boileau, both from the United Nations Environment Programme (UNEP). It featured, in particular, UNEP’s GEO-6 for Youth report, principally addressing the young generation and showing ways to limit and mitigate the effects of climate change.
During the first three days, the meeting featured a live track with the best papers accepted by the five ISPRS commissions after a rigorous double-blind peer-review process. In addition, pre-recorded videos of all accepted submissions were constantly available during the event. While, as usual, the papers are published in the ISPRS Annals and Archives proceedings series, the videos will be added to the ISPRS Media Library in the near future and will thus also be available to the community. These videos form one new set of ISPRS assets, developed in and due to the pandemic crisis. Another advantage of the online meeting was that participants around the world were able to join the congress, as there were of course no travel and accommodation costs, and the registration fee was kept to the absolute minimum; it was only necessary to have access to a suitable internet connection. As a result, scientists, practitioners and students from around the world, who would never have had a chance to participate in a traditional-style ISPRS meeting, were able to join the digital edition of the congress. This digital edition attracted 670 participants in all, with up to 470 per day.
IN PERSON
Nevertheless, networking and informal communication, which is another key part of such meetings, were not possible in the same way as when meeting in person. Therefore, we would like to wholeheartedly invite you to attend the face-to-face edition of the XXIV Congress next summer and we do hope to see you in Nice from 6-11 June 2022.
Christian Heipke, ISPRS president Nicolas Paparoditis, ISPRS congress director
More information
www.isprs2020-nice.com