24 minute read
3DNL – The Netherlands from Every Angle
Cyclomedia collaborates with Hexagon to create fi rst-of-its-kind photorealistic 3D model of an entire country
3DNL – The Netherlands from Every Angle
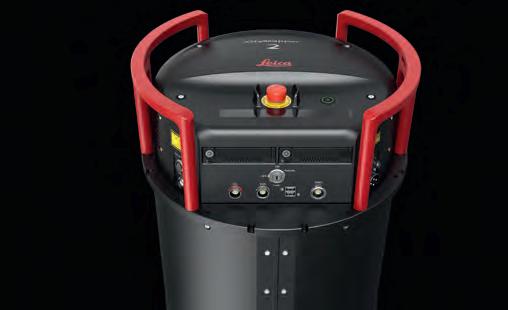
Smart digital realities that replicate real-life geoinformation provide valuable insights and support the analysis and interpretation of infi nite data inputs from the real or digital world. They can be used to improve work processes and planning for commercial and government customers. 3DNL is a fi rst-of-its-kind photorealistic digital twin of the entire Netherlands. It is based on airborne imagery and Lidar data, collected with a Leica CityMapper-2 aerial sensor and made accessible through Cyclomedia’s Street Smart web viewer hosted on HxDR, Hexagon’s cloud-based storage, visualization and collaboration platform.
3D DIGITAL REALITIES ARE CHANGING THE GAME
Cyclomedia has provided 360-degree streetlevel visualizations, collected with a patented vehicle-mounted camera, for decades. Since 2018, a Lidar sensor has been added to the proprietary mobile mapping system. These comprehensive ground-based data sets enable the extraction of light poles, manholes and an array of other features, providing insight for many municipal management and planning applications and other commercial activities. Aware of the increasing demand for 3D data and wanting to maintain its position as a preferred aerial content supplier, Cyclomedia recognized the benefi ts of creating an innovative hybrid data set, offering both price and product delivery advantages. By creating 3DNL, the company has produced a multipurpose digital twin. As well as its direct use in Street Smart, the 3D data can also be streamed or downloaded for use in third party applications. “We are making a big impact by creating a new way for customers to interact with data and develop insights to create smarter cities, achieve more effi cient construction, and derive information from the data to provide knowledge,” says Thomas Pelzer, product manager, Cyclomedia. “The Netherlands is our primary market for making a photorealistic 3D model with an aerial perspective and for testing the market’s response to this new proposition.” Leica CityMapper-2, the state-of-the-art hybrid airborne sensor, is perfectly suited for effi cient and accurate urban mapping. The simultaneous acquisition of oblique imagery and Lidar point clouds produces perfectly registered consistent data. The narrow fi eld of view minimizes occlusions while the oblique scan pattern captures building facades from all angles. One fl ight instead of two reduces the environmental impact, decreases the cost of data acquisition, and takes advantage of limited fl ying windows. However, the most important benefi t of using a hybrid system lies in the quality of the data products. Image-only systems struggle to provide accurate data in shadows, urban canyons and under vegetation. The Lidar
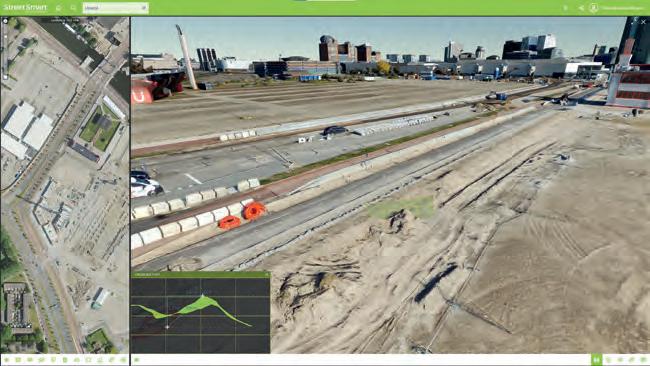
3DNL cross section measurements of construction site.
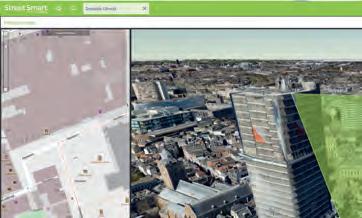
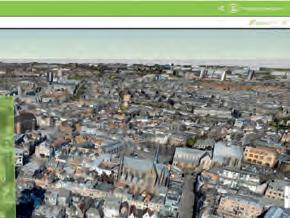

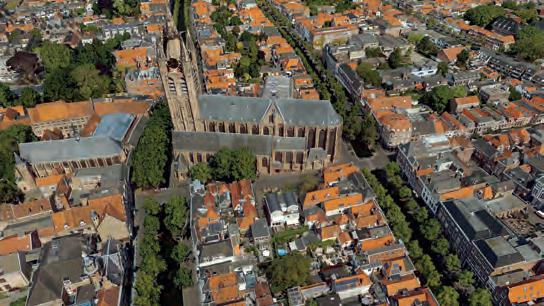
3DNL mesh of the Old Church in Delft. 3DNL mesh of Utrecht railway station.
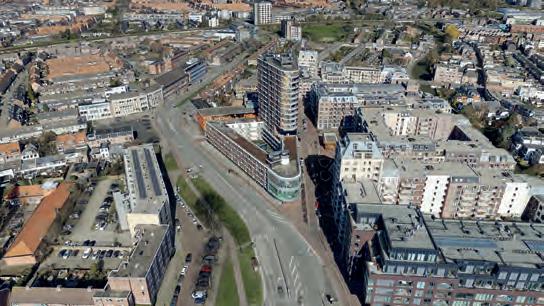
data perfectly complements image data to fill the gaps. As an active sensor, it does not require light to create accurate data points and can provide returns from underneath vegetation. At the same time, the image data is crucial for the generation of textured 3D models. A hybrid sensor provides more information, more accurate measurements and smoother surfaces in the mesh. “Adding a Lidar sensor to an oblique camera, as found in the Leica CityMapper-2, is a game changer. We have a strong preference for hybrid data and there are many advantages to joining forces on acquisition and development with a large global corporation such as Hexagon,” says Pelzer. “We are always looking for new ways to bring best-inclass products to market and Hexagon shares our enthusiasm for innovation.”
UNMATCHED 3D MESH QUALITY
To capture the Netherlands in its entirety under favourable conditions, Cyclomedia partnered with Hexagon to capture aerial data each year between February and October and produce the best data set possible. After processing with Leica HxMap software, the aerial imagery and Lidar data as input was converted into a mesh and added to 3DNL. The 3D data is hosted on HxDR and fully integrated in Street Smart. HxDR enables the geospatial data and software to be visualized by users worldwide. “The geometrically accurate 3D maps and models within 3DNL can be used in many applications by utilizing Street Smart’s functionality,” says Chantal Brick, marketing manager, Cyclomedia. “HxDR adds flexibility by working with us to accommodate Cyclomedia’s technical needs.” Cyclomedia’s Street Smart viewer provides a simple way to access the hosted data set and includes a visualization tool plus other key features and functionality such as shade analysis, BIM models, cross-sections and measurements. It also supports the virtual collaboration of project stakeholders in any field. The high-quality 3DNL data set is instantly available to users. Cyclomedia provides customers with access to the complete comprehensive 3D database through a subscription. Therefore, the data is not only virtually accessible, but also economically accessible to anyone with a need or desire to work with 3D data. The product is certainly less expensive than contracting a custom collection and 3D mesh creation.
PRACTICAL APPLICATIONS
Hexagon and its partners have made great strides towards creating a digital environment in which stakeholders and citizens can plan, visualize and simulate developments. Tasks such as importing CAD and BIM data, importing reality capture data, automesh of reality capture data, virtual tours and flythroughs, annotations and photosphere locations are possible. The broad range of applications appeals to government and commercial customers. For example, a solar company may download the model of a specific house, calculate the pitch and slope, create a solar plan and present a proposal to the house owner. Construction and engineering companies can download an area of interest, design a new build and determine the most efficient access and logistics for the construction phase. A governmental agency may calculate how many trees are in a neighbourhood and plot heat pockets and perform shade analysis. “There is great value in being able to visualize every aspect of a new structure and seeing how it fits with existing features before beginning construction,” explains Brick. “For example, local citizens can see how a wind turbine will look and better understand its impact on the community while working through the approval process.” The collaboration of Cyclomedia and Hexagon on this groundbreaking 3D digital twin project demonstrates the potential for the large-scale simultaneous collection of imagery and point clouds with the Leica CityMapper-2. “We envision 3D to be part of a solution to accommodate users in a variety of work processes that need highly accurate data, as we offer through reality capturing,” says Pelzer. “We’re continuing to improve on the quality of both the input and the output data, and to leverage the classification of the point clouds to identify objects in the mesh models. By producing multi-use data sets, a variety of sectors such as local government, construction and engineering, infrastructure, and wind and solar energy all benefit from better information. Our longterm goal at Cyclomedia is to expand into other geographic areas with 3D, while a next milestone will be to systematically combine aerial and street-level content.”
MORE INFORMATION
cyclomedia.com hexagon.com
Phase One cameras and aerial systems
High-resolution medium format and large format cameras, drone payloads and aerial camera systems designed for aerial photography, inspection, mapping and surveying.
PAS 880
880MP large format nadir & oblique system Delivering superior productivity
PAS 280
280MP large format system Achieving your mission objectives in just one flight
P3 Payload
100MP payload solution with unmatched productivity For DJI M300 and Mavlink supported drones
iXM Camera series
150MP and 100MP high resolution cameras For mapping and inspection
Discover more at geospatial.phaseone.com
The monitoring of submerged deadwood and vegetation is gaining increased attention due to their socioeconomic and ecological importance. Deadwood acts as an important underwater habitat but also poses a threat to bridges, hydroelectric power plants and riverside buildings. Underwater vegetation, in turn, is a proxy for climate change in general and global warming in particular. In this context, UAV-borne topobathymetric laser scanning constitutes a promising tool for accurately capturing and modelling these small-scale objects in high spatial resolution.
Alluvial forests surrounding natural rivers constitute an ecologically important and sensitive habitat. Seasonal fl ood waves carry deadwood into the active river channels, where it fl oats downstream until either natural or artifi cial barriers (river bends, bridge piers, hydropower stations, etc.) stop its movement. Such stranded driftwood plays an important role in aquatic ecosystems, for example as a shelter for juvenile fi sh stages, but log jams can also damage infrastructure and residential areas. In addition to deadwood, the monitoring of littoral vegetation (i.e. submerged vegetation down to a depth where sunlight can penetrate to support photosynthesis) is gaining ever more interest, as such vegetation acts as a proxy for climate change. Submerged macrophytal vegetation reacts in a very sensitive way to increased water temperature and other parameters induced by global warming. Therefore, the monitoring of the volume and distribution of driftwood in rivers and lake outlets and of littoral vegetation is an important topic from both an ecologic and socio-economic point of view.
GAME CHANGER
Topobathymetric Lidar is an established tool for mapping the littoral zone of coastal and inland water areas. Bathymetric Lidar uses short laser pulses in the green domain of the electromagnetic spectrum to measure objects above and below the water table. Compared to topographic sensors that use infrared laser radiation, bathymetric sensors employ a large beam divergence, which results in typical footprint diameters in the range of about 50cm for data acquisition from manned platforms. This, however, hampers
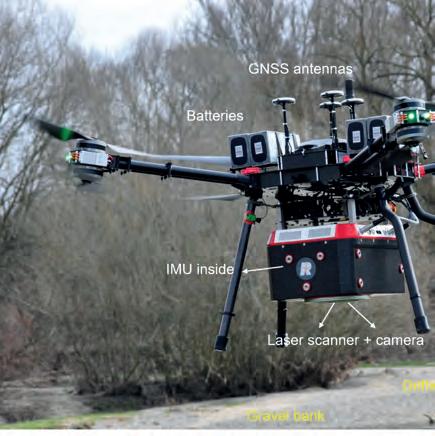
Figure 1: RIEGL VQ-840-G topobathymetric laser scanning system mounted on Skyability Octopcopter UAV in front of Pielach River study area.
the detectability of submerged logs and branches, especially for stem diameters of less than 30cm. The advent of UAV-borne topobathymetric Lidar sensors has changed this situation fundamentally, as these systems provide small laser footprint diameters of around 10cm and a high laser pulse density of > 200 points/m2 .
In this article, we present the early results of detecting and modelling submerged driftwood and vegetation based on 3D point clouds acquired with a survey-grade UAV-borne topobathymetric laser scanner. We demonstrate that stems, branches and littoral vegetation are recognizable in the point cloud. The achievable point density and measurement precision furthermore allow the derivation of relevant parameters such as the length and diameter of driftwood logs and the vegetation height of macrophyte patches. This enables the quantitative analysis of submerged biomass at a high spatial resolution.
SENSOR
The RIEGL VQ-840-G is an integrated topobathymetric laser scanning system including a factory-calibrated IMU/GNSS system and a camera, thereby implementing a full airborne laser scanning system (see Figure 1). The lightweight, compact VQ-840-G Lidar can be installed on various platforms, ncluding unmanned aerial vehicles (UAVs or ‘drones’). The laser scanner comprises a frequency-doubled IR laser, emitting pulses
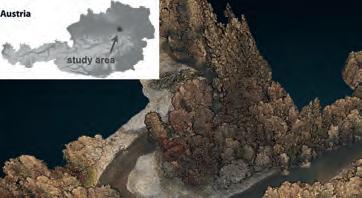
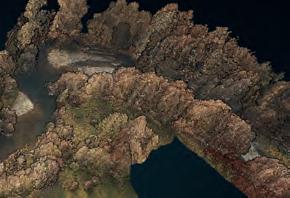
Figure 2: Pielach River study area; 3D topobathymetric Lidar point cloud coloured with simultaneously acquired aerial RGB images.
of about 1.5ns pulse duration at a wavelength of 532mrad and a pulse repetition rate of 50-200kHz. At the receiver side, the incoming optical signals are converted into a digitized electrical signal. The laser beam divergence can be selected between 1–6mrad to allow a constant energy density on the ground for different fl ying altitudes and therefore balancing eye-safe operation with spatial resolution. The receiver’s iFOV (instantaneous fi eld of view) can be chosen between 3 and 18mrad. This allows the balancing of spatial resolution and maximum depth penetration.
The VQ-840-G employs a Palmer scanner that generates a nearly elliptical scan pattern on the ground. The scan range is 20° x 14° along the fl ight direction, which means that the variation of the incidence angles hitting the water surface is low. Onboard timeof-fl ight measurement is based on online waveform processing of the digitized echo signal. In addition, the digitized waveforms can be stored on disc for offl ine waveform analysis. For every laser shot, echo waveform blocks with a length of up to 75m are stored unconditionally (i.e. without employing prior target detection). This opens up possibilities such as waveform stacking, variation of detection parameters or waveform analysis algorithms. The depth performance of the instrument has been demonstrated to be in the range of more than two Secchi depths for single measurements.
STUDY AREA AND DATASETS
The study area is located at the tailwater of the pre-Alpine Pielach River, a tributary of the Danube River in Lower Austria. The study site is located in a Natura 2000 natural conservation area and the gravel bed river features a meandering course with frequent geomorphic changes in response to fl ood peaks. The mean width of the river is around 20m with a mean annual discharge of 7m3/s and a maximum depth of around 3m, allowing full coverage of the entire river bottom with topobathymetric Lidar. Alluvial vegetation (trees, bushes, shrubs) often reaches from the shore into the wetted perimeter, leading to the frequent input of wooden debris into the river. In addition, larger fl ood peaks transport driftwood logs from upstream into the study area, where the logs often remain for a longer period before drifting further downstream with the next fl ood peak.
The subsurface of the adjacent fl ood plain is dominated by river gravel, which was quarried in the past, leaving around a dozen groundwater-supplied ponds with a maximum depth of 5.6m and featuring patches of underwater vegetation. The occurrence of complex bathymetry as well as the presence of submerged driftwood and littoral vegetation makes the site an ideal study area for UAV-borne topobathymetric Lidar.
The area has been surveyed twice with the RIEGL VQ-840-G in the recent past. In November 2021, the scanner was mounted on an octocopter UAV operated from 50-60m above ground level with a beam divergence of 1-2mrad, providing footprint diameters of around 1dm, and with a pulse rate of 50kHz and 200kHz. A simultaneous UAV-based photogrammetry fl ight mission served as a basis for colouring the Lidar point cloud (see Figure 2). In February 2022, the same instrument was mounted on a helicopter platform. While the aim of the UAV-borne acquisition was maximum spatial resolution to detect submerged logs and branches, the focus of the helicopter integration was to maximize the penetration depth. For this reason, a larger beam divergence of 5mrad was used together with a receiver FoV of 9mrad, delivering full bottom coverage of the surveyed ponds alongside additional vegetation heights.
METHODS AND RESULTS
The processing pipeline mainly followed the standard bathymetric Lidar workfl ow. After strip alignment and georeferencing, we modelled a continuous water surface model from all air-water interface Lidar refl ections and performed run-time and refraction corrections of the raw measurements. The corrected points served as the basis for deriving the DTM (bare ground + submerged bottom). In addition, the volumetric point density of all remaining water column points enabled automatic classifi cation of the underwater vegetation. Visual analysis revealed two categories of submerged vegetation: (i) single broad tree stems and (ii) bunches of smaller branches and vegetation patches.
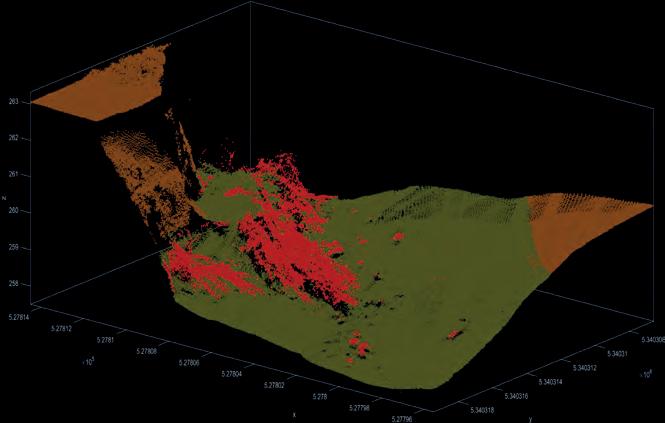
Figure 4: 3D point cloud of submerged bunch of willow tree branches coloured by class ID (red).
Figure 5: 3D topobathymetric Lidar point cloud coloured by reflectivity (blue: -30dB, red: -10dB) showing patches of macrophyte vegetation.
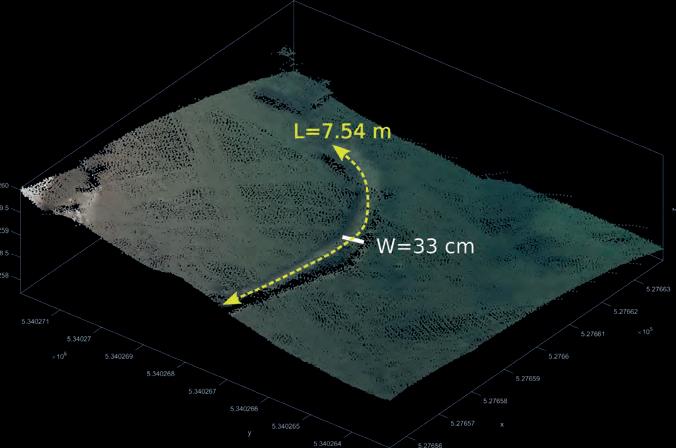
Figure 3 shows a 3D point cloud of a large individual stem coloured by RGB and Figure 4 features many thin branches of an entire willow tree coloured by classification. Both examples prove the feasibility of (i) detecting and (ii) automatically classifying underwater vegetation from UAV-borne topobathymetric point clouds. The length and width of the stem in Figure 3 are 7.54m and 33cm respectively. In contrast to deadwood in dry forests, submerged driftwood is often sparser and the absence of understorey facilitates detection. On the other hand, forward scattering of the laser signal underwater leads to blurring of the point clouds, which complicates the automatic detection of dense small structures (branches) and the precise estimation of vegetation patches due to progressive broadening of submerged driftwood point clouds with increasing water depth. Patches of submerged macrophyte vegetation are shown in Figure 5.
CONCLUSIONS AND OUTLOOK
Progress in UAV and Lidar sensor technology is enabling the capture of submerged topography and the detection of complex features such as deadwood and submerged vegetation in high detail. UAV-borne topobathymetric sensors featuring laser beam divergences of ~1mrad operating at an altitude of approx. 50m provide sub-decimetre laser footprint diameters. Together with high pulse repetition rates of 200kHz and slow flying velocities of 5-6m/s, this results in point densities of more than 200 points per m2, and thus very high spatial resolution. Furthermore, sensors featuring user-definable beam divergence, receiver’s field of view and scan rate make it possible to balance depth performance and spatial resolution.
Based on the automatic classification of 3D points, it is now possible to quantify parameters of submerged deadwood (stem length and width) and littoral vegetation (vegetation height and volume). Further improvements to the processing pipelines are subject to future research. The focus is on gaining a better understanding of the interaction of green laser radiation with water and multiple small-scale objects within the laser’s line-of-sight to improve established full-waveform processing techniques to handle these complex target situations. Other topics of interest include improving the automatic classification of submerged driftwood, vegetation and the water bottom, the segmentation of individual deadwood logs, the characterization of littoral vegetation, and the independent accuracy assessment of derived metrics.

ABOUT THE AUTHORS
Gottfried Mandlburger studied geodesy at TU Wien, where he also obtained his PhD in 2006. After completing a three-year research position at the University of Stuttgart (2017–2019), he returned to TU Wien in 2020, where he is currently working as senior researcher and lecturer in the Photogrammetry research division within the Department of Geodesy and Geoinformation. In November 2021, he obtained his venia docendi (post-doctoral qualification) in Photogrammetry for his thesis on Bathymetry from Active and Passive Photogrammetry. His main research areas are airborne topographic and bathymetric Lidar from both manned and unmanned platforms, multimedia photogrammetry, bathymetry from multispectral images, DTM modelling, topographic data management and scientific software development.
Martin Pfennigbauer holds a PhD in electrical engineering from Vienna University of Technology. He has been employed by RIEGL Laser Measurement Systems since 2005, presently as chief research officer. His special interest is the design and development of Lidar instruments for surveying applications, with a focus on rangefinder design, waveform processing and point cloud analysis.
David Monetti holds a DI from TU Wien. He is currently CEO at Skyability GmbH, a drone service provider based in Austria. He manages daily business and research projects funded by Austrian national funds. His product development activities focus on Lidar systems; using Lidar on platforms such as ULS, MLS or TLS have turned it into a tool used daily which now creates the best obtainable digital twin of a target of interest. For more than a year, David has also been responsible for implementing Lidar bathymetry at Skyability. His research activities and more than five years of hands-on work have made him a true expert in the field.
THE BENEFITS OF AIRBORNE TECHNOLOGY IN URBAN PROJECTS
When it comes to monitoring the condition of roads, UAV technology can overcome many of the downsides associated with traditional methods, which can be time-consuming, labour-intensive and sometimes subjective. This article explores the opportunities for automated extraction of UAV-based data information about road construction, inventory and road environments.
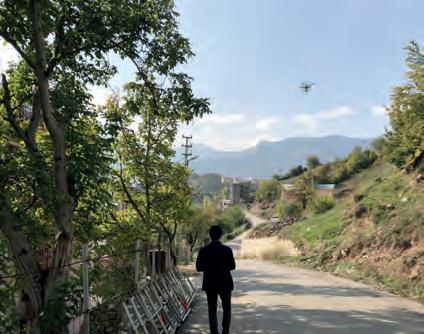
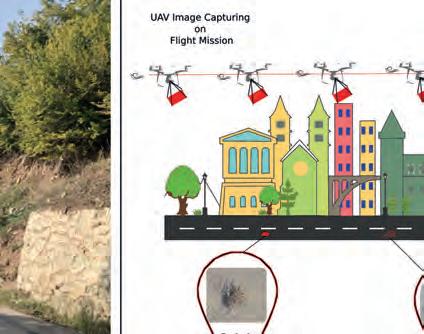
Figure 1: UAV-based data collection and inspection of road condition.
Roads are one of the signifi cant urban characteristics. They connect long distances to each other effectively, quickly, comfortably and safely. Therefore, their current conditions need to be monitored to make sure they meet the standards. However, traditional methods to monitor the condition of roads are time-consuming, labour-intensive and sometimes subjective. A relatively new way to monitor road condition is unmanned aerial vehicle (UAV or ‘drone’) technology. UAVs are one of the fastest-growing technologies in several fi elds such as precision farming and agriculture, forest, ecological and structural health monitoring, and geological, topographic and archaeological mapping.
UAV-based data is collected as the UAV fl ies over the study area and captures multiple images. Two different types of fl ight plans, namely manual and autopilot fl ight plans, are available in the UAV remote controller. Both plans have their own advantages. The autopilot fl ight plan is straightforward to collect data. The fl ight plan is remotely set in the interface and the UAV fl ies and acquires data automatically. However, the fl ight plan needs to be adjusted according to the characteristics of the UAV platform, which are maximum fl ight time, fl ight speed, height above ground level and horizontal distance.
ACQUIRING, PROCESSING AND VIEWING UAV DATA
The autopilot fl ight plan may not be suitable due to the harsh terrain or conditions of the study area, such as having steep slopes or having overhead powerline cables and poles, structures or trees. In these cases, manual fl ight may be better for safety reasons. In addition, two different kinds of images – nadir and oblique images – can be captured using UAV technology (see Figure 1). Oblique images increase the three-dimensional (3D) model quality, especially on vertical structures. The camera on the UAV is another important component to collect high-quality data, and camera specifi cations directly affect the quality of the captured images. The resulting two-dimensional (2D) images can be used to monitor road conditions. However, they may not support accurate surveying since single images provide no depth information.
3D models can also be produced from 2D images. Most UAVs usually contain global navigation satellite system (GNSS) and inertial measurement unit (IMU) sensors, which provide camera locations with centimetrelevel accuracy. Therefore, the 3D model can be produced using structure from motion (SfM) techniques. The SfM technique fi nds tie points in each image that can be matched on consecutive images. In addition, camera locations and orientations are also estimated using photogrammetric equations. Lastly, 3D point clouds of the object of interest can be reconstructed. There are several user-friendly commercial software options (Pix4D Mapper, Agisoft Metashape, 3D Survey, UASMaster, Photomodeler, etc.) and open-source software (VisualSFM, MicMac, COLMAP, etc.) to
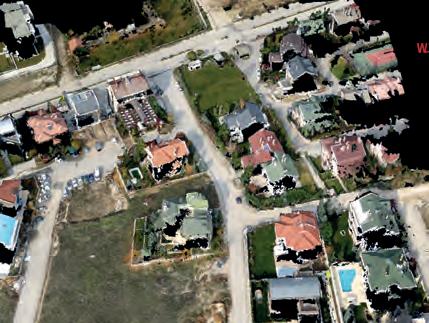
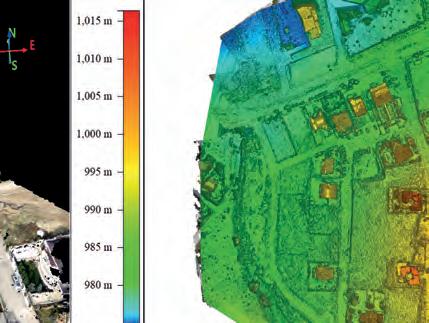
Figure 2: 3D point cloud in Quick Terrain Modeller and DSM in Global Mapper.
convert 2D images into 3D point clouds using SfM techniques. In addition, orthomosaics, digital surface models (DSMs) and digital terrain models (DTMs) can be produced using such software. These outputs can be viewed using various software such as Quick Terrain Modeller and Global Mapper (see Figure 2).
EXTRACTING ROAD INFORMATION
Road information such as road surface, centre line and lane markings, profi le, cross-sections and distresses can be extracted from 3D point clouds. These insights into road condition are signifi cant for improving road performance, comfort and safety. In order to collect road information, the road surface fi rst needs to be distinguished from other urban or rural objects and classifi ed. Machine learning algorithms such as Random Forest can be used to classify road surfaces, and these algorithms produce classifi cation results both quickly and with high accuracy. Once the road surface has been classifi ed, other geometric information can be easily extracted. Road centre line and lane markings are commonly used for road modelling, planning and safety. In addition, this information will be increasingly important for navigation purposes, especially in the context of autonomous driving in the near future. If the road lanes are marked using a specifi c colour (mostly white or yellow), they can be directly extracted using the RGB feature. RGB values express the colour of the 3D model, and they are transferred from the image processing software using images. In some cases, especially on local roads, road lanes may not be marked in a specifi c colour or the road lane markings may be damaged and not continuous. In such cases, several methods – such as the improved Voronoi diagram-based algorithms – can be introduced to extract the road centre line and lane markings more robustly and accurately.
‘Road profi le’ refers to the vertical section taken along the alignment axis (centre line) of the road. It is important to analyse the incline of the road since this can be a source of danger in the case of icing. Road profi les can be extracted through the DSM. DSM data
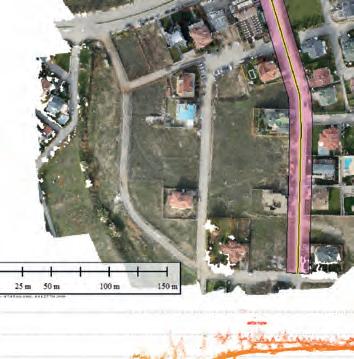
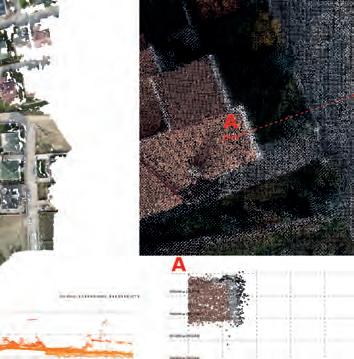
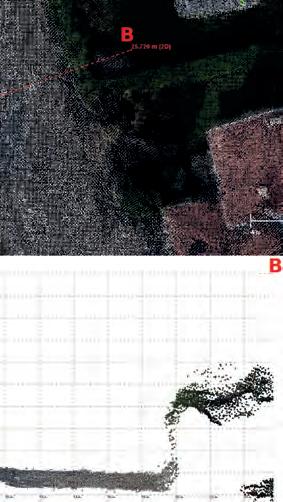

can be produced from 3D point clouds using various interpolation algorithms. One of the most commonly used interpolation algorithms is the inverse distance weighted (IDW). The height values are recorded as a raster format in the DSM. Then, the Z dimension of the road centre line is extracted from DSM to obtain the profi le of the road easily and accurately (see Figure 3).
The road cross-sections provide the creation of a road platform with certain slopes perpendicular to the road centre line. The cross-sections are also important for the transfer of water from the road surface to the roadside and the design of the drainage channels alongside the road. Similarly, the Z dimension of the lines perpendicular to the road centre line is extracted from DSM to obtain the cross-sections of the road easily and accurately (see Figure 3). Lastly, road distress can also be detected from 3D point clouds. Accurate detection of road distress is an important input for maintenance and repair actions. Timely maintenance and repairs need to be performed to increase the road’s service life, and to maximize comfort and road safety for drivers. In addition, on-time maintenance and repairs may reduce long-term costs. Various methods and techniques are capable of automatically detecting road distress.
CONCLUSION
Besides being used in other disciplines, UAVs have great importance in surveying and producing all kinds of up-to-date road information. In particular, the use of UAVs in road projects has increased in recent years since they can play an important role in the control of road inventory and safety, repeated land surveys and analysis of sustainable road networks, and mapping and projecting activities. Automated information extraction is very effective with small-package software as well as traditional GIS software. As a result, it is possible to extract information about road construction, inventory and road environment from UAV-based data. It is inevitable that, in the near future, the use of UAV systems will secure its place as an indispensable measurement method in road construction and the production of other road information.
ABOUT THE AUTHORS
Dr Mustafa Zeybek received his doctorate in 2017. He is currently the head of the Department of Architecture and Urban Planning at the Güneysınır Vocational School of Selcuk University in Turkey and is a faculty member. The main research areas are UAV, mobile Lidar, terrestrial laser scanning, deformation measurements and analysis, point cloud processing, forest measurements and road surface distress analysis. mzeybek@selcuk.edu.tr
Dr Serkan Biçici is an assistant professor in the Engineering Faculty of the Department of Geomatics Engineering at Artvin Coruh University, Turkey. He received his MSc and PhD degrees in civil engineering from The Ohio State University. His research interests cover various topics, including transportation planning, the traditional travel demand model and its statistical mode. His latest research focuses on road surface and geometric extraction, and road distress analysis. serkanbicici@artvin.edu.tr
