
Find


SeriesVariant Key Features
■ LC29H (AA) - Dual-band, meter-accurate


■ LC29H (BA) - 2-wheel or 4-wheel dead reckoning, cm-accurate


■ LC29H (CA) - 2-wheel or 4-wheel dead reckoning


■ LC29H (DA) - 1Hz update rate, cm-accurate
■ LC29H (EA) - 10Hz update rate, cm-accurate
■ LC29H (BS) - Base station to enable cm-accuracy


out more at Quectel.com
Director Strategy & Business Development


Durk Haarsma
Financial director Meine van der Bijl
Technical director Huibert-Jan Lekkerkerk
Contributing Editors Dr Rohan Bennett, Frédérique Coumans
Head of Content Wim van Wegen
Copy-editor Lynn Radford, Englishproof.nl
Marketing Advisor Myrthe van der Schuit
Circulation Manager Adrian Holland
Design ZeeDesign, Witmarsum, www.zeedesign.nl
GIM International, one of the worldwide leading magazines in the geospatial industry, is published eight times per year by Geomares. The magazine and related website and newsletter provide topical overviews and reports on the latest news, trends and developments in geomatics all around the world. GIM International is orientated towards a professional and managerial readership, those leading decision making, and has a worldwide circulation.
Subscriptions
GIM International is available eight times per year on a subscription basis. Geospatial professionals can subscribe at any time via https://www.gim-international.com/subscribe/ print. Subscriptions will be automatically renewed upon expiry, unless Geomares receives written notification of cancellation at least 60 days before expiry date.
Advertisements
Information about advertising and deadlines are available in the Media Kit. For more information please contact our marketing advisor: myrthe.van.der.schuit@geomares.nl.
Editorial Contributions

All material submitted to Geomares and relating to GIM International will be treated as unconditionally assigned for publication under copyright subject to the editor’s unrestricted right to edit and offer editorial comment. Geomares assumes no responsibility for unsolicited material or for the accuracy of information thus received. Geomares assumes, in addition, no obligation to return material if not explicitly requested. Contributions must be sent for the attention of the head of content: wim.van.wegen@geomares.nl.
To unite the global geospatial community yet again, this year Intergeo is returning to Berlin. GIM International had the privilege of speaking with two of the driving forces behind Intergeo: Christiane Salbach, managing director of the German Association for Geodesy, Geoinformation and Land Management (DVW), and Rudolf Staiger, president of DVW.
Obtaining centimeter-level accuracy in mobile mapping remains challenging, particularly in GNSS-deprived environments. Nevertheless, modern technology, featuring a blend of precisely calibrated sensors and advanced sensor fusion techniques, including Lidar SLAM, now makes this level of precision achievable in the most advanced mobile mapping systems.
Earlier this year, the EU declared the Galileo High Accuracy Service operational for testing, and it is scheduled to become fully operational in 2024. This free signal adds precise point positioning options to capable receivers. The Galileo HAS is being presented as an alternative to the current commercial offerings, so what can we expect from this new signal?

How can city digital twins help achieve SDG11? They assist in infrastructure management, aid planning and decision-making, and offer real-time data for simulations and resource allocation. Despite challenges in creation and implementation, this article highlights three successful city digital twin examples.


Geomares
P.O. Box 112, 8530 AC Lemmer, The Netherlands
T: +31 (0) 514-56 18 54
F: +31 (0) 514-56 38 98 gim-international@geomares.nl www.gim-international.com
No material may be reproduced in whole or in part without written permission of Geomares.


Copyright © 2023, Geomares, The Netherlands
All rights reserved. ISSN 1566-9076
While costs have become more manageable, 3D digital twins – particularly those with height data – remain complex and expensive. AI now offers a solution. Innovative AI-driven methodologies for extracting elevation data from imagery are lowering barriers, expanding the applications of digital twins and democratizing their use.
Using 3D laser scanning technology and software, the ‘Florence As It Was: A Digital Reconstruction of a Medieval City’ project set out to create an interactive model of the Italian city just as it was when ruled by the House of Medici at the end of the 15th century. The resulting digital output allows virtual visitors to explore the city’s spaces in moments captured across time.


In Poland, a pioneering project demonstrates the value of aerial mapping and Lidar technology in accurately mapping the urban green environment. This method, extended to cover the entire tree population, utilizes advanced computer algorithms to identify and reconstruct various tree species from hyperspectral images.

New knowledge and tools are needed if surveyors are to fulfil their critical role along the path to achieving humanity’s global climate goals. Surveying systems must also be redesigned in several respects: shifting focus from data collection to analysis, integrating geospatial and climate data, designing for climate resilience and for infrastructure, and collaborative solutions.
Cover
This image of Berlin from space, with a spatial resolution of 20m, is based on freely available multispectral satellite images from the Copernicus Programme’s Sentinel-2 satellite. First, atmospheric correction of the scene was performed using free software, followed by calculation of a colour composite with three different spectral bands: 8A (visible and near infrared), 11 (shortwave infrared) and 4 (visible red). This band combination is a false colour composite, useful for discriminating land and water. Healthy vegetation appears in orange and older vegetation is shown in green. Soil and clouds appear in various shades of green to turquoise, while water is represented by dark blue and built-up areas are blue-greyish to purple. (The image contains modified Copernicus Sentinel data (2022)/ESA – created by mundialis; www.mundialis.de)

3 Contents Issue 7 2023
5 Editorial 6 Headlines 14 On track with a digital mindset 17 Building tomorrow’s cities today 43 The importance of geodetic reference frames 51 Addressing recruitment challenges in the aerial surveying industry 54 Ride-along systems elevate geodata quality 58 Towards immersive 3D collaborative experiences 63 Airborne Lidar for shallow seabed mapping 66 Push-button tools in photogrammetry 70 Report: Open Day Photogrammetry 2023 72 Attracting the next generation of surveying superheroes 76 Organizations
story
11 31 20 35 23 38 26 46 www.gim-international.com The importance of geodetic reference frames Revolutionizing tree monitoring in urban areas and beyond Towards immersive experiences The role of surveyors in building climate resilience Redesigning surveying to support a sustainable global future Special edition: Intergeo 2023 To subscribe to GIM International go to www.gim-international.com/subscribe


l.ead.me/gim2309
JOIN US at Intergeo • Booth #H27.30
Geodata for the planet
We’ve all heard phrases like ‘There’s geo in everything, because everything is somewhere!’… Such phrases have become commonplace in our industry nowadays. But now that geo is so central to everything, geoprofessionals – and the organizations they work for – shoulder a responsibility that goes above and beyond the daily activities of acquiring, processing and analysing geospatial data. At all stages of the workflow, that data can be helpful –either on its own or in combination with other data – in achieving the United Nations (UN) Sustainable Development Goals (SDGs). Ranging from ‘no poverty’, ‘zero hunger’, ‘gender equality’, ‘climate action’ and ‘life on land and below water’ to ‘sustainable cities and communities’ and ‘responsible consumption and production’, these goals are all intended to sustain and support life for future generations in an effective and responsible way. Accomplishing these ambitious goals before the current target of 2030 will require drastic measures, often at high costs, and therefore some tough debate within – and between – the world’s various nations. According to the latest intermediate results, the global community is nowhere near on track to achieve the goals, so the UN is pushing Member States to do everything in their power to make headway. One thing is certain: giving up is not an option, because the scale of the crisis is simply too great. In this context, the United Nations Environment Programme (UNEP), together with the Science Policy Business Forum and the Ministry of Climate of the Republic of Estonia, organized a conference called ‘Towards a Big Data Revolution for the Planet’ at the Vienna International Centre of the United Nations in Austria from 11-13 September this year. The main goal of the conference was to bring together a large
group of people from academia, the private sector and NGOs as well as policymakers at all levels of government. Together, they explored the common ground for achieving the SDGs based on an integrated, techempowered and cross-sectoral approach to optimize data, governance and access. Needless to say, geodata played a big part in the discussion because, of course, there’s a little geo in everything. It can’t hurt to remind all geoprofessionals that, outside of our small domain, policymakers and decision-makers are eagerly eyeing our data. Now would be a good time to ‘peer over the hedge’ and ask those on the other side what kind of geodata they need – and how we can help them to utilize it – to accomplish the SDGs. The UNEP conference in Vienna was a first attempt to make this happen, and I encourage all of you to help further the discussion on how we can put geodata to optimal use to safeguard the planet’s future. And on the topic of the future, this issue of GIM International is full of forward-looking articles. Our autumn edition is traditionally our ‘Intergeo edition’, and this year is no exception. Later this month, the biggest annual gathering of the geospatial industry is returning to the German capital, Berlin, and GIM International and Geo-matching will once again be represented by a large team. As the official product launch partner of Intergeo, our recently relaunched Geomatching website presents details of all the new innovations that will be on display at the trade fair. If you are attending Intergeo, come and meet us all at booth D3.030! And if you won’t be travelling to Berlin, you can rest assured that GIM International and Geo-matching are on hand to help you stay up to date with all the industry developments and product news, both during the event and beyond.
Durk Haarsma, director strategy & business development

Issue 7 2023 5 Editorial
Cyclomedia gathers data and images for New Orleans
Cyclomedia, renowned for its 360° panoramic street-level imagery and Lidar data, has successfully completed data collection and delivery for the City of New Orleans, Louisiana, USA, following its victory in the request for proposal (RFP) in November 2022. The official contract signing took place this April. Since then, Cyclomedia has diligently conducted the data collection and extraction analytics across the entirety of the city’s road network. The company’s GIS-driven solutions, widely employed by local governments worldwide, provide an accurate and realistic spatial model of any given area. They derive valuable analytics from the collected data, forming an asset inventory that includes the condition assessment of each individual asset. The current contract encompasses a single data-collection drive. Collection vehicles covered approximately 3,200km of New Orleans’ roadways, capturing both imagery and Lidar data to construct a comprehensive 3D digital twin of the city. Advanced AI-powered algorithms were then employed to identify
ComNav adds advanced Mars Pro Laser RTK to GNSS receiver portfolio


The Mars Pro Laser RTK is the third addition to ComNav’s Universe series of GNSS receivers, following on from the Venus Laser RTK and Mars Laser RTK. According to ComNav Technology Ltd (ComNav), the Mars Pro boasts enhanced performance and an accompanying OLED screen. This cutting-edge GNSS receiver marries the latest advancements in GNSS, IMU and laser technologies, heralding a new era of precision, efficiency and excellence in land surveying, GIS and construction. During the design phase, the focus was on creating an innovative solution for challenging landscapes such as hard-to-reach, signal-obstructed and hazardous areas where conventional GNSS receivers might struggle. In such situations, users can simply click on the data collector to switch the Mars Pro to laser mode. Then, they can effortlessly carry out measurements by easily selecting a signalfriendly spot within a 10m radius. Thanks to the millimetre-level laser distance meter integrated at the rear, the Mars Pro’s laser mode can be used in surveying and stakeout scenarios to streamline tasks, eliminate complexities and provide a high degree of stability and precision. For example, laser mode mitigates the risks associated with taking measurements in challenging conditions, such as when measuring bridge piers from the opposite side of a riverbank. In this case, the Mars Pro enables the task to be completed from a safe position along the shore. Similarly, the Mars Pro’s laser functionality supports efficiency when measuring tricky corners in walls or roofs, road surfaces separated by fences, or pipelines in the middle of a river.

and categorize specific asset types as stipulated by the contract. Cyclomedia has delivered information on 20 different asset types, including water valves, ADA ramps, storm drains, fire hydrants and sign faces.
CHCNav introduces AlphaUni 20 Lidar system

The AlphaUni 20 (AU20) Lidar system represents a new era in cost-effective, multi-platform mobile mapping solutions, according to CHC Navigation (CHCNav), a global leader in precision mapping, positioning and navigation technologies. Harnessing the power of six years of innovation and product development fuelled by CHCNav’s Lidar technology, the AU20 is aimed at redefining mobile mapping and democratizing the reality capture industry by making it accessible to all. “We are thrilled to unveil the AlphaUni 20, a versatile and powerful Lidar system that sets new standards in the industry,” said Andrei Gorb, product manager at CHC Navigation. “The AU20’s advanced features and exceptional accuracy open up a world of possibilities for surveying and mapping professionals, streamlining workflows and providing unmatched precision,” he continued. With an absolute accuracy of 2 to 5cm, the AlphaUni 20 offers a reliable and precise 3D reality capture solution for a wide range of demanding applications. The AU20’s advanced multi-target capability supports up to 16 target echoes to penetrate vegetation. It captures ground surfaces with extreme precision, producing accurate digital elevation models (DEMs) and digital surface models (DSMs) in extremely challenging environments.
The Mars Pro Laser RTK. (Image courtesy: ComNav)
Issue 7 2023
Headlines
With its multi-platform design, the AU20 Lidar system is a versatile solution for a wide range of mapping and geospatial applications. (Image courtesy: CHCNav)
6
panoramic street-level imagery and Lidar data acquisition. (Image courtesy: Cyclomedia)
3D maps now available for over half of New Zealand

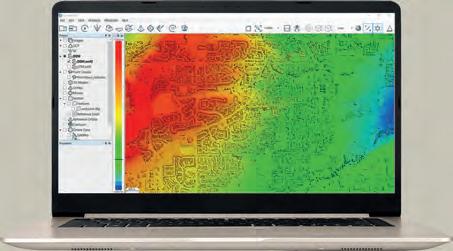
Driving new opportunities in the mapping landscape, a significant milestone has been achieved in New Zealand. With the introduction of 3D mapping data for the Waikato and Southland regions, access to highly detailed terrain information for over half of the nation is now a reality. This invaluable resource is available free of charge through the Toitū Te Whenua LINZ Data Service. Representing a strategic advancement, this recent data release marks a pivotal step in a comprehensive project aimed at providing intricate 3D imagery for a substantial 80% of the country. This initiative lays the foundation for a range of commercial applications and insights. “There is great demand for the data by local government, private sector companies, academia and Crown Research Institutes, and this demand continues to grow as the national coverage expands,” said Bjorn Johns, Toitū Te Whenua technical leader imagery and elevation. Lidar technology is leveraged to intricately capture high-definition terrain data. Employing Lidar, in conjunction with supplementary datasets, enables the intricate crafting of meticulous 3D cartography. These renderings are commonly referred to as digital elevation models. “These are invaluable to councils and regional industries for planning and will help with land management, flood and landslide hazard mapping, engineering design and 3D visualization,” Johns added.
SimActive used with Phase One cameras for precise photogrammetry
SimActive has announced the use of its Correlator3D product by Phase One camera users around the world. SimActive is a developer of high-end photogrammetry software, which is used to process imagery from the smallest sensor – the IXM-50 typically used with drones – to larger ones such as the PAS 880i NIR which includes oblique and nadir systems for citywide mapping. Correlator3D allows very large projects to be imported in the native Phase One IIQ format. This eliminates the need for conversion to TIF and reduces project setup time when working with thousands of images. Then, the processing workflow remains the same regardless of sensor size. Outputs including DSMs, DTMs, point clouds, orthomosaics and 3D meshes are all generated with the highest degree of precision. “Being able to import our native IIQ format means SimActive software is making full use of our 16-bit data. Correlator3D’s ability to process very large datasets is right in line with our clients’ expectations,” said Kevin Graville, system sales manager at Phase One.
Land Information New Zealand)
IBM and NASA launch major geospatial AI model on Hugging Face

IBM and the open-source artificial intelligence (AI) platform Hugging Face are collaborating to make IBM’s watsonx.ai geospatial foundation model accessible to the geospatial business community. This model, developed from NASA’s satellite data, is now openly available on Hugging Face’s platform. Notably, this release marks the largest geospatial foundation model on Hugging Face and the first open-source AI foundation model developed in partnership with NASA. In the realm of climate science, the challenge of obtaining the latest data persists as environmental conditions undergo frequent changes. Despite the increasing volume of data available (for example, according to NASA’s estimates, by 2024 scientists will have amassed 250,000 terabytes of data from new missions), researchers still grapple with hurdles when it comes to effectively analysing these extensive datasets. Earlier this year, IBM embarked on a mission, driven by a Space Act Agreement with NASA, to construct an AI foundation model for geospatial data. By releasing this geospatial foundation model on Hugging Face – a distinguished hub


for open-source transformer models – efforts are being made to democratize access to AI and its applications, thereby fuelling innovative solutions in the fields of climate and Earth science.

7 Headlines Issue 7 2023
This satellite image portrays Kuala Lumpur, the capital city of Malaysia, captured by the Sentinel-2 mission. (Image courtesy: ESA, modified Copernicus Sentinel data (2020), processed by ESA, CC BY-SA 3.0 IGO)
Earlier this year, SimActive introduced Correlator3D Version 10, featuring a redesigned user interface and higher-density point cloud generation. (Image courtesy: SimActive)
RIEGL VZ-600 i
RIEGL’S NEW ERA OF TERRESTRIAL LASER SCANNERS


» broad range capability (0.5 m up to 1000 m)





» 5 sec scan time for low resolution overview scans

» 30 sec scan time for 6 mm resolution @ 10 m distance
» 60 scan positions per hour (with image acquisition)


» 3D position accuracy up to 3 mm @ 50 m


» precise real-time onboard registration


» internal cameras & GNSS receiver

» weight 6 kg / 13 lbs
» prepared for mobile use

NEW
extreme versatility | high productivity | ultimate performance | prepared for mobility Austria | USA | Japan | China | RIEGLWORLDWIDE | Australia|Canada | United Kingdom RIEGL VZ-600i Data Sheet www.riegl.com Visit us at
Atmos UAV debuts Sony a6100 Oblique camera for affordable 3D mapping
Atmos UAV, a leading innovator in the VTOL mapping drone industry, has announced the integration of the new Sony a6100 Oblique camera into its flagship surveying drone, the Marlyn Cobalt. This strategic partnership with Sony further solidifies Atmos UAV’s commitment to providing advanced solutions to professionals in the geospatial mapping and surveying sectors. The Sony a6100 Oblique camera is a groundbreaking addition to the Marlyn Cobalt, which combines Sony’s 24MP a6100 with a Meike 12mm lens, providing an excellent solution for cost-effective, lower-resolution surveying and producing fantastic 3D models for urban surveys. One of the primary advantages of the Sony a6100 Oblique integration is its competitive pricing. As the entrylevel cousin to the workhorse a7RIV 61MP camera, the a6100 comes in at a 20% lower price point, while still managing a respectable 4cm ground sampling distance (GSD) at 400 feet (122m). This allows professionals to access high-quality imagery without breaking the bank. With the integration of the Sony a6100 Oblique camera, the Marlyn Cobalt now boasts an impressive 350-hectare coverage at 400 feet. This means that surveyors can efficiently cover vast areas in a single flight, reducing operational time and costs. The resulting GSD of 4cm at that altitude ensures high-resolution data acquisition, delivering sharp and detailed images for

Trimble Terra Office workflow links with Esri ArcGIS Pro


Trimble recently released the Trimble Terra Office add-in for Esri ArcGIS Pro. The add-in is a new product in the Terra Office suite of desktop solutions for integrating Trimble TerraFlex field data collection software with GIS systems of record. With a streamlined user interface, the new Terra Office add-in for ArcGIS Pro allows customers to connect TerraFlex workflows directly to their ArcGIS environment within ArcGIS Pro, Esri’s desktop GIS application. An ArcGIS Pro user can now create and manage TerraFlex geospatial data collection projects without leaving the ArcGIS environment. The add-in enables connectivity to feature services (and hosted feature layers) published in ArcGIS Online and ArcGIS Enterprise, as well as traditional on-premise enterprise or personal geodatabases. Organizations that collect data in TerraFlex and bring it into ArcGIS through the add-in will also benefit from being able to use the Trimble Offline GNSS Corrections service, for situations where real-time correction services are intermittent or unavailable. Using this service, all data from the field is automatically processed in the cloud without user intervention, and the most accurate real-time or post-processed position is stored for each feature and made available for download through the Terra Office add-in for ArcGIS Pro.
Hexagon unveils BLK2FLY for next-level indoor scanning autonomy

The Leica BLK2FLY is now able to scan indoors, providing expanded coverage for complex scanning projects. According to Leica Geosystems, part of Hexagon, the BLK2FLY unlocks a new level of autonomy to build digital twins of entire structures, both inside and outside. 3D reality capture of building exteriors and interiors is necessary to create complete digital twins. The BLK2FLY’s new indoor scanning capability expands users’ abilities to do this. Hexagon enhanced the autonomous UAV scanning system to allow for safe, effective indoor navigation and capturing. This capability also expands the BLK2FLY’s ability to capture various environments outdoors. The BLK2FLY can scan in areas without GNSS availability, opening reality capture opportunities in new settings and with new applications, including hazardous indoor areas like nuclear power plants. Increased performance of the autonomous navigation system heightens the sensor’s spatial awareness, allowing for obstacle avoidance in more confined

spaces. This new capability relies upon advancements to Hexagon’s visual SLAM system, providing real-time spherical imaging that improves the operating range to a radius of 1.5m.

9 Headlines Issue 7 2023
BLK2FLY’s new indoor scanning capability represents a significant advance in reality capture. (Image courtesy: Leica Geosystems)
Aerial imagery captured by Marlyn Cobalt using the Sony a6100 Oblique camera system. (Image courtesy: Atmos UAV)


Preview of Intergeo 2023

Navigating the geospatial frontier
By Wim van Wegen, GIM International
To unite the global geospatial community yet again, this year Intergeo is returning to Berlin, Germany, from 10 to 12 October. GIM International had the privilege of speaking with two of the driving forces behind Intergeo: Christiane Salbach, managing director of the German Association for Geodesy, Geoinformation and Land Management (DVW), and Rudolf Staiger, president of DVW. In this interview, they talk about the evolution of the event and its profound impact on the geospatial industry, as well as the firm commitment to nurturing emerging talent. The discussion also encompasses the evolving landscape of land surveying, the immense importance of Earth observation and the promising influence of the Blue Economy.
To what extent has Intergeo changed over the years?
Salbach: Intergeo has evolved continuously since the inaugural edition in 1995 in Dortmund. Today, it is unquestionably the world’s leading trade fair for geodesy, geoinformation and land management. Conceptually, Intergeo has always integrated new thematic fields that extend beyond the realm of geoinformation. Some years ago, for example, it incorporated areas such as BIM (building information modelling, Ed.), UAVs (uncrewed aerial vehicles or ‘drones’, Ed.) and laser scanning. This year, the focus is on the maritime economy and Earth observation, where we see significant growth potential both for exhibitors and for applications in the future. Cross-cutting technologies like digitalization and AI (artificial intelligence, Ed.) are crucial dynamic factors in the data-driven geospatial industry.
Staiger: While the COVID-19 situation somewhat slowed the steady increase in internationalization over the past three years, it’s already evident that Intergeo in Berlin will see an increase in international exhibitors and visitors.
The domain of geospatial technology has experienced notable expansion. How is this growth reflected on the exhibition floor and within the conference programme?
Staiger: The expansion is primarily based on the fact that not only neighbouring
disciplines require or handle geospatial data; today, hardly any application can function without georeferencing. The relationships have become much more complex – everything is interconnected, and georeferencing is the linking element. Additionally, data acquisition has fundamentally changed. While measurements used to be localized, today it’s about processing and interpreting big data – often using AI – to produce results. The capabilities of processing big data, including the storage of large datasets with
external access by various users, continually opens up new application fields – and not just for specialists. Urban digital twins are a prime example of this, as is citizen participation.
Salbach: The instruments and diverse software applications showcased by exhibitors are not only interesting for the geo industry, but also for infrastructure operators in the mobility, energy and planning sectors. The target audience is expanding, and Intergeo’s offerings are growing too. The
Issue 7 2023 11 Interview
general public recognizes that geodata, as well as location-based data, is part of the essential infrastructure for modern society, now and in the future. Challenges like climate change can only be tackled with geodata. The work of geospatial engineers is visible, acknowledged and valued across the industry, and this is prominently represented in the conference. Topics like smart cities, BIM, Earth observation, sustainability in real estate, modern land management, and cartography-related issues are discussed. The future-focused themes of official geoinformation management, 3D point cloud handling and the use of AI for sustainable applications also receive special attention.
How is Intergeo showcasing its commitment to supporting the search for new geospatial talent?

Staiger: At DVW, we are well aware of the need for young professionals in the geospatial field. We recognize that not only the industry, but also research and education, public administration and freelance professions are facing immense challenges in this regard. Together with our sister organisations BDVI and VDV, DVW is supporting the two campaigns called Weltvermesserer and Arbeitsplatz Erde which are aimed at introducing geospatial to young people as an attractive and forward-looking profession. The Weltvermesserer campaign also promotes the opportunity for those who are interested to visit Intergeo and immerse themselves in the world of geoinformation.
Salbach: Furthermore, Intergeo has been facilitating the Geoinnovation Campus for years, where universities and colleges can present themselves to an interested young audience. This year’s event in Berlin will be no exception and we’re expecting a lot of activity again, especially on Thursday 12 October when the Intergeo School Day is expected to attract more than 70 students. Additionally, the stages provide an exclusive platform. On the Wednesday, ten students will present their bachelor’s and master’s theses to the audience in the form of elevator pitches. The best three will be
honoured with the Intergeo Geoinnovation Award, which comes with prize money totalling €1,000. And on the Tuesday, experts will discuss their best-practice solutions for recruiting young professionals, because there’s no point in everyone reinventing the wheel; learning from the best is allowed and encouraged.
Which particular aspects are you looking forward to the most?
Salbach: We are hoping for a regular Intergeo that is no longer influenced by the COVID-19 restrictions. Last year in Essen, although there was a strong sense of optimism among the participants, the pandemic situation was still very top of mind. But now, despite the ongoing trend of reduced business travel triggered by the pandemic, it doesn’t seem to be affecting Intergeo. We’re delighted that the exhibition space in the Expo is almost fully booked at this time, and the registration numbers for the conference are very promising as well. The diverse and appealing programme, featuring numerous panel discussions on current topics, clearly caters to the needs of the geo community.
Staiger: In terms of content, the focus is naturally on the newly developed or expanded thematic areas. The BIM Area, the Earth Observation section, the Blue Economy and, of course, the new Unmanned Systems offering, which is a paid-content format that has been seamlessly integrated into the Expo. We are eager to see how the visitors will respond to these additional, specialized thematic offerings.
As the land surveying industry continues to transform, how is Intergeo proactively addressing the demand for new skillsets?
Salbach: Geodata authorities are evolving from data collectors to service providers for geo-related enquiries. One essential development is the utilization of remote sensing, particularly the data from the European Copernicus programme. This opens up entirely new applications and products. Optical sensors and radar also play central roles. Everything is related to geodata management and
Issue 7 2023 12
Intergeo 2023 is taking place in the exhibition halls of Messe Berlin.
addressing societal issues. Digital twins are also worth mentioning in this context. These aspects will be especially highlighted on the Tuesday.
Does the incorporation of a dedicated segment for Earth observation at this year’s edition of Intergeo signal a shift towards greater emphasis on this aspect?
Salbach: The Earth Observation segment is not intended to be a onetime initiative this year, but rather the beginning of the development of a new thematic area. The significance of Earth observation data for documentation, as well as for simulating the impacts of climate change, deforestation and urban sprawl, has grown significantly in recent years. Both the conference – featuring a high-profile thematic track on Earth observation, including political aspects, on Tuesday 10 October – and the Expo, with the Earth Observation Area, will comprehensively address the topic of global monitoring. The political importance of this theme is underscored in the conference by the participation of speakers from the European Space Agency (Juliette Lambin), the EU Commission (Elisabeth Hamdouch) and the German federal government (Dr Anna Christmann).
Staiger: Global monitoring provides Earth observation data that allow us to grasp, understand and ultimately counteract local interconnections in a timely manner. Satellite data is already being employed in geoinformation management. The use of AI will further multiply the possible applications, and these will be the focal points of the first day of the conference. I see significant potential to establish Intergeo as a leading international trade fair and congress for Earth
Christiane Salbach is managing director of DVW GmbH, responsible for the organization and management of Intergeo with a focus is on the implementation of the congress. Previously, she was responsible for the organization and management of the association’s general activities, including in coordination with the 13 German national associations.

Prof Rudolf Staiger has been president of DVW since January 2023, having previously held various positions at DVW including heading the former Working Group on Surveying Instruments and Methods until 2010. He served as president of the International Federation of Surveyors (FIG) from 2019-2022.

observation, thereby strengthening Europe’s – and particularly Germany’s – position in the Earth observation industry.
Which other prominent areas or topics will receive special emphasis during the 2023 event?
Salbach: The drone market is steadily gaining momentum as it grows and further professionalizes. Therefore, we are introducing the Unmanned Systems thematic complex for the first time as a paid-content format in the Expo, offering presentations on workflows, applications and value creation related to unmanned operations. Intergeo 2023 thus provides a unique and high-quality platform for companies, academics and decisionmakers to network and stay informed about the latest developments and applications of unmanned systems.
Staiger: The Blue Economy will be another prominent feature this year. With the goal of establishing the foundations for the sustainable protection of the oceans, the United Nations has declared 2021 to 2030 to be the ‘Decade of Ocean Science for Sustainable Development’. Additionally, with the adoption of the High Seas Treaty in June 2023, the international community agreed to better safeguard the world’s oceans. All this means that the Blue Economy is becoming increasingly important. The collection, processing and provision of maritime geodata holds special significance for our habitat, especially in terms of ecological and energy-related issues, so once again, Intergeo is expanding its offerings in this domain.
Considering today’s technological possibilities, why do you believe it is necessary for geospatial experts from across the globe to gather at a meeting hub like Intergeo?
Salbach: Innovation thrives on the exchange of knowledge, experiences and ideas among experts. The best and most innovative ideas don’t arise from isolating oneself and contemplating in solitude, but rather from networking, drawing inspiration from new technologies and product innovations, understanding the needs of customers and users or directly enquiring about them, and integrating one’s solutions within a broader context. This is the motto of Intergeo – and not just since this year: “Inspiration for a smarter world”. In this spirit, allow yourself to be inspired as well. Visit Intergeo and become a part of the extensive geo network!
Issue 7 2023 13 Interview
About Christiane Salbach and Rudolf Staiger
Rudolf Staiger.
Siemens Mobility’s AI-enabled digital twin signals new approach to rail modernization

On track with a digital mindset
By Vicki Speed
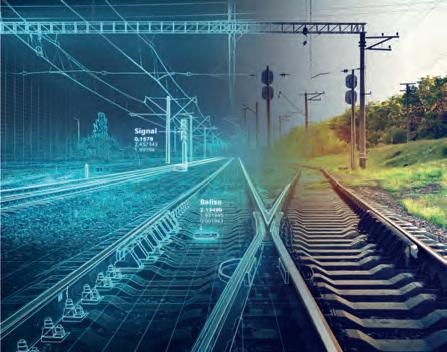
To maintain reliability and safety for passengers and freight, many of Europe’s rail networks are undergoing a massive digital modernization programme that includes digital twins. Backed by artificial intelligence (AI), these digital representations of rail systems are helping to facilitate the effective management of signals and inventory across the entire asset lifecycle. Siemens Mobility is playing a leading role in this development.
Siemens Mobility’s building information modelling (BIM) for rail infrastructure efforts encompass the full digitalization of the planning, construction and operation of rail assets, including signalling and structures along all of the lines. The company’s skilled technicians are putting digital twin techniques to work for Deutsche Bahn’s €12.7 billion (US$15.3 billion) programme to modernize its rail network.
Rebooting the infrastructure inventory
Integral to the German national railway company’s modernization efforts is the move to the European Train Control System (ETCS), the advanced signalling and control component of the European Rail Traffic Management System (ERTMS). The first component of the BIM modernization process is to document and digitize the signalling infrastructure of the Deutsche Bahn rail network. “Deutsche Bahn recognized early on that they needed valid data of the tracks before they could deploy ETCS,” says Carolin Baier, head of digital twin and digitalization for the domestic market of Germany at Siemens Mobility GmbH, the partner company supporting Deutsche Bahn to facilitate infrastructure capture of the inventory. “Our job is to reset or reboot the infrastructure inventory in different projects. That means we really need a clearer picture.”
The data collection process is built around a Trimble MX9 mobile mapping system that can be installed on trains, trolleys and cars, as needed. (Image courtesy: Siemens Mobility)
Outdated as-built inventory information does not allow for accurate planning. Especially in large infrastructure projects, obtaining upto-date data and information using traditional surveying methods is tedious and can cause major delays. In the past, this task would have required a survey team to measure using track wheels, along with mostly outdated paper plans.
Accuracy matters
For Siemens Mobility, the process of data collection is built around a mobile mapping system that can be installed on trains, trolleys and cars, as needed. “It’s quite important that we are as accurate as two centimetres, in some cases. That specification guides the choice of collection method, in this case our high-precision surveying system,” adds Baier. The company relies on the vehicle-mounted Trimble MX9 mobile mapping system with dual-head laser and the AP60 IMU, the highest-grade IMU on the market. Trimble’s MX9 is the first vehicleindependent mobile mapping system officially approved by Deutsche Bahn for surveying tracks, points, clearances and topographic objects. The scanner is mounted on the train for streamlined data gathering.
Skilled technicians at Siemens Mobility are putting digital twin techniques to work for Germany’s Deutsche Bahn rail network modernization programme. (Image courtesy: Siemens Mobility)
Maximized results, minimal disruption
“The great thing about this mobile mapping solution is that we can gather information at normal train operation speeds, usually between

Issue 7 2023 14
80 and 110km/h, and avoid business interruptions,” Baier continues. Siemens Mobility piloted the mobile mapping system in the Deutsche Bahn Netz AG Region East as part of an as-built data upgrade project. The resulting georeferenced 3D point cloud of the rail infrastructure included detailed images of the track, the track environment and the track gradient.

Data from multiple sources


Besides the point cloud data and images from the MX9, the Siemens Mobility team incorporates a considerable amount of customer data into the digital 3D model from various other sources, such as geographical information systems (GIS) and the real estate register (ALKIS). All of this data is synchronized to create an as-built BIM model that is positioned within a global georeferenced coordinate system – in essence, a digital twin of the existing rail network and associated infrastructure (e.g. signals). The team then performs a gap analysis to check that the objects in the customer database match the positions in the point cloud.
The next step is to identify and extract system objects and to implement a complete system layout in the form of a scaled track layout. For instance, on a 500-800km segment, there might be around 120,000 different objects. “Rich data is great; it’s very detailed and, thanks to mobile mapping, we can capture it quickly. But AI is really the key to unlocking the power of data because it allows us to work with these large datasets in an efficient way,” Baier states.


Algorithmic advantage
Baier and her team worked with the Siemens Mobility AI group to develop customized algorithms for specific use cases, such as automatic object recognition of track elements. “Object detection and AI algorithms support current and future developments, allowing rail infrastructure optimization as well as train movement in semiautonomous or fully autonomous systems. Without AI technologies to help sort out data, we could not develop these future systems,” she adds.
Baier believes the successful implementation of BIM in rail infrastructure, and the value of a digital twin, is the alignment of people, processes and technology. “The transition to ETCS and the future of rail operations will require a digital mindset. We are convinced that the application of BIM will soon contribute to making the process landscape in rail infrastructure even more efficient, which will in turn enable considerably more transparent collaboration,” she concludes.


About the author


Issue 7 2023 15 Feature
The Trimble MX9 is the first vehicle-independent mobile mapping system officially approved by Deutsche Bahn for surveying tracks, points, clearances and topographic objects. (Image courtesy: Trimble)
The digital track capturing process provides rich data for digital twin creation. (Image courtesy: Siemens Mobility)
is a freelance writer specializing in the
and
Vicki Speed
engineering
construction space.


Building tomorrow’s cities today
Geospatial digital twins will make cities smarter
By Adina Gillespie, Vice President of Strategic Initiatives, Hexagon’s Geosystems Division
Thanks to the ability of digital twins to provide insights into the reality of present conditions and the impacts of future scenarios, they have the potential to revolutionize the planning and efficiency of urban environments. How? This article presents four scenarios demonstrating ways in which geospatial digital twins will make tomorrow’s cities smarter.
From the evening news to real estate marketing, 3D virtual environments seem to be everywhere. People are now accustomed to ‘flying’ around any part of the world without leaving their armchair, or ‘walking’ from room to room in an architect’s concept of a yet-to-be-built home. These 3D virtual scenes, often called digital twins, provide planners with insights into the reality of present conditions and the impacts of future scenarios. Their ability to do this now has the potential to revolutionize the planning and efficiency of urban environments, from modelling new construction plans to managing traffic flows and noise pollution.
It is estimated that the market for digital twin technologies will reach US$73.5 billion by 2027, according to recent research by McKinsey. In most cases, these digital twins are made possible by integrating sensor technology and artificial intelligence (AI) technology. Airborne sensors quickly and cost-effectively collect accurate imagery and elevation data as core components of generating 3D environments. AI and machine learning algorithms can extract a variety of feature information to transform these geospatial datasets into immersive digital twins ready for visualization, modelling and simulation.
Constant feedback loop
One of the many recent developments is that a digital twin can be kept up to date with real-time data inputs within a constant feedback loop, capable of empowering action
and decision-making. This innovation allows planners to understand the current state of physical environments, such as cities, at a greater depth than ever before, discover potential challenges and model ways to be more efficient.
Digital twins are deployed to analyse and determine how changes can make urban areas more liveable, navigable and sustainable. The increasing affordability and accessibility of sensors for collecting 3D geospatial data likewise facilitates the democratization of digital twin technology. Not only can cities now afford them, but the datasets – as well as the modelling and simulation packages that leverage the 3D data – can also be obtained and utilized
productively by the private sector for commercial purposes.
There are many advantages of using digital twins, but the most beneficial are undoubtedly those that involve modelling and simulating the future to discover the impacts of proposed changes to current conditions. Using hybrid airborne systems like the Leica CityMapper-2, which combines optical imaging and Lidar sensors for simultaneous image co-registration and data capture, it is now possible to generate digital twins with unprecedented accuracy.
On the following pages are four scenarios demonstrating how digital twins will transform urban environments in the near future.
Scenario 1: Traffic routes are analysed using digital twins to ensure large vehicles avoid collisions. (Image courtesy: Hexagon)

Issue 7 2023 17 Feature
1. Vehicle clearance detection
As cities grow more crowded, managing traffic congestion becomes critical for mobility and commerce. By creating highly detailed virtual replicas of urban areas, planners can visualize the domino effects of disruptions: people are late for work, appointments are missed and product deliveries are delayed. For example, digital twins can model new truckloading zones outside a busy shopping complex. Combined with real-time traffic data and AI, planners simulate patterns with the new zone in place to find potential choke points from large vehicles entering and exiting. Traffic engineers can use this live information to designate alternate routes for large commercial vehicles, reducing disruption.
Digital twins also enable the testing of dynamic solutions such as smart traffic signals. Traffic patterns are simulated under different signal-timing scenarios for the most optimal timing, maximizing flow at various times of day and during special events or holidays. During infrastructure projects, the impact of lane closures and detours is tested in the virtual city, and traffic departments prepare contingency plans knowing the exact effects of diversions.
Additionally, trucking companies can leverage the same digital twin simulation to train their drivers in advance of navigating the crowded downtowns of specific cities on their delivery

routes, saving time and even minimizing vehicle emissions. In these ways, digital twins become a virtual laboratory for traffic planning innovation. Solutions are proven before real-world implementation that once required more costly and disruptive experimentation.
2. Noise pollution mapping
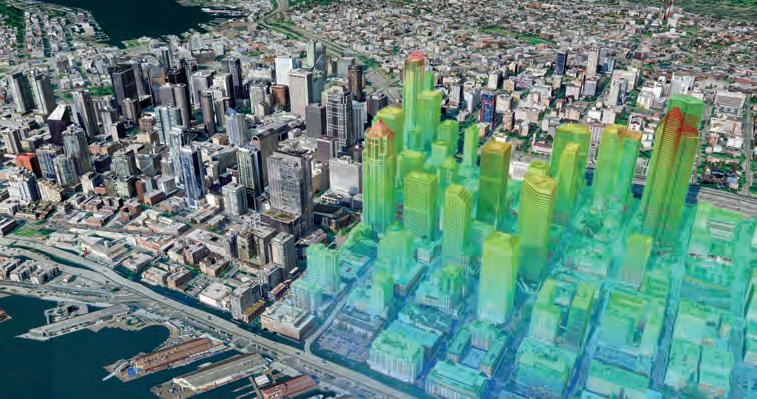
A realistic noise map may be the ultimate example of how digital twins have the potential for high-impact decision-making. In this simulation, the noise from an existing city tram has been modelled and represented as a volume bubble. Each layer of the bubble portrays loudness in decibels. As the tram moves through the city, so too does the noise bubble, showing precisely where and how much each volume level affects residential buildings, offices and restaurants.
Potential renters or homebuyers can use this information in advance to determine if their new home will be uncomfortably loud each time a tram passes by. For a tram line in the planning stages, city transport planners could use the same simulation to identify the best routes to reduce noise impact, or to plan for noise abatement walls to shield homes, hospitals and schools from ongoing noise pollution.
3. Skyscraper construction planning
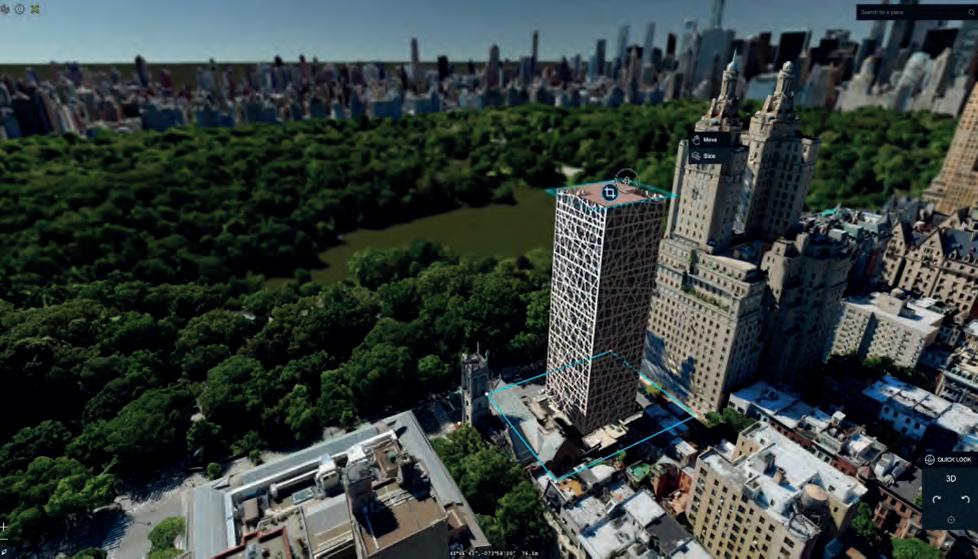
As urban centres experience rapid growth, high-rise tower blocks are proliferating in areas with limited available land for new construction. In one real-world example, the developer of a proposed high-rise building leveraged a digital twin to showcase the project to potential investors. The digital twin modelled how the planned tower would appear within the existing cityscape. By simulating the building at various heights, the developer demonstrated how additional stories and units would affect the living experience and potentially maximize revenue with penthouse-level rental rates and sales prices.
This model also enables extensive analysis by city zoning officials. By visualizing the planned tower in the context of neighbouring structures, planners can determine potential impacts on sightlines from existing buildings that could warrant height restrictions as well as effects on
Issue 7 2023 18
Scenario 2: Noise from a tram is simulated as a moving volume bubble, with each layer portraying different decibel levels. (Image courtesy: Hexagon)
Scenario 3: A digital twin used in planning the construction of a high-rise building. (Image courtesy: Hexagon)
parking space and congestion. The city planning department could also simulate the tower’s solar reflection to assess increased heat sink impacts or measure the magnitude of new shadows cast over public parks.
With virtual models, the digital twin reduces speculation and helps assess the trade-offs associated with new developments. In this specific example, the digital twin ultimately provided a comprehensive means for all stakeholders to quantify the proposed project’s effects before final approval. As this technology matures and becomes more commonplace, urban planning decisions and negotiations promise to become more informed, improving sustainability and efficiency.

4. Event planning
Event planners can create stunningly detailed and accurate virtual models of venues with digital twins. Various stage placements and orientations are visualized to refine layouts and ticket sales plans for maximum attendance and revenue. Key factors can be modelled, such as sightlines and viewing angles to identify ideal seating areas with unobstructed views, and acoustics and lighting to refine the audience experience through optimized sound and lighting strategies.
Most importantly, public safety officials can test mapped exit routes to determine ideal emergency evacuation plans. Crowd movement and flows are simulated to identify potential bottlenecks, informing the placement of vendor booths and amenities to minimize congestion. Digital twins even assist in programming complex pyrotechnics or drone shows by evaluating firing lines, flight paths and no-fly zones to avoid obstructions. Precise mapping of streets, alleyways and walkways also supports plans for getting emergency vehicles in and attendees out as quickly as possible, if necessary.
With this ability to eliminate guesswork through informationrich simulation, digital twins enable events to be meticulously engineered, planned and optimized. Planners can drive revenue using data-driven insights that are simply not possible from traditional static planning diagrams or models.
Further reading
hexagon.com/contentprogram
Digital twins are the future of urban environments

The HxGN Content Program supports initiatives like these with its Metro HD data offering, including 3D mesh models of major cities. Captured with the Leica CityMapper-2, providing simultaneously co-registered imaging and Lidar data, the 3D mesh models generate highly accurate and detailed digital twins that make simulations like those described above a reality. By leveraging the potential of digital twins, planners can improve the safety, efficiency and habitability of urban centres around the world.
Thanks to the Leica CityMapper-2, which combines optical imaging and Lidar sensors for simultaneous image co-registration and data capture, it is now possible to generate digital twins with unprecedented accuracy.
Issue 7 2023 19 Feature
Adina Gillespie is the vice president of strategic initiatives at Hexagon’s Geosystems Division. With over 15 years of experience in Earth observation (EO) technology, she focuses on advancing technology and data analytics adoption in institutions. Her primary goal is to optimize remote sensing technology utilization in both the public and private sectors.
About the author
Scenario 4: A digital twin used to estimate and plan event capacity and layout. (Image courtesy: Hexagon)
A realistic noise map may be the ultimate example of how digital twins have the potential for high-impact decision-making
Strategic imperatives to achieving centimetre-level accuracy
Peak performance in mobile mapping
By Anna Jarvis, Land Mobile Mapping Product Manager, Trimble Applanix

It can still be difficult to achieve centimetre-level accuracy in mobile mapping, especially in GNSS-denied or challenging areas such as in deep urban canyons, under foliage or through tunnels. However, with the right combination of sensors and technologies, it is possible nowadays. The most accurate and capable mobile mapping systems incorporate carefully integrated sensors that are precisely calibrated and use the most advanced sensor fusion algorithms and technologies such as Lidar simultaneous localization and mapping (SLAM) to georeference their data.
High-accuracy mobile mapping has become a foundational tool, whether application specific – such as transportation infrastructure –or in the context of the broader smart city, digital twin evolution. Yet for true continuing value, the resulting data must achieve centimetrelevel accuracy across an ever-changing and challenging landscape.
Precision calibration
Today’s high-end mobile mapping platforms integrate multiple positioning technologies such as inertial measurement units (IMUs), GNSS, Lidar, cameras and other sensor systems to achieve centimetre-level accuracy. While each of these sensors have their own limitations (e.g. line of sight in the case of GNSS and Lidar, inertial drift in the case of IMU), when skilfully combined these limitations can be overcome to produce a ‘fused’ high-accuracy solution.
To achieve consistent centimetre-level accuracy in all environments requires high-precision system calibration. This involves the precise determination of misalignment angles (boresight angles) and positional offsets (lever arms) between the sensors placed around the survey vehicle. As an example, for best satellite visibility, Lidar sensors might be mounted on the corners of the roof, a camera at the centre of the roof and the GNSS antennas elsewhere to enable best satellite visibility. Even the slightest inaccuracy of calibration between the sensors can create errors that will limit – and perhaps even eliminate – the ability to achieve centimetre-level accuracy.
Boresight benefits
While many of the calibrations between co-located sensors can be done in the factory during manufacture, most of the parameters need to be calibrated or refined in-situ. This is done using the manufacturer’s calibration software and by collecting data following a specific procedure. In general, the lever arms and misalignments between the IMU, the GNSS antennas and the vehicle are calibrated by making them observable through dynamics (e.g. turns), while the lever arms and boresight angles of the Lidar sensors and cameras are computed using Lidar SLAM and photogrammetry.
One of the most accurate means of using Lidar SLAM to calibrate Lidar lever arms and boresight angles is to use a global iterative least squares adjustment operating on voxels. i.e. 3D pixels. Voxels are created from the Lidar data and are then matched from subsequent scans of overlapping regions. The iterative least squares adjustment solves for the constant Lidar boresight angles and lever arms offsets that are necessary for generating a very high-accuracy point cloud.
On the right trajectory
Once the calibration is done, trajectory optimization is the second strategy to achieve the highest level of accuracy, reliability and efficiency. The trajectory – i.e. the position and orientation of the mapping sensors measured as the vehicle moves – is used to
Issue 7 2023 20
Figure 1: Mobile mapping system with multiple sensors including Lidar, a camera and a GNSS antenna.
geocode each pixel and point recorded by the sensors. Trajectory optimization involves ensuring errors are kept at a minimum through proper planning and data collection to ensure that the desired accuracy of the digital map product can be achieved.
Planning includes making decisions such as which aiding sensors to use, which GNSS augmentation methods to use, and the necessary collection geometry (e.g. single pass, multi-pass). This is particularly important in the most challenging GNSSdenied environments such as urban canyons or tunnels.

While the trajectory of a mobile mapping platform is primarily computed using GNSS and inertial sensors, additional aiding sensors such as Lidar SLAM and wheel-mounted odometry (i.e. distance measurement indicators or ‘DMIs’) can be deployed to remove or constrain drift in poor GNSS environments.
About the author
Anna Jarvis is Trimble Applanix’s land mobile mapping product manager, focused on product development for the industry. After graduating with a master’s degree in Geomatics Engineering from the University of Calgary, Canada, she joined Trimble Applanix where she has worked in various roles over the past 13 years.

Post-processing for ultimate accuracy
Map creation is normally done in postmission processing, either on a desktop computer or in the cloud. The aim is to produce the highest accuracy by taking advantage of scalable computational power, internet-based correction services and the ability to process data temporally, in the forward and reverse direction, and globally in the spatial domain. Accurate georeferencing is reliant upon the most accurate trajectory possible.
In post-processing, Lidar SLAM for trajectory adjustment can take advantage of using all overlapping points collected for the entire project area, regardless of when they were collected temporally. This makes errors in the trajectory highly observable for the most accurate correction. For example, it is possible to simultaneously use points that were collected in opposite directions or from inside a tunnel without GNSS, and overlapping points collected outside with GNSS.
In real time for quick answers
When time is more important than accuracy, mobile mapping systems can also produce map products in real time. While this means
they cannot take advantage of forward/ reverse processing and global trajectory adjustments, SLAM techniques can still be used to correct or constrain drift in the absence of GNSS.
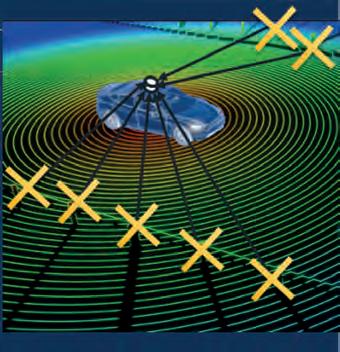
Map-based localization (MBL) is a method of using Lidar or image-based SLAM to provide constant and precise positioning, even without GNSS. This involves using an a-priori collected basemap loaded into the vehicle, and deriving the absolute position and orientation of the vehicle by matching features observed in the Lidar or imagery on the map as it moves. This can be done anywhere (including indoors) and from any type of vehicle.
The same SLAM technology used for MBL can also be used to reduce position error drift even if an existing basemap is not available. This technique is referred to as visual odometry (VO). In this case, overlapping images or Lidar scans are matched and used to estimate and correct for drifting position error when GNSS is not present. VO is a useful alternative for vehicles where traditional wheel-based DMIs are not practical (e.g. tracked vehicles, off-road vehicles, human-portable systems).
Issue 7 2023 21 Feature
Figure 2: Vehicle determining the absolute position based on existing basemap (MBL).
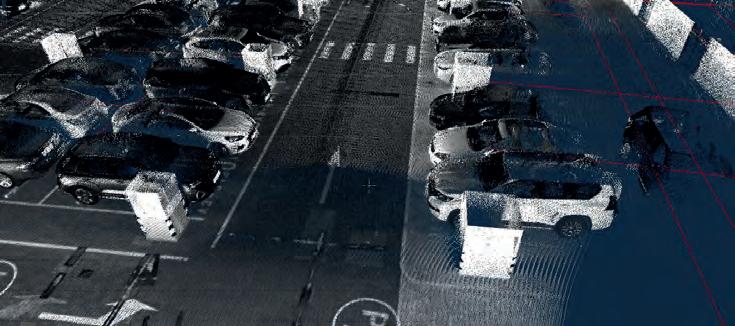
Figure 3: Image-based visual odometry, via feature tracking in stereopair. Figure 4: Results from the AVP application inside an underground parking garage.
Lidar-based MBL and VO will tend to be more accurate than image-based approaches. This is because cameras rely on lighting conditions and can be affected by the challenges associated with matching points in homogeneous scenes, as well as with fast-moving vehicles which can cause image smear.

Parked with precision
In China, location service and smart mobility provider NavInfo used mobile mapping as the foundation for an automated valet parking (AVP) garage project. AVP is a sensorbased solution that automatically drives a car to a parking spot and then returns to a designated pickup point when authorized. To make sure cars are parked with precision, the foundation map needed to be accurate to within ten centimetres for its 1,000 parking spaces.
NavInfo used a GNSS-inertial mobile mapping platform along with Lidar as an additional aiding sensor, with a post-
processed georeferencing Lidar point cloud and trajectory adjustment software. Using a combination of survey-grade GNSS/IMU sensors, DMI and Lidar-aiding SLAM technology, it was possible to achieve the required 10cm accuracy for the AVP basemap. The accurate and robust final trajectory solution is used to georeference all sensors onboard the vehicle with extreme accuracy.
Parameters and possibilities
In summary, there are multiple ways of achieving centimetre-level accuracy in mobile mapping, whether using VO, MBL, SLAM and/or post-processing trajectory adjustment, thus making the accuracy goal achievable.

Issue 7 2023 22
Figure 5: Before adjustment (left) showing a lamp post double, and after adjustment (right) showing the aligned scans from two passes on the same road.
New signal scheduled to become fully operational in 2024
Who will benefit from the Galileo High Accuracy Service?
By Huibert-Jan Lekkerkerk, GIM International
On 24 January this year, the EU declared the Galileo High Accuracy Service operational for testing, and it is scheduled to become fully operational in 2024. This free signal adds precise point positioning options to capable receivers. The Galileo HAS is being presented as an alternative to the current commercial offerings, so what can we expect from this new signal?

The European Union (EU) regards the Galileo High Accuracy Service (HAS) essentially as an alternative to the current GNSS augmentation services such as RTK and precise point positioning (PPP) from commercial providers. The Galileo HAS should aid various target markets and applications, including geomatics, aviation/drones and maritime, as well as autonomous driving and precision agriculture.
PPP as an augmentation technique
The HAS uses an augmentation technique called precise point positioning (PPP), which has actually been around for a few decades but has become an increasingly important technique over the past decade or so. In PPP, just as with other augmentation techniques such as code phase differential GNSS (e.g. SBAS) and carrier phase differential GNSS (e.g. RTK), a series of corrections from a base station is required. However, rather than provide or compute corrections to the ranges, PPP takes a different approach. In PPP, the base stations function as monitor stations, computing highly accurate ephemerides in near real time. It is these highly accurate ephemerides, rather than the predicted ephemerides as received from the satellites, that are then transmitted to and applied at the user’s receiver.

Code phase differential GNSS augmentation is a technique by which range corrections to the coded ranging signals are computed at base stations. The correction is the difference between the theoretical range between the station and a satellite, and the range as measured by the station. These corrections, which used to be mainly transmitted using terrestrial radio stations, are now usually transmitted to the user using satellites (SBAS). The system provides an absolute position with a service area of up to thousands of square kilometres. Accuracies depend on the service, but can range anywhere between a few decimetres and a few metres horizontally. Vertical accuracy is generally poor and in the order of metres. Free SBAS using systems such as EGNOS and WAAS comes as standard in every modern receiver.
a) Code phase differential GNSS, b) Carrier phase differential GNSS, c) PPP GNSS (Image courtesy: hydrografie.info)

On top of the more accurate orbit and clock information, the technique uses accurate error models for determining the tropospheric variations. Finally, the algorithm uses both the ranging signals and the carrier phase observations to increase the accuracy of the position determination. With this information, the receiver computes not only the receiver coordinates but also the tropospheric delay and the so-called phase ambiguities, similar to RTK. As a result, the overall horizontal and vertical position is accurate to within approximately a decimetre. Based on the author’s own recent evaluation of PPP signals, this technique is roughly two to three times less accurate than RTK under similar circumstances. The biggest

Issue 7 2023 23 Feature
Code phase differential GNSS augmentation
disadvantage of PPP is the long computation times required to achieve the intended accuracy, with so-called convergence times of up to half an hour depending on the situation.
Disadvantage of commercial PPP
The ephemerides required for PPP are either downloaded from a global network (usually with post-processing) or broadcast from communication satellites. Up until now, when it comes to global real-time applications, only commercial signals have been available (with the exception of the QZSS CLAS signal over Asia). A number of servers provide free data, but it is used for post-processing or nearreal-time applications. A big disadvantage of commercial PPP so far has been vendor lockin, since each augmentation supplier uses their own correction format and receiver manufacturers in general only support one or sometimes two formats effectively.
How does the Galileo HAS differ from other PPP services?


The Galileo HAS works largely like any commercial PPP service, but with some major differences. The first is that the signal is available freely over the internet or directly through the Galileo E6-B signal. This means that if one or more Galileo satellites are in view and the user has a suitable receiver, the signals can be obtained without requiring a further (paid) licence or a special signal receiver. Because the corrections are transmitted from the Galileo satellite rather than from a geostationary communication satellite, it is much easier to receive the corrections in otherwise signal-denied areas
Carrier phase differential GNSS augmentation

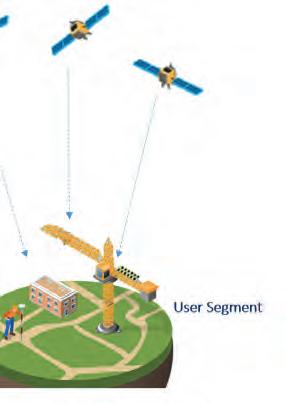
Carrier phase differential GNSS augmentation is the category that covers RTK and classic static GNSS methods. In this situation, a baseline difference is computed between a base and a rover. Rather than using the coded range signals, the final positions depend on the phase of the carrier wave from a satellite. Because carrier phase systems only compute a position difference between base and rover, they are relative systems. The final position is established by adding the base location to that difference. The system has a horizontal and vertical accuracy of a few centimetres, with a range of around 15-25 kilometres for most real-time applications.
such as urban canyons. Unfortunately, it seems that only a limited number of receivers have implemented the Galileo HAS so far. Hopefully, this should improve now that the Galileo HAS is declared ready for testing, with a realistic view to full operational capability in the near future.
applications
Besides Galileo information, the Galileo HAS also transmits GPS information. Unfortunately, albeit unsurprisingly, Glonass and Beidou are not available, which reduces any multi-constellation receiver to a dual-constellation receiver. From a user perspective this is a disadvantage, as especially Beidou satellites have a strong presence over Asia but also have a global constellation. The service is also not formally available over most of Asia and the Pacific (90°E-125°W from 60°S-60°N). Although not explicitly stated by the EU, the area without formal service (although corrections can still be received) coincides with the service area of QZSS which operates its own, even more accurate, RTK/PPP service called the Centimeter Level Accuracy Service (CLAS).
Issue 7 2023 24
Architecture of the Galileo HAS system (Image courtesy: EUSPA)
The Galileo HAS can be a replacement for SBAS in some GIS/mapping
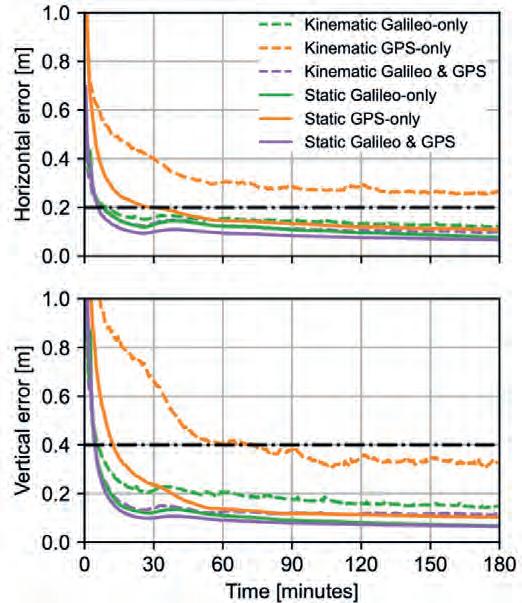
Galileo HAS performance (adapted from: Naciri, N., Yi, D., Bisnath, S. et al. Assessment of Galileo High Accuracy Service (HAS) test signals and preliminary positioning performance. GPS Solut. 27, 73 (2023). https:// doi.org/10.1007/s10291-023-01410-y)
Whereas many PPP solutions require at least 15 minutes for convergence, the Galileo HAS states a typical convergence time of less than 300 seconds for Service Level 1. At Service Level 2, this decreases to 100 seconds. Initial results show that the current convergence times to the ‘Service Level’ accuracies is indeed around 300 seconds for Galileo-only and combined Galileo/GPS solutions. In early tests for GPS-only solutions, the initialization time increased to around half an hour, with results getting worse in the case of a moving GNSS receiver.
What about the accuracies?
The accuracy for both service levels is stated as less than 20cm horizontally and less than 40cm vertically (95% confidence level). Let’s address the ‘elephant’ in the Galileo HAS room: the stated accuracies are reasonable for horizontal accuracy, but definitely not accurate enough vertically for most stated applications within the geospatial market. Moreover, these accuracies are not yet fully achieved. Early results using both GPS and Galileo constellations show an accuracy of less than 30cm horizontally and less than 40cm vertically (95% confidence level) with a current availability of over 90% (which should increase to 99% upon full operability).
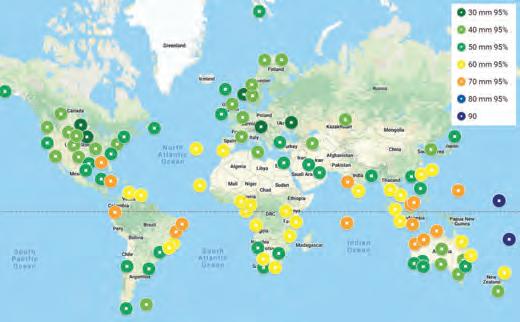
Initial tests show that the Galileo HAS can actually achieve much better accuracies when taking into account a convergence time of around half an hour and using both GPS and Galileo corrections. In practice, this achieved vertical accuracies of between 0.1 and 0.2 (95% confidence). In comparison, Fugro Marinestar G2+, a commercial PPP solution using GPS and Glonass corrections,
achieved vertical accuracies of between 3cm and 10cm (95% confidence) with an annual global average of around 0.06m.
Assuming that, from a commercial-political perspective, the EU intends to stay relatively close to the stated accuracies rather than the achievable accuracies, the Galileo HAS is unlikely to be used much for the intended applications of coastal and inland hydrographic surveys and (vertical) drone positioning. For hydrographic and drone surveys, the proposed service levels are not nearly good enough and RTK or commercial PPP solutions will continue to be used. In construction and precision agriculture, the horizontal accuracy is only good enough for certain applications and RTK will probably continue to be used for machine control for quite some time.

With a horizontal accuracy that is much more in line with achievable PPP accuracies, the Galileo HAS does have a future in some GIS/mapping applications as a replacement for SBAS, giving higher accuracy and also a better signal in otherwise ‘denied’ areas such as urban canyons. Moreover, in developing nations, the system may be useful in cadastral surveys and to improve horizontal navigation of drones. Additionally, it could be useful in offshore construction and dynamic positioning applications, provided that the operators are willing to take the risk of a ‘free’ signal without further insurances. However, the major application of the Galileo HAS is probably in autonomous driving where it will provide a much more accurate position and – even more importantly – more stable correction signal. This will aid in a more accurate navigation of autonomous vehicles at a global level.
Marinestar global satellite positioning. (Image source: Hydro International)
Issue 7 2023 25 Feature
Huibert-Jan Lekkerkerk is a contributing editor to GIM International and Hydro International, a freelance hydrographic consultant, the author of publications on GNSS and hydrography, and a principal lecturer in hydrography at Skilltrade (Cat B) and the MIWB (Cat A) in the Netherlands. He is also a member of the initial IFHS HPAS panel.
About the author
Developments, challenges and applications of city digital twins in the context of the SDGs
Digital twins for a sustainable world
By Mila Koeva, Ivan L. Cardenas and Luis Rodrigoandrés Morales
How can city digital twins support the attainment of SDG11? They can be used to manage infrastructures (e.g. roads, transportation and public services, smarter energy grids and water networks), support planning and decisionmaking, as well as to provide up-to-date data for simulations and resource allocation. However, city digital twins (DTs) are not without their challenges in terms of creation and implementation. This article includes three recent examples of city digital twins that have been successfully developed and implemented.
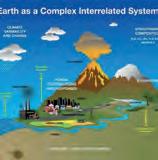
The United Nations Sustainable Development Goals (SDGs) were drawn up to improve the resilience of our complex living environment in the face of changing conditions, demands and hazards (Figure 1). According to SDG11, sustainable cities and human settlements are prioritized. This involves promoting sustainable land-use planning and management, as well as addressing issues related to water, sanitation, drainage and solid waste management. Moreover, there is an emphasis on the integrated urban planning and assessment systems. Additionally, contemporary climate problems
demand the redesign of spaces and infrastructures in cities around the world.
As a data-driven model incorporating computational simulations and artificial intelligence (AI), a city digital twin (DT) facilitates comprehensive assessments of the environmental, social and economic impacts of urban planning processes and decisions. As such, a city digital twin has the potential to support the attainment of SDG11.

City planners can employ DTs to simulate and evaluate various development scenarios,
aiding in informed decision-making for infrastructure, transportation and public services. Additionally, these twins can contribute to smarter energy grids, traffic management and resource allocation, thereby fostering more sustainable and efficient urban environments. They can also empower citizens with real-time data for better navigation and city interaction. In essence, city DTs can serve as transformative tools, shaping the cities of the future by enhancing their functionality, sustainability and liveability.
Creating city digital twins
The derivation and generation of DTs for new or planned structures requires stateof-the-art methods and is a different task then merely representing built-up areas. The required data and specifications for the resulting virtual replica can be incorporated into the planning, design, construction and operation processes. Creating DTs for existing, large-scale environments, e.g. entire cities, is a challenging task. It requires existing buildings, objects, infrastructure and systems to be mapped into a virtual representation, e.g. using remote sensing, mobile platforms equipped with sensors and various other sources of geospatial data. In that vein, sources of very useful input data could include existing building information
Issue 7 2023 26
Figure 1: The scope of Earth and environmental sciences. (Kevin W. Miller; image courtesy of NASA’s Goddard Space Flight Center – available at https://svs.gsfc.nasa.gov/30988)
Figure 2: Heavy rainfall can lead to shallow tree roots and basement water ingress, causing damage and flood risks. Conversely, in low rainfall periods, the water table can drop, affecting vegetation and underground structures.

models (BIMs) or 3D city vector models based on standards such as CityGML. However, most DTs also required dynamic data (behaviour and sensor data) in addition to the static geometric data including semantics and appearance. A fusion of different, heterogeneous datasets, captured at different frequencies (e.g. annually, daily or up to every minute), is required to provide up-to-date information on demand for a variety of applications.
In short, for the creation of these complex models, the following is needed:
• Dynamic/live representation of assets with past, current and future states
• Integration in virtual platforms of real-time data from sensors for continuous analysis through Internet of Things (IoT)
• Simulation and prediction capabilities based on real-world data
• Utilization of AI and data analytics for enhanced outcomes

• Support for informed strategic decision-making and personalized solutions.
Implementation challenges
In today’s rapidly evolving urban landscape, the behaviour of urban environments exhibits a remarkable level of dynamism. To truly understand and navigate this complexity, a multifaceted approach is required that encompasses spatial, temporal and semantic information. The sheer volume of data needed to reconstruct and fully grasp the intricacies of a city is huge. A diverse array of data sources support this data-driven quest for urban insight, ranging from Lidar and aerial imagery to terrestrial and satellite data, as well as the continuous stream of information from IoT sensors. These sources, when combined, serve as the fundamental ingredients for DT creation. In addition, a solid foundation is required in the form of geodata infrastructure organized within spatial databases. This serves as the backbone, ensuring the accurate representation of the DT and its connection to the physical world.
To tackle this data-rich environment, a robust computing infrastructure is required. Moreover, scalability is key to enable a seamless transition from modelling individual buildings, to capturing the essence of an entire city. Automation and analytics, powered by AI, are valuable tools in this endeavour. With AI it is possible to classify urban features, detect objects and perform semantic partitioning, all of which contribute to a more profound understanding of urban behaviour. However, it is important to note that interoperability remains a challenge that needs to be addressed. For DTs to reach their full potential, data exchange must adhere
Mila Koeva is an associate professor at the University of Twente, International Institute of Geo-Information Science and Earth Observation ITC, the Netherlands. Her main areas of expertise include photogrammetry and remote sensing for cadastral mapping, urban planning, 3D modelling and digital twin creation, among others. She leads FIG VII/4 AI4LA, ISPRS IV/WG 9 on digital twins, and the Digital Twin Geohub.
Ivan L. Cardenas is a GIS specialist with a master’s degree in Geoinformation Science with a specialized focus on urban planning and a background in environmental engineering. His experience and expertise relate to GIS analysis, cartography, web mapping, environmental impact assessment and territorial planning. In his work, he aims to integrate technical geospatial data analysis for informed decision-making processes.
Luis Rodrigoandrés Morales holds an MSc in Geoinformation Science and Earth Observation with a specialized focus on urban planning and management from the University of Twente, the Netherlands. Currently, he is also a professor at Universidad del Valle de Guatemala. His main areas of expertise include (GIS), topography, 3D modelling, game engines and digital twin creation.


to common standards, allowing different systems to communicate seamlessly and share crucial insights.
However, within the context of this ambitious quest for urban intelligence, the considerations of cost and investments must not be overlooked. Hardware, software, data management systems and analytic tools all come with financial considerations. A rigorous costbenefit analysis becomes an essential compass guiding municipalities towards effective decision-making in this ever-evolving landscape.
In addition, the concern for data privacy, security and governance is integral to digital twinning. Safeguarding sensitive information is paramount when working with DTs, necessitating robust measures
Issue 7 2023 27 Feature
About the authors
to ensure the integrity and confidentiality of the data.
3 examples of successful city digital twin applications
1. Digital twin for ground water table (GWT) monitoring and control
Managing groundwater in cities is increasingly challenging due to climate change-induced fluctuations in groundwater levels. These fluctuations, caused by more frequent and intense droughts and heavy rains, create problems such as waterlogging and flooded buildings. One common approach is to use groundwater control pumps, but they often have fixed capacities that may not suit extreme conditions. In low rainfall periods, the water table can drop, affecting vegetation and underground structures. Conversely, heavy rainfall can lead to shallow tree roots and basement water ingress, causing damage and flood risks. Balancing these challenges is crucial for effective groundwater management in urban areas (Figure 2).
The developed solution includes a DT model based on the Unity game engine that incorporates real-time GWT data from sensors distributed across the city. The solution integrates real-time data, prediction models and connectivity with pumping machines in a 3D photorealistic city model to support dynamic GWT control. The real-time data is based on the 273 sensors available from the public ‘Twents Waternet’ website. An algorithm has been developed to predict the groundwater level based on rainfall data that uses the GWT level with a combination of IoT protocols as triggers in the 3D game engine to de/activate a water pump in the physical world. The model also includes features such as historical data visualization based on previous sensor readings and a predictive machine learning model that uses decision trees to predict GWT depth based on historical and recorded precipitation data. The solution provides an interactive visualization of the GWT and aids the decision-makers by identifying areas that require automated water pump drainage. The associated research contributes to the development of an integrated and effective groundwater management and control system and facilitates sustainable water management practices in urban areas (Figure 3).

2. Digital twin for physiological equivalent temperature (PET) calculation
Urbanization, climate change and the ‘urban heat island’ effect have created the need to accurately assess thermal comfort. PET offers a comprehensive means of quantifying the combined effects of air temperature, humidity, wind speed and solar radiation on human perception of thermal conditions. By providing a metric that integrates multiple environmental variables, PET empowers urban planners, architects and environmental scientists to design spaces that prioritize human comfort and health. The development of a unified methodology using PET as a metric for heat stress was prompted by the abundance of different heat maps produced by various agencies using different metrics and methods.
Therefore, a DT-based model for PET calculation has been developed to identify the effect of adding (or removing) trees, buildings, water bodies, green areas or buildings. By combining empirical meteorological and GIS data, the model offers a cost-effective and practical approach to generating heat maps. It allows for the estimation of urban air temperatures and wind speeds using routine weather observations and information about land use and building geometries. Its goal is to reduce temperatures in key urban areas, enabling urban planners and decision-makers to identify impactful changes without the need to invest in untested solutions or to commit resources without prior knowledge of the expected outcomes. The potential for the DT for PET calculation to support collaborative and multidisciplinary street planning, evidence-based policies and enhanced citizen climate awareness has been demonstrated in the Dutch city of Enschede (Figure 4).

Issue 7 2023 28
Figure 3: a) GWT model, and b) the drainage simulation, beacon and animated water pump behaviour.
Figure 4: Digital twin for PET calculation.
Digital twins have evolved as powerful tools that enable the replication, simulation and analysis of real-world systems in a virtual space
3. Digital twin for solid waste management
A massive amount of solid waste, exceeding two billion metric tons, is produced annually worldwide. Municipalities in countries across the globe are grappling with the challenge of managing this, often with limited collection services, and Pretoria in South Africa is no exception (Figure 5).
Therefore, a waste management digital twin prototype has been developed, featuring stakeholder prioritization, citizen participation for locating waste sites, waste generation simulations, wastecollection route optimization and a control dashboard. It integrates real-time monitoring, optimized collection routes and citizen engagement via the open-source tool Epicollect5.

A three-day data collection effort uncovered 1,270 containers and 820 littering sites, revealing distribution gaps – particularly in parks. Litter in park areas emphasizes the importance of providing well-distributed containers and prompt maintenance. Photos aid issue identification, while citizen engagement improves accuracy and efficiency. Waste generation simulations provide insights into flows and optimal container locations, aimed at reducing fuel use and emissions (Figure 6).

Waste generation simulations provide information about waste flows, low-capacity areas and optimal container locations. Optimized
Further reading

Cárdenas, Ivan L., Morales, Luis Rodrigoandrés, Koeva, Mila, Atun, Funda, & Pfeffer, Karin. (31 August 2023). Digital Twins for Physiological Equivalent Temperature Calculation Guide. Zenodo. https://doi.org/10.5281/zenodo.8306456
Kumalasari, D., Koeva, M., Vahdatikhaki, F., Petrova Antonova, D., Kuffer, M. Planning Walkable Cities: Generative Design Approach towards Digital Twin Implementation. Remote Sens. 2023, 15, 1088. https://doi.org/10.3390/rs15041088
Rajan, V., Koeva, M., Kuffer, M., Da Silva Mano, A., Mishra, S. Three-dimensional Modelling of Past and Present Shahjahanabad through Multi-temporal Remotely Sensed Data. Remote Sens. 2023, 15, 2924. https://doi.org/10.3390/ rs15112924
Ying, Y., Koeva, M., Kuffer, M., Zevenbergen, J. Toward 3D Property Valuation – A Review of Urban 3D Modelling Methods for Digital Twin Creation. ISPRS Int. J. Geo-Inf. 2023, 12, 2. https://doi.org/10.3390/ijgi12010002

La Guardia, M., Koeva, M. Towards Digital Twinning on the Web: Heterogeneous 3D Data Fusion Based on OpenSource Structure. Remote Sens. 2023, 15, 721. https://doi. org/10.3390/rs15030721
Khawte, S. S., Koeva, M. N., Gevaert, C. M., Oude Elberink, S., and Pedro, A. A.: Digital Twin Creation for Slums in Brazil Based on UAV Data, Int. Arch. Photogramm. Remote Sens. Spatial Inf. Sci., XLVIII-4/W4-2022, 75–81, https://doi. org/10.5194/isprs-archives-XLVIII-4-W4-2022-75-2022, 2022. Nourian, P., Martinez-Ortiz, C., Ohori, K.A., (2018). Essential Means for Urban Computing: Specification of Web-based Computing Platforms for Urban Planning, a Hitchhiker’s Guide, Urban Planning 3 (1), 47-57 https://doi.org/10.17645/ up.v3i1.1299

collection routes are proposed to reduce fuel use and emissions. A control dashboard has been developed which includes stakeholders’ system requirements and displays 11 indicators on three maps. The prototype lays the foundation for waste management digital twinning that is scalable to different areas, vehicles and production levels.
Conclusion
Digital twins have evolved as powerful tools that enable the replication, simulation and analysis of real-world systems in a virtual space. The creation and application of DTs supports a transformative approach to understanding and managing complex systems, particularly in urban environments. However, due to the abovementioned challenges related to DT creation, there is a risk of producing fragmented solutions that remain at the pilot project stage. To make DTs practical and implementable, the ongoing challenges should be addressed together with the stakeholders. Nevertheless, as various successful implementations already show, this technology holds immense potential across various sectors, including urban planning and infrastructure management.
Acknowledgements
The authors would like to express their sincere gratitude to Dr Pirouz Nourian and Dr Ir Leon olde Scholtenhuis for their valuable contributions to the joint supervision and collaboration.
Issue 7 2023 29 Feature
Figure 5: South Africa (Hatfield City Improvement District limits)
Figure 6: Waste generation simulation (Hour 6: the step before route calculation).







GEOMATICS & EXCELLENCE
Catalyst for large-scale digital twin applications
AI-generated 3D digital surface models from digital orthophotos
 By Jakob Voigt, Ferdinand Vettermann and Johann Heller, deeeper.technology, Germany
Digital twins are revolutionizing the geospatial industry, merging real-time data and advanced modelling to provide precise, real-world representations. These virtual environments enhance decision-making across sectors like urban planning, environmental management and infrastructure optimization. While costs have become more manageable, 3D digital twins – particularly those with height data – remain complex and expensive. Artificial intelligence (AI) now offers a solution. Innovative AI-driven methodologies for extracting elevation data from imagery are lowering barriers, expanding the applications of digital twins and democratizing their use.
The increasing importance of digital twins to support decision-making processes has long become a core driver in product development for the geospatial industry. Digital twins serve as dynamic replicas of physical landscapes, integrating real-time geospatial data with advanced modelling and simulation. They enable precise mapping, monitoring and analysis of complex terrains, urban environments and natural ecosystems. Across a wide range of industrial segments, from smart city planning to agriculture and land management, reality is mapped in the form of visible and explorable geospatial data and used for planning with far-reaching implications. Although advancements in technology, increased availability of data and growing adoption across various industries have contributed to falling acquisition costs for digital twins in recent years, they still remain complex and therefore expensive.
This is especially true for 3D digital twins containing height information. Since this information is not always available or is obtained from cost-intensive Lidar scans or photogrammetry, which is less accurate and requires multiple images, height information often still forms a bottleneck in digital twin development. One way to reduce manufacturing costs is to save on procurement costs by producing AI-generated data in-house. Although
not directly intuitive, the generation of digital terrain models based on elevation data obtained from aerial imagery is very effective. To reduce costs and prices, the German geointelligence company deeeper.technology has developed such a method which allows the extraction of digital surface information directly from aerial and satellite imagery. In effect, a neural network is trained to calculate height information for each pixel. In simple terms, this makes it possible
to convert 2D image data into intelligent estimations of 3D terrain information.
Turning 2D image data into 3D terrain information
To get from 2D image raster information to the 3D terrain model, a method called monocular depth estimation is used. Traditionally, this involves training a neural network to estimate the distance relative to the camera of each pixel given a single
Issue 7 2023 31 Feature
Figure 1: Example of an AI-generated twin of the Earth’s digital surface using Deeeper’s variation of the monocular depth estimation method.
(monocular) RGB image. In a new approach, deeeper.technology uses a variation of this method whereby the deep neural network determines the distance to the ground instead of the distance to the camera. The result in this case is not a depth map, but a direct regression of an elevation map, which contains the ground distance for each pixel – the digital surface model. By adding a low-resolution digital elevation model, a digital terrain model can thus be determined in a very short calculation time. Both models – the digital surface model and the terrain model – then form a cost-effective building block for a large variety of digital twins (see Figure 1 for an example).
AI-generated backbone for diverse applications
The information can be generated in-house and is inexpensive to produce. This makes digital twin technologies accessible to a larger portion of businesses and governmental institutions. The information obtained can be used as a backbone in a wide spectrum of digital twin applications. For example, deeeper uses the generated data to create a three-dimensional digital twin of the land cover of the Earth’s surface (Figure 2) or solar cadastres in which height information and thus also shading are taken into account (Figure 3).
The cost-effective production of the various digital twin applications in turn has a major impact on the number of use cases that are made possible by these models. Among others, these include real estate and property evaluation, environmental impact assessment, flood and ecological disaster management, and strategic grid and infrastructure planning. Thus, the multiple application possibilities –together with the lower acquisition costs – not only increase the impact on measuring climate change and managing climate change activities, but also lower the threshold for the use of digital twins.
Benefits and limitations
Like any technological innovation, the automatic generation of digital terrain models does not exclusively offer advantages. The need for manual data generation or to purchase data from third parties gives way to reliance on other input data, such as aerial imagery in this case. Even though these are usually inexpensive, availability similar to Lidar is not universal. Moreover, AI generation of such complex models requires not only a lot of expert knowledge, but also the appropriate hardware with sufficient computing power. In addition, although the accuracy is sufficiently accurate compared to traditional methods, there will be some loss of quality and accuracy.
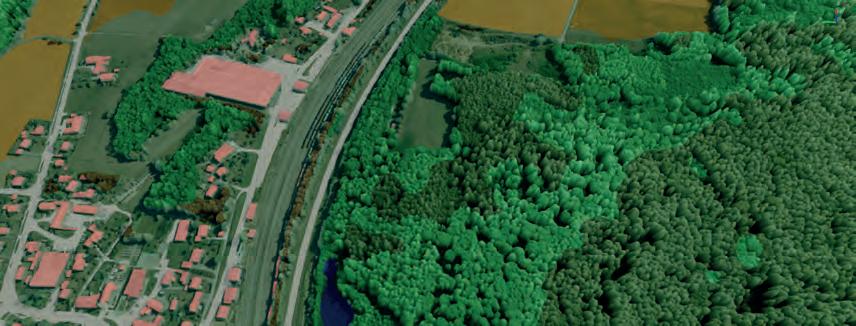
However, due to the large scales on which calculations can be performed, these are quickly compensated by the benefits. In addition to the abovementioned economic benefits, automation also offers the advantage that the resources gained through automated processes can be used elsewhere. Moreover, automated processes are less prone to human error and ensure that data is processed and analysed consistently over time.
Besides this, it can be assumed that, in the future, further building blocks of digital twins will be provided until it is possible to automatically generate complete digital twin models. Due to the fact that a digital twin typically involves a multidisciplinary approach –combining domain-specific knowledge, sensor data integration, modelling, simulation and data analysis – it can be considered a big step that sub-processes such as data collection and preprocessing can now be automated by the model developed by deeeper. Nevertheless, it is essential to note that, even if certain aspects of
About the authors
Jakob Voigt is an IT business engineer and business development manager at the German geointelligence company deeeper.technology. As a market analyst, he focuses on existing and new applications of AI in the field of remote sensing. He holds a bachelor of arts, bachelor of science and master of science from the University of Rostock.
Dr Ferdinand Vettermann holds a PhD in Geoinformatics and is a cognitive solutions engineer at the German geointelligence company deeeper.technology. As an expert in geoinformatics, he is responsible for linking deep learning with remote sensing as well as geospatial analysis for developing solutions to resolve related issues. He graduated from the Friedrich-Schiller-University of Jena and holds a BSc in Geography and an MSc in Geoinformatics.
Dr Johann Heller is one of the founders and CTO of the German geointelligence company deeeper.technology. As a deep learning expert, he is responsible for developing the technology behind this AI company. He graduated from the University of Rostock with a PhD in Accelerator Physics and also holds a BSc and an MSc in Electrical Engineering.


Issue 7 2023 32
Figure 2: 3D land cover produced fully automatically.
digital twin development can be automated, human oversight and expertise are typically required to ensure that the digital twin accurately represents the physical system it models and provides actionable insights.
Conclusion


Digital twins have emerged as indispensable assets in the geospatial industry, empowering precise mapping, monitoring and decisionmaking across various sectors. While their potential is vast, the costs associated with developing 3D digital twins, particularly those incorporating elevation data, have historically posed challenges. However, pioneering use of AI to extract elevation data from digital orthophotos represents a significant step towards cost-effectiveness and accessibility. This innovation not only broadens the scope of digital twin applications, but also underscores the importance of human expertise in guiding their development. As digital twins continue to evolve, they hold the promise of revolutionizing geospatial insights and decision-making on a global scale.
WE E FLY EUROPE
HIGH RESOLUTION PHOTOGRAMMETRIC IMAGES




NADIR AND OBLIQUE IMAGES
POINT CLOUDS

AVT AIRBORNE SENSING


GREVEN • IMST • TRENTO www.avt-as.eu avt.as@avt.at
THERMAL IMAGES
HYPERSPECTRAL IMAGES

FROM T THERMAL L AND D HYPERSPE
INFORMATION THAT IS NOT VISIBLE TO THE HUMAN EYE.
CONTACT US TO SEE O OUR NEW W PRODUCTS S FOR URBAN MATERIALS / GREEN / HEATING MAPPING, FORESTRY, AGRICULTURE, GEOLOGY AND MORE.


Issue 7 2023 33 Feature
Figure 3: Three-dimensional twin of a solar cadastre with consideration of shading effects.






The digital renaissance of a medieval city

Florence as it was
By Amanda Troth, Global Product Marketing Manager, Leica Geosystems
Using cutting-edge 3D laser scanning technology and software, the ‘Florence As It Was: A Digital Reconstruction of a Medieval City’ project set out to create an interactive model of the Italian city just as it was when ruled by the House of Medici at the end of the 15th century. The resulting digital output allows virtual visitors to explore the city’s spaces in moments captured across time.

Having evolved from a small ancient village pressed against the banks of the Arno River to the beating heart of European and world
trade in the 14th, 15th and 16th centuries, the Italian city of Florence now bursts with the histories of artists, poets, traders and
politicians. Florence is a city of things, a repository that buzzes with the memories of lived lives, with histories victorious and defeated, with labours loved and lost. From frescoes, sculptures, buildings and churches, to plays and poems, merchant diaries, guild documentation, chronicles and lovers’ letters, in the 21st century we are the legatees of an unusually complete – spatial and textual –view of the city just as it stood when ruled by the bourgeois House of Medici banking and political dynasty in 1500.
Despite this wealth of information, these textual, visual and structural testimonies have always been delivered to us as isolated objects, separate from their original settings. That is why the ‘Florence As It Was: A Digital Reconstruction of a Medieval City’ project, led by professors from Washington and Lee University, was launched. Using cutting-edge 3D laser scanning technology and software, it aimed to reconstruct the city as it was at the end of the 15th century. The intended result was an interactive model allowing academics, students and those interested in Florentine culture and history to tour the streets of the old city, visit its churches and palaces, and read descriptions of Florence by its contemporary chroniclers and historians.
Scanning for heritage preservation
Innovative and disruptive technologies are becoming increasingly commonplace in didactic settings. A key use case of the metaverse is to transport students to environments they could not otherwise visit. Virtual reality technology enables walkthroughs of situations that are dangerous or delicate in real life, such as crime scenes and fire investigations.
Issue 7 2023 35 Feature
The proprietors of Florence proved invaluable to the project’s endeavour.
Advances in terrestrial laser scanning –including highly accurate, portable instruments paired with sophisticated yet intuitive software for post-processing point clouds – have made scanning an important and increasingly accessible tool for the digital humanities, particularly in heritage preservation efforts. Therefore, Florence As It Was utilized scanning technology to enable a millimetre-level 3D documentation of important cultural artefacts.
While 3D laser scanning is based on scientific techniques, scanning for an open-access educational project in which the historical evidence is uncertain and subjective brings its own host of challenges. Anyone who is scanning a building should be respectful of the structures they are working on, but Dr George Bent, professor of art history at Washington and Lee University, took particular care when capturing the city’s ancient buildings.
Scientific and academic pledge
Moreover, since its inception, Florence As It Was has always followed a set of principles in line with its goal to be a platform of knowledge sharing and learning. In the spirit of collaboration, the scanned outputs are often shared with the people who made the project possible in the first place: the buildings’ proprietors. And in line with the project’s scientific and academic pledge, the digital models are never monetized.
One of the trickiest parts of the project was gaining access to the structures of interest, but the citizens of Florence proved invaluable to the project’s endeavour. On multiple occasions, they granted access to their private rooms and balconies to facilitate scanning from otherwise inaccessible vantage points in order to create a complete point cloud. Thanks to their understanding of the cultural, historical and social importance of preservation work, the proprietors of the spaces of interest were paramount to the project’s success.
Dark spaces and forgotten corners
Professor Bent, armed with a Leica RTC360, became accustomed to crawling into darkened spaces and descending into forgotten corners to unearth faded frescoes, ancient seals and long-lost architectural techniques. Even in seemingly insignificant spaces – like the basement of

the commissary, which now serves as a storage area – the project unveiled the remnants of a forgotten church, shedding light on untold stories and buried secrets.
The scanner’s portability, speed and accuracy allowed Bent to navigate tight spaces, ascend spiral staircases and venture into darkened recesses to capture obscured ancient domes. The Leica Cyclone FIELD 360 app streamlined the scanning process by enabling Bent to preregister and align scans in the field, saving on post-processing time and ensuring a complete point cloud. Often, there was only one opportunity to enter a space and scan it, so it was important to get it right first time.
Lidar scanning of artworks
The structures modelled with Lidar technology do not wholly represent the appearance of the buildings as a 15th-century visitor would have known them. Artistic styles, religious affiliations, rituals and the uses of buildings have shifted – sometimes radically and rapidly – over time. Sculptures, paintings and even frescoes were moved from building to building, often ending

Issue 7 2023 36
The Leica Cyclone FIELD 360 app streamlined the scanning process by enabling scans to be preregistered and aligned in the field.
Ricciardo Artusi of Città Metropolitana di Firenze, in the Riccardi Medici Palace.
up in art houses and museums, and many artworks once held by Florentine buildings are scattered to far-flung corners of the globe.
As part of the Florence As It Was project, one objective was therefore to visit many of the world’s museums containing historical Florentine art and capture the pieces now held in their collections to digitally reunite them with their original environments. The process by which images were collected and digitally modelled replicated that of Lidar scanning. Photographs of objects were taken from multiple angles, fed into a computer, read with software, stitched together to form 3D models, and then inserted into the point-cloud building models according to information gleaned from original source materials.
For example, it has been convincingly argued that three paintings now held in the North Carolina Museum of Art once stood on the altar of the Peruzzi Chapel in Florence’s Basilica of Santa Croce, which the team scanned and modelled in 2019. The team captured the works of art and meticulously inserted the photogrammetry models into the 3D digital model.


Data cleaning, modelling and meshing
Capturing the data in the field was only the first step in this project. Once the data had been captured, it was sent back to Washington and Lee University in Virginia, where a team of students led by Professor Dave Pfaff began the process of cleaning and analysing the data. The team used Leica Cyclone REGISTER 360 PLUS to clean the data and Leica Cyclone 3DR to model and mesh. Contemporary descriptions of Florentine buildings guided the team’s thinking when editing the point clouds and adding photogrammetric models of artworks. Those descriptions were sometimes of uncertain authorship and authority and could conflict with other contemporary first-person narratives. Still, the insights of scholars from the 16th , 17th and 18th centuries – namely Giorgio Vasari, Francesco Bocchi,
Ferdinando del Migliore and Giuseppe Richa – proved priceless in the careful construction of the digital models.
While some modern elements, such as fire extinguishers and cordons, could be eliminated from the models without any qualms, cutting away architectural structures to reveal earlier areas had to be done carefully, always considering the original source material and scholarly interpretations that argued persuasively for a particular appearance. The decisions about where to place models of artworks that originally decorated the spaces scanned were equally delicate. Before making decisions to eliminate architectonic elements, the project team consulted with the building’s proprietors and reviewed historical documentation in order to make the most accurate and responsible decisions possible.
Open-access resource
The Florence As It Was project has been an attempt to present a thoughtful representation of an early modern city based on archival information, archaeological evidence and decades of academic interpretation, supplementing contemporary point clouds of the city’s historic architecture with artworks and annotations. The results can now be shared and explored as an open-access resource for education, cross-disciplinary scholarly research and stewardship planning, enabling virtual visitors to experience these spaces in moments captured across time. Utilizing technology developed some 600 years after a 15th-century citizen might have wandered its streets, Florence As It Was breathes new life into an old city: gone but never forgotten.
https://florenceasitwas.wlu.edu

Issue 7 2023 37 Feature
Amanda Troth is a global product marketing manager at Leica Geosystems, specializing in terrestrial laser scanning within the Reality Capture division. Her role includes strategic digital marketing initiatives, communications, managing and developing customer relationships, and product launches within the reality capture segment.
Further reading
About the author
Mapping Poland’s tree population from above
Tree Crown Map: revolutionizing tree monitoring in urban areas and beyond
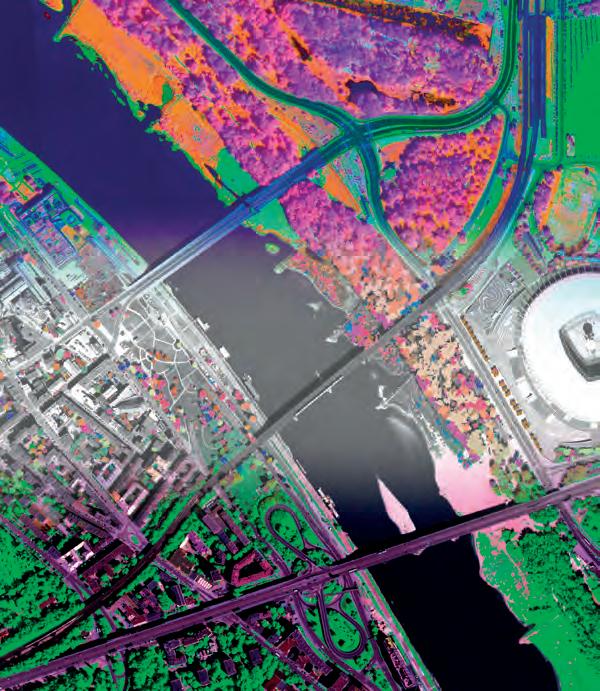 By Wim van Wegen, GIM International
A pioneering project in Poland has proved that aerial mapping, combined with Lidar technology, can be an invaluable tool for accurately mapping the green urban environment. In fact, the new, cost-effective method has been extended to encompass the country’s entire tree population. This article highlights the groundbreaking project by MGGP Aero. The company has achieved remarkable results by using advanced computer algorithms to identify and elegantly reconstruct numerous tree species from hyperspectral images. Additionally, the use of Lidar enabled multiple applications including measuring and visualizing crown height and mapping biomass.
Trees are of crucial significance to life on Earth, so it is important to gather as much information and insights about them as possible. They provide shade and can cool the air by 2 to 8°C, so strategically placed trees can be excellent natural air conditioners in cities. Mature trees can absorb up to 150kg of carbon dioxide per year, and also absorb other polluting gases such as nitrogen dioxide, carbon monoxide, sulphur dioxide and ozone. Moreover, trees remove particulate matter from the air by trapping them in their leaves and bark, leading to cleaner and healthier air in urban areas.
To calculate a diverse tree population’s potential societal benefits –including the impact on health and well-being, climate and biodiversity – and to ensure that the various benefits are fully utilized, it is necessary to have a clear understanding of all the tree-related data. This includes the size of each tree – because the larger the tree is, the greater its effect will be – and also the distribution of trees in a particular area or region. So how can government authorities obtain this valuable ‘green data’ effectively? The answer lies in geospatial data, but gathering it is not without its challenges, especially when the tree population comprises millions of trees.
Need for faster tree monitoring methods
Using conventional approaches such as field inspections, it can take around 15 minutes to collect data about a single tree. Considering that there the Polish capital of Warsaw has more than seven million trees scattered throughout the city, the municipal authority realized that any data gathered and analysed solely using these conventional methods would quickly become outdated. Therefore, there was a strong need for methods that speed up the monitoring process. City officials turned to the scientists at MGGP Aero with experience in modern remote sensing technologies. The company suggested
Issue 7 2023 38
The Local Tree Species Map visualizes information about spatial distribution of tree taxonomy.
conducting surveys remotely, using a combination of remote sensing data, aerial photos (RGB with a resolution of 10cm and hyperspectral imaging) and Lidar, to compile a comprehensive list of all the trees not only in Warsaw, but also in the whole of Poland. This led to the idea for the ‘Tree Crown Map’. It started with a pilot of an area of 50km2 of Warsaw, carried out in December 2018 by MGGP Aero. The pilot proved to be a success, resulting in a realistic estimate that approximately 25% of the area was covered by tree canopies, with the most common species being Scotch pine, oak and several species of linden. Further analysis revealed the linden to be in the worst condition in Warsaw. The project was continued with great enthusiasm, and the entire city of Warsaw –covering an area of more than 500km2 – had been mapped from above by the end of 2020. The resulting highly advanced map of individual trees recognizes nearly 50 different taxa, including detailed information on the geometry of their canopies and health status. Since 2020, the MGGP Aero team has carried out analogous tree inventories using remote sensing in another four Polish cities: Sopot, Jasło, Złotów and Rzeszów.
Versatile geospatial data toolkit
The Tree Crown Map was created using a diverse range of data sources that were made available through MGGP Aero’s advanced multi-sensor airborne remote sensing platform, designed in-house. This platform allows simultaneous recording of hyperspectral and Lidar data, along
About the author
Wim van Wegen is head of content at GIM International and Hydro International. In his role, he is responsible for the print and online publishing of Geomares, one of the world’s leading geomatics and hydrography media brands. He also writes columns and feature articles and often interviews renowned experts in the geospatial industry, plus he frequently attends international conferences and trade shows to engage with the mapping and surveying community. Van Wegen has a bachelor’s degree in European Studies.

About MGGP Aero
This Polish company specializes in acquiring vertical and oblique aerial imagery, satellite data, hyperspectral data, Lidar and also thermal imagery. Through remote sensing techniques, MGGP Aero conducts comprehensive inventories and analysis of urbanized areas and natural environments. Moreover, the company is renowned for its expertise in 3D modelling and the creation of modern web applications tailored to various geospatial data types.
with high-resolution RGB and TIR imagery. The platform continually expands to accommodate additional sensors, enabling customized flight campaigns to meet project requirements. Instrument fusion is applied to synergistically combine complementary data types. This approach provides various products derived from the multi-sensor platform, alongside comprehensive analysis
predictions, the project employed machine learning algorithms based on MGGP Aero’s own R&D department’s developed methods.
Mapping tree properties
The various data capture technologies and types of geospatial data each brought their own benefits to the project in terms of mapping specific tree properties. For

Issue 7 2023 39 Feature
and objects on the ground, Lidar results in a highly detailed 3D representation of the urban landscape and enables the identification and characterization of individual trees. Meanwhile, species
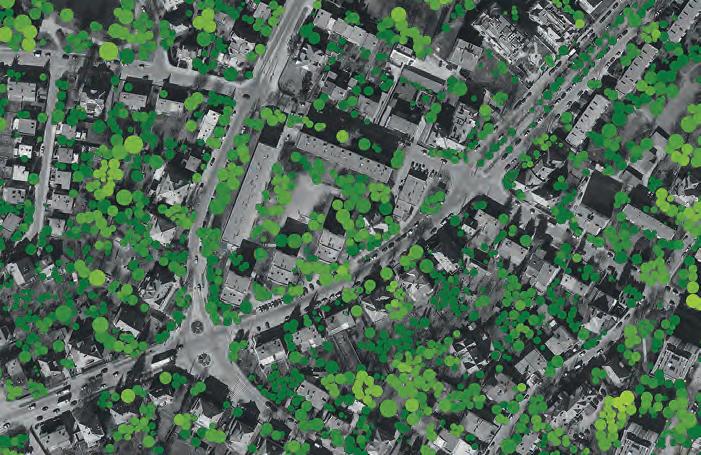
Poland’s tallest treen
As of September 2020, a Douglas fir with an impressive height of 58.2m standing in the Beskid Żywiecki Mountains was believed to be the tallest tree in Poland. However, following weeks of meticulous analysis of nationwide airborne laser scanning data that had been made accessible by the Head Office of Geodesy and Cartography for the purpose of the Regional Tree Crown Map, Agnieszka Ptak from the MGGP Aero team discovered that some trees in the Sudety Mountains had already exceeded 56 metres in height back in 2011. It was entirely possible that one of them would now be taller than the Douglas fir in Beskid Żywiecki. In order to definitively confirm this suspicion, field measurements of the tree height were necessary. The initial measurement was conducted by Marcin Kilańczyk, who placed a tape measure at the top of the tallest tree, while Agnieszka Ptak and Dominik Kopeć measured the height against the trunk. The first reading indicated an astonishing height of 59.5m, causing great excitement within the team. To ensure accuracy, Marcin repeated the measurement, resulting in a slightly lower reading of 59.2m. Two subsequent height measurements were then carried out by Bartlomiej Król, with readings at the base of the trunk indicating 59.5m and 59.4m, respectively. Ultimately the team decided to record the tree’s height as the average of these four readings, amounting to 59.4m. With this significant milestone, the official height record for Poland’s tallest tree now stands at 59.4m. The discovery of this remarkable tree was made possible by the development and utilization of the Regional Tree Crown Map, which harnessed the power of artificial intelligence and airborne Lidar data.
classification from point clouds is an evolving method that holds significant importance in laser scanning-based forest inventory, ecosystem models and forest management support. This data can play a crucial role in numerous tree monitoring tasks, including the estimation of individual tree height and diameter at breast height. Additionally, hyperspectral sensors provide significantly more comprehensive information than conventional multispectral sensors, which only measure within three to eight spectral bands. In contrast, hyperspectral sensors record the light reflected from the target across numerous (often more than 200) contiguous spectral bands, covering the visible, near-infrared and mid-infrared regions of the electromagnetic spectrum. Analysis of hyperspectral data enables various objects to be differentiated based on their distinct spectral characteristics, encompassing colour, chemical composition and structure. As trees affected by disease or environmental stress tend to exhibit diminished greenness and reduced foliage, hyperspectral data can be invaluable in evaluating overall tree health based on leaf colour or density.
From capital to country
To effectively harness the remarkable potential unlocked by the initial pilot, MGGP Aero subsequently carried out an extensive survey of the vast array of trees in the whole of Poland. The MGGP Aero specialists leveraged the invaluable release of airborne laser scanning (ALS) data by GUGiK in July 2020, coupled with their extensive expertise in analysing such data, to conduct a comprehensive study employing fully automated methodologies. This groundbreaking study resulted in an intricate aerial depiction of tree distribution throughout the entire nation. Astonishingly, it revealed that the country’s tree inventory encompasses over 3.5 billion crowns, spanning an area of almost 100,000km2 and covering approximately 33% of the total land mass.
The findings are conveniently presented in the ‘Regional Tree Crown Map’, which showcases the outcomes of the comprehensive tree inventory conducted on a national scale. This product provides an aerial view of the crowns of all trees (excluding those concealed by taller crowns) that satisfy the minimum height requirement of 4m and a minimum crown area of 9m². The Regional Tree Crown Map is accessible

Issue 7 2023 40
The Polish city of Wrocław is set to introduce a Regional Tree Crown Map to improve the management of its urban green spaces. This system will boost the efficiency of Wroclaw’s municipal greenery management by providing precise information on the city’s greenery.
Regional Tree Crown Map showing the location of the highest tree in Poland.
to the public through the My Tree Map website, powered by the OBLIVIEW web engine developed by the MGGP Aero team. This web engine can be described as an advanced online platform that combines three separate solutions into one. It provides a comprehensive dataset for applications requiring view analysis and precise building measurements. It is built on geospatial data from six digital sensors, including nadir and oblique imagery views and Lidar. The data has been released in accordance with the European Union’s INSPIRE directive, which is aimed at creating a common spatial data infrastructure for the purposes of EU environmental policies and/ or potentially impactful activities.
Utilizing geospatial tree data
With a range of extensive functionalities, the My Tree Map web application presents trees against the backdrop of aerial orthophotos or OpenStreetMap data. This cartographic representation provides easily understandable information about the location of tree crowns and their height. Furthermore, users can gain free access to additional tree characteristics and information, including tree species, tree health, crown area and volume, tree trunk locations and the diameter at breast height. Users can browse the data across Poland without limitations, from individual trees to entire cities, at various scales. The website also enables users to purchase the Regional Tree Crown Map for a specific area and download it for use in their own GIS environment. Therefore, the Regional Tree Crown Map represents an essential tool for various authorities, particularly municipalities,
The green city of Wrocław
Many Polish cities are actively pursuing digitalization and adopting modern technologies to manage urban spaces more efficiently, and Wrocław is no exception. The city is working to develop and implement an advanced system called the Urban Greenery Management System and an accompanying e-platform known as Greenery. The primary objective of this system is to enhance the effectiveness of Wrocław’s municipal greenery management activities by providing precise and comprehensive information on the condition of the city’s green spaces. An interdisciplinary team from MGGP Aero is actively engaged in conducting a thorough inventory of the greenery in specific areas managed by the municipality in Wrocław. The collected inventory data will be vital input for the Urban Greenery Management System. MGGP Aero’s responsibilities include conducting a meticulous examination of trees, marking them with arbotags and identifying the species, varieties, parameters and overall condition. Furthermore, the team are evaluating each tree for further actions and developing recommendations for tree care. In order to accomplish this, they are making extensive use of aerial data and remote sensing techniques for processing and analysis, while conducting on-site measurements for reference purposes. This task involves the active participation of experienced specialists in remote sensing, geoinformation and botany. One of the notable deliverables as part of this project is the Local Tree Trunk Map, which will provide highly precise information about the precise location of each tree trunk, as well as the breast height and various additional parameters that characterize each tree. Thanks to the Local Tree Trunk Map, MGGP Aero is able to accurately count the number of trees in a specific area with an accuracy rate of 99.9%.
and the knowledge derived from it serves as a valuable resource for managing extensive greenery and also adapting to climate change.
Conclusion
Thanks to the innovative geospatial data capture and processing methods in MGGP Aero’s solution, combined with the utilization of a wide range of pre-existing data, comprehensive information about trees in Poland is now easily accessible,
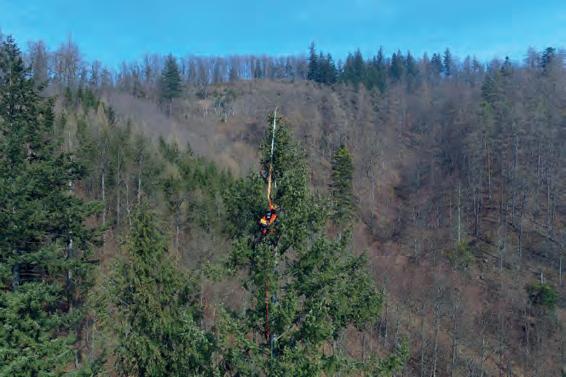
thus eliminating the need for specialized knowledge and skills. This user-friendly approach empowers citizens, professionals and policymakers to make use of the tool for a diverse range of activities, including supporting Poland’s initiatives in adapting to climate change. Specifically, the tool holds substantial value for managers overseeing green spaces in local government units, such as municipalities, infrastructure agencies and nature protection services.

Issue 7 2023 41 Feature
Two separate height measurements conducted from the base of the trunk yielded readings of 59.5m and 59.4m. Far left: Professional arborists Bartłomiej Król and Marcin Kilańczyk. Far right: Król is using a tape measure to measure the tree’s height from the top of the crown.
OMNI VIEW, OMNI POTENT


Turns to see moreTilts to see enough


Introducing WARP Omni : A transformative gigapixel aerial camera offering unparalleled productivity and flexibility. Doubling the oblique views and nadir frame size, in half the size of other systems. Versatile, autonomous and highly competitive with satellite and UAV imaging for mapping, smart city, and wide area monitoring.




A uniform basis to tackle current and future challenges
The importance of geodetic reference frames
By Detlef Angermann, Roland Pail, Florian Seitz and Urs Hugentobler, Technical University of Munich, Germany
Global reference systems such as the International Terrestrial Reference Frame provide the foundation for determining positions on Earth and in space, as well as for reliably quantifying our planet’s changes due to geodynamic processes and ongoing climate change. A global reference frame ensures a uniform basis for geospatial data. Moreover, it is needed for all positioning and satellite navigation applications, and thus plays an elementary role in modern society.
Numerous media reports inform us that the global sea level is rising. According to the Sixth Assessment Report of the Intergovernmental Panel on Climate Change (IPCC Report 2021), the current mean sea level rise is 3.7mm per year, whereas over the last century it was ‘only’ approximately 1.5mm per year. This significant increase
in mean sea level rise is not surprising, since global warming is accelerating the melting of ice masses and the thermal expansion of ocean water. However, it is also important to look beyond these average values for all the oceans because, as shown in Figure 1, there are large regional differences. In some regions off the American west coast the sea level is actually falling, but there are much larger regions where sea level is rising by up to one centimetre per year. Such a rapid sea level rise affects not only island regions (most of which are only just above sea level), but also many densely populated coastal regions. The associated risks of flooding and loss of habitats represent an enormous threat and can result in major migration movements and social conflicts. Therefore, precise knowledge of this climate change phenomenon is essential for decision-makers and society. But how can sea level rise be measured so precisely?

The need for a precise global reference
Precise orbits of altimetry satellites are one prerequisite for a reliable determination of sea level variations. As a fundamental basis, this requires an accurate global reference that remains stable in the long term. As an example, Figure 2 shows how an inaccurate reference frame can lead to an incorrect determination of sea level. In this illustration, the orbit of the altimetry satellite is determined with laser ranging, and the distance between the satellite and the ocean surface is measured with a radar altimeter. If the station moves without being correctly described by the parameters of the reference frame, the same radar measurement will result in a different satellite orbit. This creates an apparent rise in sea level, although in reality it is the observation station that has changed.
In order to assess the impact of sea level rise in a particular region, it is important to know the sea level change relative to the land. It is therefore also necessary to determine whether the land itself is rising or subsiding. This again requires an accurate and stable reference frame as a metrological basis. Fennoscandia, for example, is rising as a consequence of melting of ice masses of the last ice age (postglacial uplift), but other coastal regions are subsiding, for instance due to geodynamic or human-made effects such as extensive ground water withdrawal. Jakarta, Indonesia’s capital, is an alarming example of the latter effect. It is regarded as one of the fastest-sinking cities in the world, with half of the city already below sea level and the forecast not looking promising.
Due to the potential societal impact of sea level rise, it is a key driving factor in the high accuracy requirements for the global geodetic reference frame. The target set by the International Association of Geodesy (IAG) is a positional accuracy of one millimetre, and the long-term stability is to be one millimetre per decade. This is a challenge for geodetic work.
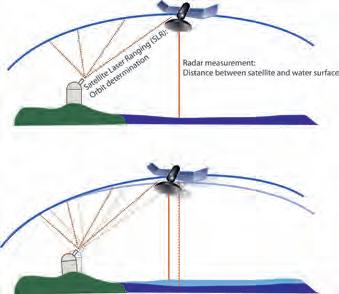
Issue 7 2023 43 Feature
Figure 1: Regional sea level rise.
Figure 2: Illustration of the effect of an inaccurate reference frame on the determination of sea level.
Wide range of applications
Apart from sea level monitoring, there are many other tasks in modern society that require a precise global reference. These applications include not only geodetic tasks (e.g. surveying, engineering, mapping, photogrammetry, geoinformation, land/ resource management and cadastre), but also other geosciences (e.g. geophysics, oceanography, hydrology, meteorology and climatology) and astronomy. A uniform reference is also required for determining the effects of climate change and for operating early-warning systems to protect against natural hazards. Moreover, the huge and evergrowing GNSS market – in which more than six billion devices are already in use today – draws on countless location-based applications (navigation, traffic and fleet management, transport logistics, control of industrial and agriculture machinery, autonomous driving, …) that now deeply pervade daily life.
How is the global reference frame defined?
The metrological basis is a uniform global coordinate system of the Earth. Such a coordinate system –called a ‘geodetic reference system’ in geodesy – is a mathematical construct in which every point on the surface, inside and outside the Earth, can be described with unique coordinates. For a meaningful interpretation of how the planet is changing, it is essential that the coordinate system is fixed and does not change over time.
The fundamental global geodetic reference system in use today is the International Terrestrial Reference System (ITRS). It was established as the primary global geodetic reference system by a resolution of the International Union of Geodesy and Geophysics (IUGG) in 2007. The ITRS is a Cartesian coordinate system, in which the position of a point is described with three metric values (X, Y, Z) with respect to three coordinate axes perpendicular to each other (Figure 3). The origin of the ITRS is the centre of mass of the Earth, including its atmosphere and oceans. The scale (unit of length) is the metre. According to the conventions of the International Earth Rotation and Reference Systems Service (IERS), the axis directions refer to a historical definition of the Greenwich meridian (x-axis), a historical
direction of the Earth’s mean axis of rotation (z-axis), and the conventional equator plane perpendicular to this axis.
How is the reference system realized?
For all practical applications, the theoretically defined reference system must be realized. This is done by determining the 3D coordinates of firmly anchored points on the Earth’s surface. These points are worldwide distributed observation stations, whose coordinates are computed consistently with the system definition with space geodetic observation techniques. Through them, the reference system is materialized and made accessible. The realization of the ITRS is called the International Terrestrial Reference Frame (ITRF).
Four space geodetic observation techniques are currently used for the ITRF computation: Very Long Baseline Interferometry (VLBI), Satellite Laser Ranging (SLR), Global Navigation Satellite Systems (GNSS), and Doppler Orbitography and Radiopositioning Integrated by Satellite (DORIS). These four observation techniques now provide observations over 25 to 40 years (Figure 4).
The (re-)processing of the VLBI, SLR, GNSS and DORIS observations over this long time span is a tremendous effort, which is done by the corresponding Scientific Services of the IAG. The three ITRS Combination Centers of the IERS, namely the Institute national de l’information géographique et forestière (IGN) in Paris, the Deutsches Geodätisches Forschungsinstitut of the Technical University of Munich (DGFI-TUM), and the Jet Propulsion Laboratory (JPL) of NASA in Pasadena, are responsible for the combination of the data provided by the four technique-specific IAG Services. The availability of three ITRF solutions ensures an evaluation of the quality of the final product, which is then released by the ITRS Center at IGN.
The key role of geodetic observatories

One of the greatest challenges in the ITRF calculation is to optimally combine the four space geodetic observation techniques into

Further reading
Angermann D., Pail R., Seitz F., Hugentobler U. (2022). Mission
Observed
Issue 7 2023 44
– Geodynamics and Climate
Earth
Change
Through Satellite Geodesy, Springer, https://doi. org/10.1007/978-3-662-64106-4
Figure 3: Cartesian coordinate system of the Earth.
Figure 4: Space geodetic techniques VLBI, SLR, GNSS and DORIS and their observation time span used for the realization of the geodetic reference system.
a consistent reference frame. Essential for this task are globally distributed geodetic observatories, on which several observation techniques are operated in parallel. Figure 5 shows the Geodetic Observatory Wettzell in the Bavarian Forest, Germany. With the four space techniques VLBI, SLR, GNSS and DORIS running in parallel, this station is one of the most important ‘core sites’ of IAG’s Global Geodetic Observing System (GGOS). Apart from Wettzell, there are only a handful of other fundamental stations on which all four space techniques are installed.

Current realization of the International Terrestrial Reference System

In 2022, the latest ITRS realization ITRF2020 was published by the responsible ITRS Center in Paris as the successor of the previous realization, ITRF2014. It contains 25 to 40 years of VLBI, SLR, GNSS and DORIS data until the end of 2020 (Figure 4) and comprises 3D station coordinates and velocities of approximately 1,900 globally distributed observing stations. The horizontal velocities of the stations as provided by the latest ITRS realization of DGFI-TUM, the DTRF2020, are shown in Figure 6. The clearly visible station motions reflect plate tectonics (with the boundaries of the lithospheric plates indicated by grey lines).
Conclusion
The realization of the global geodetic reference system ITRS provides the global reference for all geospatial data and for many tasks in modern society. With a position accuracy of approximately 5mm and a stability of 0.5mm per year, current ITRF solutions surpass all previous versions. However, the ambitious targets of the IAG have not yet been reached. The task is to further improve the accuracy of
About the authors
Detlef Angermann holds a doctorate in Geodesy and heads the Focus Area Reference Systems at the Deutsches Geodätisches Forschungsinstitut (DGFI-TUM) of the Technical University of Munich. His research focuses on the analysis of geodetic space observations for the realization of reference systems and the determination of Earth system parameters.


Roland Pail is a professor of Astronomical and Physical Geodesy at the Technical University of Munich. His research activities focus on global and regional modelling of the Earth’s gravity field, satellite missions for Earth observation, and applications in components of the Earth system (oceans, water cycle, ice masses and geophysics).
Florian Seitz is a professor of Geodetic Geodynamics and heads the Deutsches Geodätisches Forschungsinstitut (DGFI-TUM) at the Technical University of Munich. His research interests are the combination of geodetic observation techniques, reference systems and Earth rotation, the determination of changes of the sea surface, and the investigation of Earth system processes.
Urs Hugentobler is a professor of Satellite Geodesy and heads the Satellite Geodesy Research Facility of the Technical University of Munich, which operates the Geodetic Observatory Wettzell together with the Federal Agency for Cartography and Geodesy. His research topics focus on high-precision GNSS positioning as well as the precise modelling of satellite orbits.
the space geodetic observation techniques in order to implement new models and refined analysis strategies. Additionally, a better global distribution of geodetic observatories is required. The adoption of the United Nations resolution ‘Global Geodetic Reference Frame for Sustainable Development’ in 2015, underlining the great importance of the geodetic reference frame for societal demands, was an outstanding milestone in international geodesy.
Issue 7 2023 45 Feature
Figure 5: Measurement systems at the Geodetic Observatory Wettzell in the Bavarian Forest, Germany. (Image courtesy: BKG, Hessels)
Figure 6: Horizontal station velocities from the ITRS realization DTRF2020, computed by DGFI-TUM.
Redesigning surveying to support a sustainable global future
The role of surveyors in building climate resilience
By Roshni Sharma and Clarissa Augustinus, co-chairs of the International Federation of Surveyors Climate Compass Task Force
New knowledge and tools are needed if surveyors are to fulfil their critical role along the path to achieving humanity’s global climate goals related to land, water and the marine environment. Surveying systems must also be redesigned in several respects: shifting focus from data collection to analysis, integrating geospatial and climate data, designing for climate resilience and for infrastructure, and collaborative solutions.
By 2030, the world is projected to experience significant changes as a result of climate change. Coastal areas will face increasing threats from rising sea levels, leading to the erosion of shorelines and increased flooding during storms. Low-lying coastal cities and island nations are particularly vulnerable, displacing communities and threatening critical infrastructure. Hurricanes, droughts, heatwaves and wildfires will continue and accelerate in frequency, and lead to increased risks to human health and safety. The poor in the Global South will continue to experience the greatest impact, even though they contribute the least to the problem because of their tiny carbon footprints.

Changing weather patterns will disrupt agriculture systems, and crop yields will decrease due to shifting climate conditions, land degradation and desertification. Water scarcity will continue to increase. Biodiversity loss will accelerate. This will all impact on food security and will lead to increased human migration, both within countries and across borders. Surveying and geospatial professionals play a key role in understanding and mitigating these and other impacts of human-induced climate change.
Shifting focus: from data collection to analysis
The geospatial and surveying industry is
undergoing a profound transformation, shifting from its traditional emphasis on data collection – which remains fundamental – to an additional new focus on data analysis. Analysing geospatial data is crucial in unravelling the multifaceted impacts of climate change and land degradation. It enables the extraction of meaningful insights from trends, patterns and anomalies in the data, allowing for a deeper understanding of human-induced climate impacts on countries, regions, landscapes, ecosystems and communities, and facilitating data-driven decision-making.
This industry shift signifies a broader recognition of the value of data analysis in climate resilience efforts. It empowers surveying professionals to both collect data and interpret it, ultimately contributing to more effective and evidence-based climate adaptation and mitigation measures. By morphing into specialized data analysts, surveyors will bring an indispensable skillset to the forefront of the fight against climate change.
Integrating geospatial and climate data for comprehensive analysis
Climate change operates on multiple scales and dimensions – at local, national, regional and the Earth system level. Analysing geospatial data from a diverse array of sources is paramount in comprehending the multifaceted impacts of climate change. It is vital to assess land use changes, track temperature fluctuations, and monitor sea
Issue 7 2023 46
As climate change impacts are felt, floods are becoming more common and more disastrous.
In the last 12 months, increasingly catastrophic wildfires have occurred around the world.

level rise, changes in forest edges, global food production and unregulated large-scale acquisitions of land belonging to Indigenous peoples and local communities. Geospatial data, collected through satellite imagery, ground-based surveys and remote sensing technologies, provides a comprehensive view of these complex changes.
Scenario simulations, particularly digital twins, can revolutionize decision-making in climate resilience. These models are able to simulate various climate-related scenarios, providing insights into potential vulnerabilities and necessary adaptations. Digital twins enable proactive planning and management and can protect people and the planet from the escalating impacts of climate change.
Redesigning land and water systems for climate action

Climate change, land degradation and desertification are triggering a significant transformation in land use across the globe, redefining agricultural zones, urban planning and natural resource management. These shifts represent some of the most visible and pressing impacts of the changing climate. Geospatial data is a critical enabling factor in adapting to, mitigating and optimizing land use changes, including to enhance food and water security and to protect biodiversity and natural areas in a changing world.
Most natural capital (e.g. forests, grasslands, natural areas) is in the form of common property, which is generally held in some form of state or public land arrangement. Often these parcels are not documented in government land systems. Fit-for-purpose
About the authors
Roshni Sharma has traversed environmental science and management, human geography, palaeoclimatology and business. She is now making it her life’s work to harness location intelligence to create tangible positive change for society, generating real traction around sustainability and leveraging tech for good. Besides her role as co-chair of the Climate Compass Task Force with the International Federation of Surveyors (FIG), Roshni works at the forefront of the geospatial industry at FrontierSI, bringing together cutting-edge innovation into useful applications for academia, industry and government. She is also a leadership coach, proprietor of Vistaar Soft Skills Solutions, director for Geospatial Council of Australia (GCA) and the NSW Government’s Board of Surveying and Spatial Information (BOSSI), as well as co-convenor of the Space, Spatial and Surveying Diversity Leadership Network (SSS-DLN).
Clarissa Augustinus is co-coordinator and co-editor of the second edition of the United Nations Convention to Combat Desertification Global Land Outlook, Land Restoration for Recovery and Resilience (2022). In 2014, she was appointed honorary ambassador for the International Federation of Surveyors (FIG). She is also senior adviser to the Arab Land Initiative of UN-Habitat and Global Land Tool Network. From 2003 to 2015, Clarissa worked at UN-Habitat as unit leader of the Land and Global Land Tool Network, Urban Legislation, Land and Governance Branch in Nairobi, Kenya. From 1994 to 2000, she was senior lecturer in the Department of Land Surveying

Small island nations, especially in the Pacific, are already feeling the impacts of rising sea levels impacting land ownership and tenure security.

Issue 7 2023 47 Feature
boundary demarcation is essential to manage the resources in these areas efficiently and to safeguard what climate scientists call ‘protected areas’, such as game parks and forests. Land administration systems as a whole need to be made fit for purpose, efficient and effective to enable the rapid implementation and rollout of security of tenure for the achievement of global climate goals. Without land tenure security, people will continue to ‘mine’ their resources rather than maintain them. Valuers would argue that establishing property rights and pricing nature’s benefits correctly can be an effective approach to maintaining and restoring natural capital. Fit-for-purpose land valuation approaches that include natural capital need to be developed and scaled up.
Ethical and legal dimensions
Geospatial data can contribute to smarter spatial planning to reduce the footprint of agriculture, limit urban sprawl and strengthen spatial planning targeting to protect biodiversity. The ethical and legal dimensions of urban planning take centre stage, as governments grapple with issues like competition over land and property rights, management of informal settlements and flood management.
The shifting landscape of natural resource management necessitates tracking and monitoring, with geospatial data providing real-time insights into land use changes. It can support land governance and the protection of local communities’ rights to land and natural resources. It is also vital to help governments protect natural areas such as forests from illegal logging, game parks from cattle incursions, and water towers from human activity. Geospatial data-driven natural resource management underpins ethical and responsible resource extraction and habitat preservation in accordance with the legal aspects of environmental regulations and international treaties.
Marine environments
Climate change is having a major impact on marine environments, fundamentally altering the delicate balance of life beneath the waves. Coastal ecosystems – from mangrove forests to coral reefs –are under immense stress. Surveying and geospatial technologies are indispensable tools in monitoring and managing the changes. High-resolution mapping and remote sensing enables scientists and conservationists to track shoreline shifts, assess the health of coral reefs and safeguard marine resources. This also enables the monitoring and enforcement of marine regulations aimed at preserving biodiversity and critical habitats.
Resilient infrastructure
Support the ‘Homeward Bound’ Women in STEM climate leadership programme


To support a geospatial climate role model for women of colour in the industry, consider making a small financial contribution to Roshni Sharma’s participation in the Women in STEM climate leadership programme. She is one of 80 women selected globally for cohort 5 of the ‘Homeward Bound’ initiative, and will be travelling to Antarctica in November 2023 to undertake this programme. She plans to use the skills and knowledge from this leadership voyage to support workforce development in the geospatial industry. To achieve this, she has already taken steps to establish herself as an accredited leadership coach, and after her voyage will offer free professional coaching service to help geospatial professionals from marginalized communities to become impactful industry leaders. Donate at https://bit.ly/roshni-r-sharma.
Climate change poses multifaceted challenges to critical infrastructure, spanning transportation, energy and water supply systems. Rising temperatures intensify wear and tear on roads and bridges, while extreme weather events disrupt transportation networks. Energy infrastructure faces increased demand due to climate-induced heatwaves, while water supply systems grapple with shifting precipitation patterns and the threat of prolonged droughts.
Surveying and geospatial expertise stands as a crucial pillar in crafting resilient infrastructure design and adaptation strategies. Surveyors play a pivotal role in collecting precise geospatial data, enabling informed decisions about climate-resilient infrastructure placements and designs. Geospatial insights are essential for identifying vulnerable areas and optimizing resource allocation for climate adaptation. Moreover, community engagement is pivotal in ensuring that infrastructure projects align with local needs, values and long-term sustainability goals, and surveyors often have a unique relationship with local communities.
Issue 7 2023 48
Climate change is causing wildfires to spread faster and further, and making post-fire recovery harder.
Today, remote sensing is invaluable for measuring and monitoring the majority of climatic indicators.
Collaborative solutions
Successful collaborations between surveying professionals, climate scientists and policymakers have emerged as a potent force in addressing the multifaceted challenges of climate change. Surveying professionals provide essential geospatial data and analysis, offering a comprehensive understanding of climate impacts on land, water, marine and infrastructure environments. Climate scientists and environmental scientists bring their specialized knowledge, conducting research to predict and assess changes in the climate and human-induced environmental impacts. Policymakers translate this information into policies, actionable strategies, legislation and resource allocation to mitigate climate risks and avoid or limit degradation and restore the environment. Surveyors then make some of this happen on the ground.
The integration of geospatial and climate data serves as a cornerstone of evidence-based decision-making. Precise mapping, remote sensing and geographic information systems (GIS) enable stakeholders to visualize climate trends and vulnerabilities, facilitating targeted interventions. This data-driven approach enhances the capacity to adapt to climate change by identifying high-risk areas and optimizing resource allocation.

So what can you do?
In an era where our planet faces increasingly complex and unpredictable environmental challenges, surveying brings a vital technical foundation that underpins climate resilience strategies. Precise surveying and geospatial data reveal the changing land use and chart the path toward a more sustainable future. Integrating climate data and geospatial insights into surveying practices and work on the ground is not just a choice; it is an imperative. It is the synergy of these two disciplines that will help our industry maintain and build its relevance, and empower us to work with other sectors to create sustainable solutions.
In a world where climate change poses ever-increasing challenges, it is time for action. Join the movement to safeguard our planet, inform evidence-based decisions and chart a new course towards a sustainable and resilient future for generations to come. Join the FIG Climate Compass Task Force.
Further reading
https://fig.net/organisation/tf/climate_compass/index.asp https://bit.ly/FIG-CC-TF
Issue 7 2023 49 Feature







Concerns about the evolving landscape of geomatics studies
Addressing recruitment challenges in the aerial surveying industry
By Ada Perello, EAASI
From the skies to the ground, aerial surveying and mapping professionals play a crucial role in capturing, processing, analysing and publishing geospatial data. This article explores the diverse career opportunities within aerial surveying against the backdrop of recruitment challenges and concerns about the evolving landscape of geomatics studies.
Although the first photogrammetric cameras were invented 100 years ago, aerial mapping has not been immune to the technological advances that have radically transformed the industry in the last 20 years. The most recent developments have expanded the possibilities within aerial surveying. From utilizing advanced sensors and cameras to integrating Lidar and photogrammetry techniques, professionals are at the forefront of innovation. They constantly adapt to new tools and methodologies to capture data more precisely and efficiently. This continuous learning and exploration make
aerial surveying an intellectually stimulating field that pushes boundaries and fosters professional growth.
Key roles in aerial surveying
In the crewed aerial surveying industry, numerous professionals collaborate to ensure accurate data collection and analysis.
Some of the key roles include:
• Aerial survey pilots: Skilled pilots fly specific aircraft equipped with advanced cameras and sensors to capture high-resolution data
for mapping and surveying projects. They are usually in charge of managing flight permits and coordination with air traffic control.
• Camera operators/aerial survey technicians: These technicians are responsible for operating and installing the cameras, sensors and other equipment used during aerial surveying flights. They are also responsible for flight planning to meet the project’s requirements.
• Image processing specialists: Experts in aerial imagery who analyse and process the images to ensure quality and usability.
Geodesy expertise forms the backbone of various roles in aerial surveying. These professionals leverage their geospatial skills to ensure accurate and precise data collection from above, contributing to critical mapping and surveying projects. (Image courtesy: MGGP Aero)
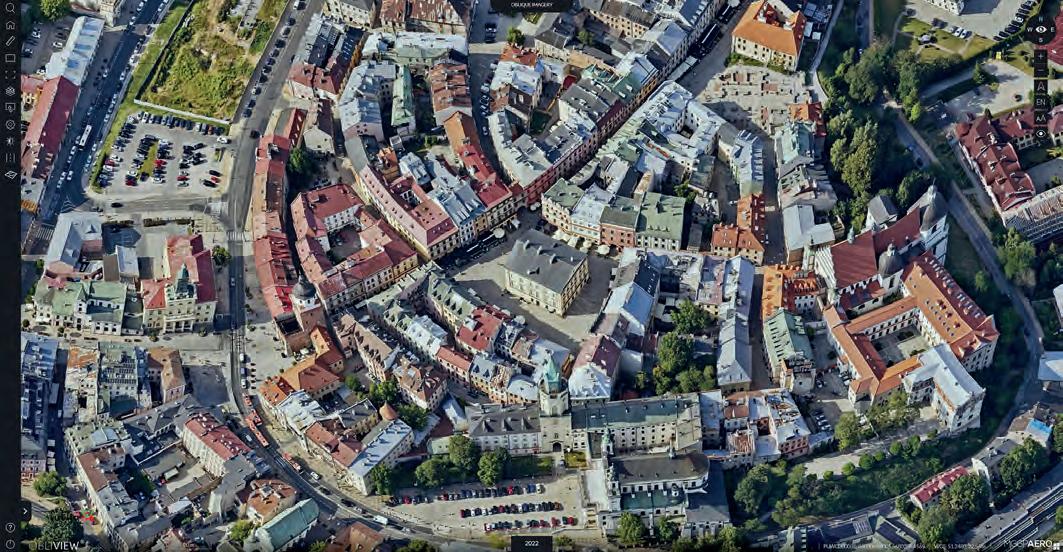
Issue 7 2023 51 Industry's View
• Survey engineers: These professionals are the ones responsible for taking measurements on the ground. These measurements are required to guarantee the quality and accuracy of the data captured from the air and its integration with ground-based mapping activities.
• Photogrammetrists: Using specialized software, these professionals convert aerial imagery into three-dimensional models, orthophotos and maps. Their expertise in image analysis and manipulation enables the transformation of visual data into accurate geospatial information.
• Lidar specialists: Leveraging light detection and ranging (Lidar) technology, these specialists process highly precise data about the Earth’s surface, including terrain, vegetation and buildings. They play a crucial role in point cloud adjustment and classification.
What’s a career in aerial surveying really like?
In the world of aerial surveying, skilled professionals play a vital role in capturing geospatial data from the skies to contribute crucial information to a wide range of projects and initiatives. Here, two member companies of EAASI shed light on their real-life experiences and provide insights into what it’s really like to work in the industry.
Bluesky International
Bluesky International is a UK-based specialist aerial survey and geographic data company, producing and maintaining high-quality, accurate digital aerial photography and height data on a national scale in both Great Britain and the Republic of Ireland. The company, which was founded in 2003, interviewed some of its employees to offer insights into the daily working lives of two key roles within aerial surveying: the airborne operator and the Lidar supervisor.
• The airborne operator’s day-to-day tasks can vary significantly, from capturing data in the skies to office-based work such as flight planning and project organization. The greatest rewards stem from successfully completing surveys and bringing valuable data home, despite the challenges posed by weather conditions and project complexities.
• The Lidar supervisor is responsible for overseeing Lidar processing, preparing deliverables such as digital elevation models (DEMs) and point clouds, and assisting with project management. The role involves collaborating closely with a dedicated team and ensuring the timely and accurate delivery of data to customers. To excel in both these professions, certain skills and qualities are crucial. Motivation, adaptability and organizational skills are highly valued in the ever-changing and weatherdependent world of aerial surveying. A willingness to learn and a good understanding of weather patterns are also advantageous for those looking to enter this field.
Sixense Helimap
Sixense Helimap, a member of the Sixense group (VINCI Construction), is a Swiss company that specializes in Lidar and photogrammetric data acquisition and processing services. Helimap’s work is distinguished by an element of adventure, since it conducts geospatial data acquisition missions via helicopters, ultralights or terrestrial vehicles. Helimap covers all continents, from New Caledonia to Mexico and Africa to Europe. With a fleet of eight full LiDAR@Photo technology kits, the company possesses the versatility to adapt to various scenarios, including Alpine glaciers, dense tropical forests and vast African plains. The company’s licence to operate outside of helicopters allows it to capture data from shaded or challenging areas that are otherwise difficult to access. This company provided EAASI with an overview of the role of a project manager:
• At Helimap, each project is meticulously managed by a dedicated project manager who oversees the entire process, from planning to data processing. These professionals actively participate in missions aboard helicopters, ensuring the accurate acquisition of Lidar and photogrammetric data. This close involvement enables Helimap’s staff to work in diverse environments, stay connected to the unique requirements of each project, and continuously learn from a job where no two days are alike.
• Cartographers and GIS experts: These technicians transform the 3D data into meaningful maps, urban 3D models, digital twins, etc., supporting decision-makers in their work.
• Data analysts: Skilled in working with extensive geospatial datasets, data analysts extract insights, identify patterns and create visualizations.
Recruitment challenges
As the list of key roles shows, there is more to aerial surveying than just skilled pilots. Working in this field calls for a solid understanding of geodesy, photogrammetry and cartography. Professionals involved in aerial surveying need a solid background in geomatics to understand aerial imagery, sensor technology and geospatial data. Given these high demands, perhaps it should come as no surprise that the industry is facing increasing challenges to find, attract and retain talent, particularly among geomatics professionals.
Connecting with the next generation at the IGSM
Recognizing the need to connect with the next generation, the European Association of Aerial Surveying Industries (EAASI) actively participates in initiatives that aim to attract potential professionals to the aerial surveying profession. One such initiative is the sponsorship of the International Geodetic Student Organisation Meeting (IGSM). This gathering brings together worldwide students and recent graduates of geodesy. The latest edition of the event took place in Valencia, Spain, from 2 to 8 July 2023, with representation from over 20 universities primarily based in Europe. During the event, the EAASI secretary general, Marcos Martínez-Fernández, participated in a roundtable discussion alongside industry representatives, academics and students. This open dialogue shed light on the evolving landscape of geomatics studies. Many students expressed their concerns about the growing trend of new interdisciplinary programmes which include geomatics in combination with other branches of
Issue 7 2023 52
knowledge, resulting in a slow fading of the core studies. They warned that this shift could potentially lead to graduates with programming skills being preferred over those with a specialized geomatics background when looking for a job.
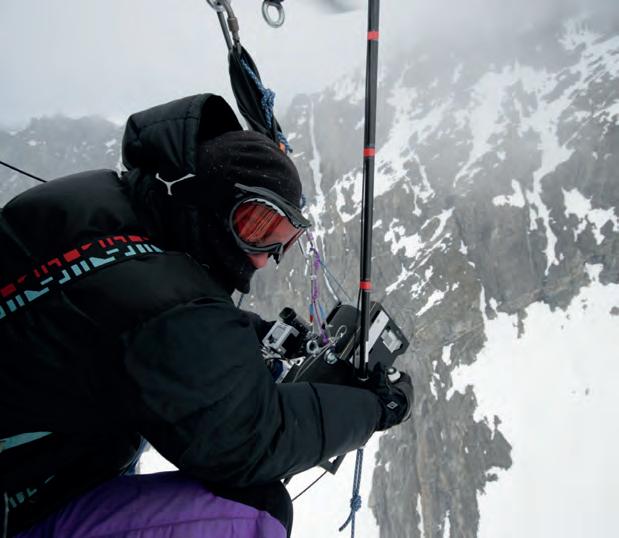
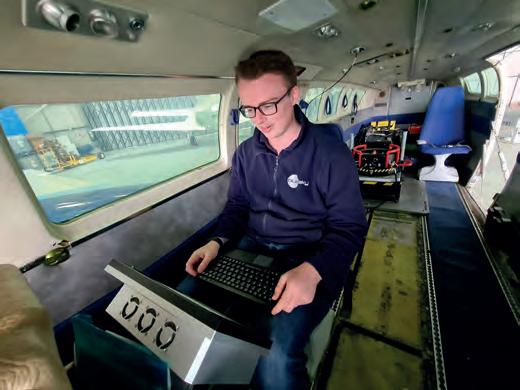
The diversification of geomatics studies
The topic of the progressive diversification of geomatic studies is not a new one. According to Fabio Remondino, head of the 3DOM research unit at the Fondazione Bruno Kessler and vice-president of European Spatial Data Research (EuroSDR), the challenges faced in recruiting highly specialized geomatics profiles can partly be attributed to changes introduced by the Bologna Plan. This has impacted geomatics curricula and influenced the direction of the field, he believes. With universities offering a broad range of interdisciplinary master’s programmes, students face the dilemma of selecting a specific field of study. Many of these programmes
place a heavy emphasis on practical work with software tools, leaving students lacking in theoretical knowledge and critical thinking skills. This trend poses challenges in attracting students to the academic and research world, as the magnetism of broad, practical skills may overshadow the importance of foundational knowledge. It is a topic of concern for the students, the research community and the industry at large. Many representatives from both the public and private sectors have stressed the critical importance of aerial surveying professionals having specialized geodetic knowledge.
Desires and expectations
Besides requiring professionals with the right knowledge and skills, the further growth of the aerial surveying industry is dependent on all stakeholders listening to the voices of the next generation, collaborating and adapting to the changing landscape. It is important to understand the perspectives of students and young graduates, since their input and concerns shape the future of the industry. A survey conducted by EAASI during the IGSM revealed that, while salary remains an important criterion in job selection, other factors such as work-life balance and opportunities for remote working also held significance for the students. By considering the desires and expectations of the emerging generation, the industry can design attractive career paths that align with their aspirations and values.
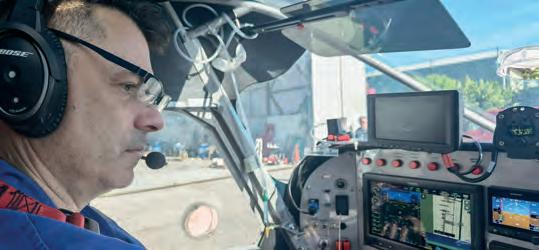
Conclusion
In line with the broader geospatial field, the field of aerial surveying faces challenges in recruiting highly specialized professionals with a geomatics background. The convergence of disciplines and changes in educational curricula have impacted the availability of dedicated geomatics courses. To address these challenges and ensure a thriving industry, enhanced collaboration between the private sector, public sector and academia is crucial. By fostering partnerships, sharing knowledge and providing opportunities for joint research and development, it will be possible to bridge the gap between evolving educational landscapes and the specialized needs of the aerial surveying profession.
“One of the biggest challenges is getting everything in place for a successful survey as there are a lot of factors that lead up to getting projects completed. So it’s always very rewarding after completing a successful sortie and bringing the data home,” says Bluesky International airborne operator Alex Brown. (Image courtesy: Bluesky International)
Issue 7 2023 53 Industry's View
Sixense Helimap’s licence to operate outside of helicopters allows the company to capture data in shaded or challenging areas that are otherwise difficult to access. (Image courtesy: Sixense Helimap)
In aerial surveying, flying is more than a mode of transportation – it’s part of the job. Adventure meets precision, and every flight brings new perspectives. (Image courtesy: MapSoft)
Data timeliness is vital for digital twins

Ride-along systems contribute to new level of geodata quality
By Frédérique Coumans, GIM International
More efficient processes and synergies bring opportunities for the effective use of digital twins in urban planning and city administration. New ways of mobile data capturing and autonomous processing are being tried out in Germany. To find out more, GIM International spoke with Markus Mohl, head of the Munich Competence Center Digital Twin, and Alexander Reiterer, professor at Fraunhofer Institute for Physical Measurement Techniques (IPM) who is researching multimodal data-gathering systems in other German cities.
Issue 7 2023 54
Markus Mohl (left) and Alexander Reiterer.
How close is Munich to completing its digital twin?

Mohl: A multipurpose urban digital twin like this is never finished, not only because the reality of the city is always changing, but also because we’re constantly refining the twin with additional data from different sources. We’ve made good progress and are using the digital model in several fields, such as for our bike path planning. And, of course, technology is pushing us further and further. For example, we want to use AR/VR (augmented reality/virtual reality, Ed.) glasses to make the digital city accessible to citizens, so we’re now working on the technical basis for this. But technology is not the most important thing when setting up a project as complex as a city digital twin; it’s even more important for all partners to talk to each other. We have to make sure that we’re well networked in order to make the most sensible use of all the data. All those responsible need to know which databases we have at our disposal, and work together on interoperability issues. In Munich, we’ve had a city-wide geodata management system since 2006, which means we closely cooperate across all departments to make efficiency gains possible. This approach is now proving its worth once again in the context of the digital twin.
The data is mainly provided by sensors. Is that going to change?
Reiterer: Since we’re all into 3D now, Lidar sensors are increasingly being used in addition to cameras for capturing urban spaces. This has led to the possibility of automating certain processes, such as deriving real geometric information from point clouds. Today, to build high-resolution 3D digital city models, we need multimodal systems… in other words, a variety of sensors that record a city from every conceivable perspective – from the air, from road vehicles, or even from bicycles or cargo bikes. And all of this with the highest possible temporal frequency.
Mohl: Indeed, in Munich, in addition to conducting traditional road surveys, we have already recorded data using a cargo bike in combination with point clouds acquired from drone-based devices, for example. Of course, we build on the geometric data to get as accurate a representation of the cityscape as
possible: where are road markings, traffic signs, vegetation and so on? We enrich the whole thing with aerial photos and different sensor data, including satellite data and floating car data. Then we create a lane model and other models that we can use for all kinds of analysis such as traffic simulations and air pollutant simulations. In my view, when it comes to digital twins, everything boils down to the timeliness of the data.
How can this ‘timeliness of data’ be further improved?
Reiterer: At Fraunhofer IPM we now have a research project called ‘Multimodal Twin for a Safe and Sustainable City’ (MuSiS) which is focused on the timeliness of data. The next step in digital twin projects will be to provide measurement technology that is installed on garbage trucks or buses, for example, to map the surroundings. This is in addition to the special measurement vehicle that conducts surveys less frequently. Our concept here is a small, lightweight measurement box that functions autonomously and is largely maintenancefree. While the vehicles are on the road, the sensors collect data in passing. The main issue for us scientists at the moment is data handling, because the project is generating several gigabytes or even terabytes of data per day, so we’re developing strategies to reduce this data intelligently. We will use machine learning processes that interpret the data and convert it into simple polygons and bounding boxes, including semantic information. We’re currently

Interview Issue 7 2023 55
Fraunhofer IPM is integrating a variety of sensors into a vehicle-mounted measurement box. The sensors collect data while the vehicle passes. The data is autonomously reduced and streamed in real time into the city’s geodata service, where it is AI-processed and converted into geodata-compliant data formats. (Images courtesy: Fraunhofer IPM)
trying this out in a joint project with the cities of Mannheim, Heidelberg and Freiburg together with AI (artificial intelligence, Ed.) experts from Incontext.technology GmbH. We stream the reduced data in real time to the city’s geodata service, where it is automatically processed by an AI solution and converted into geodata-compliant data formats. Such ‘ride-along’ systems may not achieve the same completeness or accuracy as specialized vehicles, but what we do achieve is a high temporal clock rate of the surveys. Combined with data from special measurement systems, we get a totally new level of geodata quality.
Will ride-along systems add value for Munich?

Mohl: The benefits of this approach are obvious. Multiple sources of data provided in real time would significantly improve data quality in a digital twin. But from a municipality point of view, we have to make sure that it is cost-effective too. If data recording and data transfer are performed autonomously and maintenance can be kept at a very low level, I’m very confident that this concept will be put into practice. But of
course, we also have to take into account labour law issues, and privacy and data protection for employees and civilians in the municipalities.
How does the MuSiS project take data protection into account?
Reiterer: Data protection is a serious issue when it comes to recording public space in general. We already have processes that anonymize the data stream between the recording system and the storage medium: people’s faces or licence plates, for example. Much of the personal data is already eliminated during data interpretation; where there was a car, there is only a polygon in the evaluated image. However, people are always initially sceptical when they see measurement systems in their city. We have to campaign for acceptance and explain the benefits of this technology: this is not about surveillance. The issue of making data public is something that needs to be discussed. I believe that it contributes to acceptance if everyone can see what is available. On the other hand, there are safety risks. So I agree that not all data should be made available to the general public.
On the topic of multimodal measurement, which data types have your particular attention?
Reiterer: First of all, there is the classic geometric data of the urban environment, which has to be of optimum quality. From this, we can derive various parameters, such as shadow scenarios or reflection surfaces. The latter are interesting for mobile communication: where is reception poor? Reflections play a major role here, especially when it comes to the 5G mobile network. Of course, RGB colour information is important too. Recently, we also integrated a noiselevel meter into the measurement box, because noise pollution is an important topic in cities. The same applies to temperature distribution. Where are the hotspots in the city? In the MuSiS project, we also record lighting data by using a luxmeter and deriving information from camera images.
Mohl: I can testify to the demand for lighting data. I recently had an interesting conversation with a group of young people who were wondering why they felt uncomfortable in some places in the city. They wanted to know whether this
Issue 7 2023 56
The city of Munich decided by referendum to allocate significantly more space to bicycle traffic. The Mobility Department used the digital twin during the public debate and received very positive feedback. (Image courtesy: City of Munich)
could be due to the lighting situation, and whether such effects could be seen in a digital twin! On a more general level, I am focused on data fundamental to our ability to create meaningful simulations so that Munich can be carbon-neutral by 2035. The digital twin will help to achieve this goal. We started a few years ago with the aim of reducing urban air pollution, and we initially focused on transport and mobility. Then we enlarged the scope, such as to heat in the city. Today, we simulate the most efficient ways of cooling down heat islands: do we need to plant 20 new trees on a street or would five be enough, in which case where should we plant the remaining 15? We also use the digital twin to analyse and drive the expansion of the charging infrastructure for electric cars. Heat maps allow us to visualize where charging stations are used particularly heavily, and where there’s less activity. This tells us where the need is greatest.
Do you use the digital twin for citizen participation in Munich?
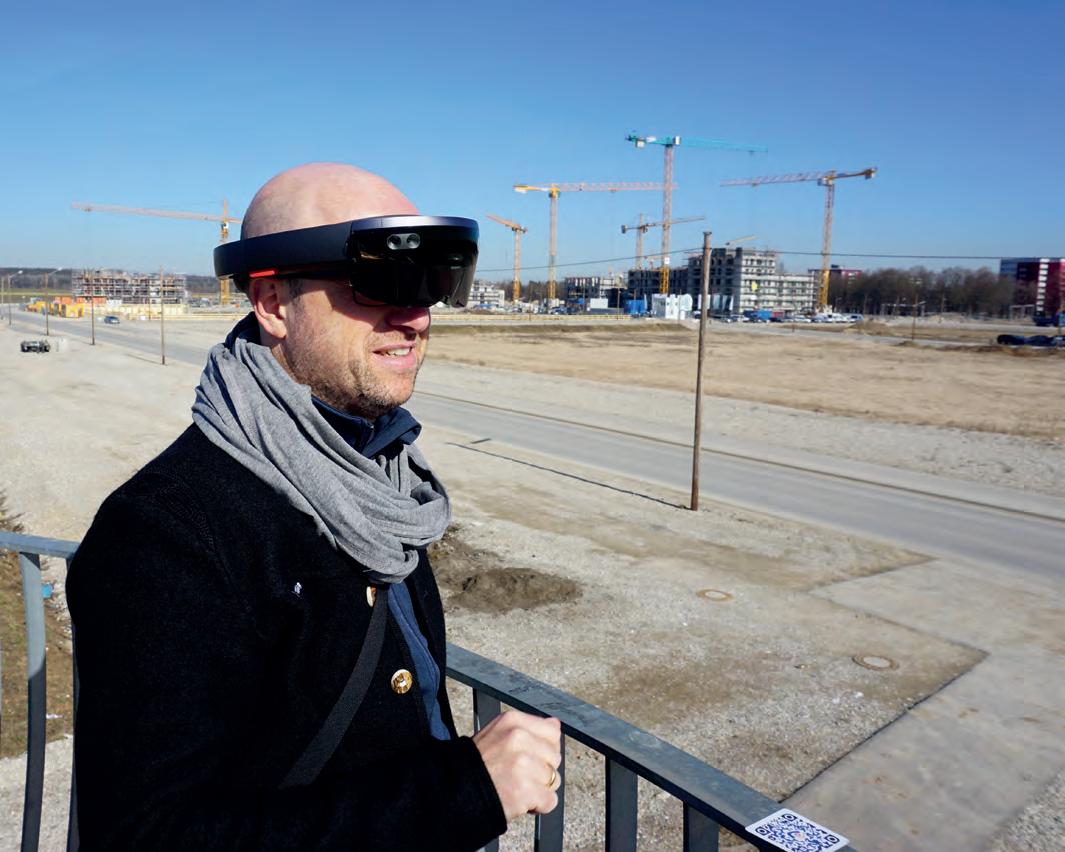
Mohl: Yes, although we’re taking it one small
or even entire lanes – being eliminated. Of course, this is a cause for public debate. We supported our Mobility Department in this process, including by presenting the respective situation not as a CAD plan, but as a real visualization in the form of videos and within mobile apps to allow people to see the ‘before and after’. We received very positive feedback, and that is quite rare in such infrastructure processes. Mind you, we’re careful not to show ‘blooming landscapes with happy people’, as real-estate developers often do. In our visualizations, we make sure that we only use our own collected data. Once people get used to this contemporary way of visualization, we expect to be able to go further and also use our digital twin to answer citizens’ questions resulting from all sorts of new municipal policies.
Looking slightly further ahead, will a multipurpose digital twin be standard in every city in ten years’ time?
Mohl: A great deal is happening in this area in Europe. In our region, for example, there is the ‘TwinBy’ programme, which supports small
If I want to do traffic planning, I don’t benefit from including all the dormers on the roofs. So first the question is: what is needed? Then the next question is: what data do I need for this? Knowing the goal beforehand avoids the pitfall of simply capturing as much data as possible, and associated challenges such as how to keep the models updated and the risk of privacy issues.
Reiterer: As far as technology is concerned, I see three issues. Firstly, the sensors must become very small so that they can be integrated into all kinds of mobile platforms, yet at the same time they must be powerful. The second point is data refinement: we need to move away from point clouds to application-oriented data processing. I still see a lot of potential in real-time use. Just think of climate data – such data has to flow into digital models instantaneously rather than three weeks later. But the breakthrough will only happen when we succeed in involving citizens in such a way that they participate in the collection process and feed data directly into the digital model – by using
Interview Issue 7 2023 57
GIM International interviews Greg Demchak, director of Bentley’s Digital Innovation Lab

Towards immersive 3D collaborative experiences
By Wim van Wegen, GIM International
In this exclusive interview, Greg Demchak, director of the Digital Innovation Lab at Bentley Systems, discusses the captivating intersection of geospatial technology, infrastructure design and the emerging concept of the metaverse. Demchak emphasizes the potential of linking 3D engineering models to game engines, creating immersive experiences, and revolutionizing the accessibility and user-friendliness of these models. He also touches on the prospects of digital twins, advancements in reality capture and the integration of artificial intelligence (AI). Demchak’s insights shed light on the challenges that await the geospatial industry, but also the transformative possibilities and the exciting future of this dynamic field.
One of the key characteristics of the geospatial industry is that we create industry-changing solutions to challenging problems. How is Bentley Systems contributing to this?
In our Digital Innovation Lab, which we call iLab, we’ve been exploring some exciting new technologies related to infrastructure development. We know that many organizations already invest in creating 3D models using software and share them with stakeholders. Recently, there has been a
lot of buzz around the metaverse and Facebook has changed its name to Meta. So we decided to dig deeper into this metaverse concept, just as we have done with AI, and see if it has any relevance to infrastructure design and construction. And we found out that it absolutely does! We believe there’s enormous value in using metaverse technology to experience and make decisions about infrastructure in new and immersive ways. When we talk about the metaverse, we’re not just talking about a social space with avatars. It’s much more than that; it’s a networked interaction with 3D content on a large scale, creating a persistent environment where multiple people can join in. And so we came up with a way to connect 3D engineering models to game engines. This allows users to explore these models as if they’re playing a video game but with the actual high-quality engineering details. Imagine being able to navigate through complex 3D models with others and, with just one click, dive into a one-to-one virtual reality experience! It makes these engineering models more accessible, user-friendly and approachable – no more complicated processes. This is an exciting development that opens up numerous opportunities for more people in the supply chain to engage with, and benefit from, these 3D models. It’s all about making 3D modelling investments more accessible and enjoyable.
With their ability to process vast amounts of data and enable sophisticated simulations, digital twins have the potential to revolutionize various fields. What future possibilities do you envision? And which important steps still need to be taken? Interestingly, when we talk about digital twins, not everyone agrees that a 3D model is necessary. I won’t deny that you can have a digital twin that solely relies on IoT (Internet of Things, Ed.) data, and decisions can be made based on that data. However, Bentley has a unique value proposition in this regard. Not only can we provide raw data from sensors, but we can also contextualize that sensor information within a geolocated model. This contextualization gives you an additional layer of understanding about the corresponding
Issue 7 2023 58
real-world assets, such as bridges, facilities or even entire cities. It allows you to see information flowing and being contextualized in a 3D world, plus it can be continuously synced and visualized in real time. In a way, it’s similar to the experience with services like Uber or Deliveroo, in which customers can track the real-time location of the driver on a map. We’re taking that concept to the next level by applying it to asset management, such as monitoring rail networks or tracking the status of electrical systems or occupancy systems in buildings. To handle the scale and complexity involved, it’s essential to have a live connected and constantly updated
mounted laser scanners or even robotic devices, and then apply intelligent algorithms to analyse that captured reality, it becomes possible to track construction progress almost automatically without adding complexity to the workforce. By automatically capturing and applying machine learning algorithms, you can detect and compare progress against the planned 4D/3D model. At the very least, you can compare the progress of installations according to the plan. This process can be automated without too much hassle. I’m seeing a lot of movement in this space, with various players trying to find solutions for automatic tracking based on laser scanners, cameras and head-mounted displays. This development holds value, especially in situations like claims disputes. Having a recorded comparison between the planned progress and the actual progress can help to resolve such issues. In fact, in the future, insurance companies may even make a digital method of recording construction progress a condition for coverage. The advancements in this space can lead to safer construction sites and improved project predictability.
What is Bentley’s perspective on the autonomous reality capture trend and its potential to establish intelligent digital realities?
Our platform fully supports the integration and combination of various forms of reality capture, including point clouds, photogrammetry, meshes and photography. We have the capability to geolocate this information into the digital twin. Our platform is open and flexible, allowing for the seamless influx of these data sources. In fact, users can even build their own version of the platform.
database where information flows in and out in near real time. We’ve been working on solving this problem by transitioning from a file-based approach to a networked and cloud-based approach. It’s a shift from moving files around to leveraging live API connections for accessing information. I believe there’s immense value in this approach. So in a nutshell, the key challenge lies in supporting this shift and creating a dynamic, interconnected system for effective asset management.
On the topic of data collection and enrichment, this still poses a challenge for many companies in the construction sector in particular. How can this be addressed?
There’s certainly a significant amount of investment happening in the startup space in construction, particularly around reality capture solutions. Updating a 3D model as the basis for a digital twin for a complex construction project can be challenging and messy. However, if you can capture the reality of the construction site using tools like 360⁰ cameras, handheld or body-
One example of leveraging reality capture on our platform can be seen through our partnership with Evercam, an ITwin partner based in Dublin. They have deployed timelapse construction cameras on construction sites worldwide, and they have successfully integrated their camera feeds with our 4D model. This integration allows users to align the camera footage with the project plan as a form of reality capture, which demonstrates the progress that is being made in this field.
While we are actively exploring new technologies in iLab, it’s important to note that we don’t currently have a direct pipeline for reality capture. However, we are experimenting with technology called NeRF, which stands for neural radiance fields. This could allow users to capture a video using their smartphones, and then an accurate recreation of reality could be generated through AI within minutes. This approach differs from traditional point clouds or meshes but provides highly accurate captures as the basis for generating a mesh. So NeRF is certainly an exciting space to watch, particularly with NVIDIA’s involvement. Additionally, we have been testing a product called Luma AI, which allows users to easily capture objects or landscapes in impressive realism and offers a new way to create lifelike 3D models using AI on an iPhone. These examples of the ongoing advancements give a glimpse of where reality capture is heading.
And what is your view on developments in robotics such as Spot, the robot dog?
I think robots can absolutely play a role in this domain. The decision whether to deploy a robot autonomously versus using a 360⁰ camera attached to a worker’s head comes down to costs; you need to weigh up the price point and determine which option is more cost-effective.
Issue 7 2023 59 Interview
“Combining reality capture with algorithms makes it possible to track progress automatically without adding complexity”
However, there’s no denying that a robot can effectively navigate a construction site and perform continuous scanning. In addition, there have been significant advancements in drones in terms of autonomy. Companies like Skydio have made exciting progress in enabling autonomous flights. They have even developed techniques enabling drones to detect in real time whether they are capturing enough images to create a photogrammetry mesh. This increasing autonomy in drones is highly valuable, especially for capturing existing conditions in areas that may be inaccessible for a robot dog.
Rapid digitalization, including autonomous reality capture, is exponentially increasing the volume of data generated, gathered and stored. How can we ensure that all this data is used to create value?
First of all, it has to be accessible. The experience of accessing data should not be difficult or challenging; it should be just one or two clicks away for users. It shouldn’t take a week to process something, and users shouldn’t have to be computer scientists to extract the value; it should be instant. The key challenge lies in bridging the gap between data capture and the user experience in the shortest possible time, allowing people to react to the content
before it becomes outdated. This is precisely what we have been focusing on in our work, particularly with our development of the Unreal Engine pipeline. Our goal is to streamline the process so that a BIM model existing in the iTwin platform can seamlessly transition into Unreal Engine with just a few clicks. Users can then navigate and explore the model without the need to wait for an extended period or hire an external agency for manual geometry optimization. By cutting out the work by middlemen and shortening the time to the user experience, we aim to enhance the value derived from the data.
In 2022, you predicted that the metaverse will transform infrastructure. How exactly will this occur, and what is the current status of the metaverse?
We have already developed some example prototypes. While they are not yet available commercially, we have been able to demonstrate the functionality of multiple people gathering together and navigating highly detailed 3D models in real time through a web browser. This aspect is particularly exciting. For example, in online team meetings, we’re currently accustomed to joining a meeting and seeing each other through 2D graphics while sharing audio. The metaverse, on the other hand, could give you that level of engagement while being together within a shared 3D engineering model. One person could be using a web browser, another could be in virtual reality (VR), and someone else might even have an augmented reality (AR) experience. As Marshall McLuhan is quoted as saying, “the medium is the message”, and this resonates strongly with the metaverse. This emerging concept introduces a powerful medium that unlocks unprecedented levels of communication, interaction and engagement. Similarly to how television revolutionized our interaction with content, surpassing the limitations of books or radio, with the metaverse we are now embarking on a new era where we can collectively partake in immersive three-dimensional collaborative experiences of a diverse range of content. This new

Issue 7 2023 60
The metaverse could offer a heightened level of engagement by enabling interaction within a shared 3D engineering model between participants using web browsers, VR (as seen here) or even AR.
medium offers engineers, superintendents, the public and stakeholders an opportunity to engage with one another in entirely novel ways, enhancing the overall infrastructure development process.
In the context of the AI debate, what is your take on its impact on the geospatial industry?

We have already seen practical applications of AI within the geospatial industry. For instance, machine learning algorithms can be trained on drone-captured photographs to detect cracks, defects or rust on structures. This provides a trustworthy and efficient method for identifying potential issues. However, it’s important to keep in mind that this application of AI stays within the bounds of its intended purpose, and doesn’t raise concerns about malicious intent or the creation of deep fakes. If we venture into the realm of chat-based AI such as ChatGPT, things become even more intriguing. Imagine a scenario within the metaverse where stakeholders and engineers gather in a shared space. Each
participant could have their own AI bot capable of understanding natural-language voice commands. You could simply ask your AI bot to guide you to high-risk areas in the model or to point out clashes between the MEP and structural systems. The AI bot would respond by visually directing you and highlighting the specific issues to focus on. This kind of AI augmentation has the potential to greatly enhance how people interact with and understand complex models. Instead of relying solely on visual inspection or sifting through reports generated by clash detection models, natural-language conversations with AI bots can provide dynamic and interactive insights. It’s an exciting prospect that opens up new possibilities for efficient collaboration and issue identification in the geospatial industry.
What do you regard as the biggest challenges facing the geospatial industry as a whole in the coming years?
That’s a really good question. Let me think... I believe the biggest challenge is to embrace the concept of high-fidelity digital capture
at various levels of detail. There’s a vision that there could be a constantly updated digital twin of the entire planet, going beyond what platforms like Google Earth or Google Maps offer. It would allow us to zoom in to incredibly fine levels of detail, down to something as specific as the sensor on a pump. However, tackling this challenge is complex. We need to address the scalability aspect, from a global scale down to individual sensors, while ensuring security and restricting access to authorized individuals only. Then once we have established this access-controlled digital twin of the planet at different scales, another challenge arises: enabling real-time contributions to continuously aggregate and expand the digital twin. There’s remarkable potential for every citizen to actively participate in this system. Imagine a scenario in which an average citizen could use their smartphone to scan a street and identify a significant crack or pothole. This information would become a valuable addition to the digital twin, and an automated maintenance crew could quickly address the issue.
Issue 7 2023 61 Interview
Bentley Systems and Siemens are joining forces in Berlin for a major urban development project spanning over 70 hectares. Named Siemensstadt (Siemens City), this ambitious initiative will reshape the cityscape. Utilizing Bentley technology, a digital city twin will facilitate seamless collaboration and connectivity among engineers, architects, surveyors, and construction teams.
The geospatial industry is seriously struggling to attract new talent. What would be your message to motivate young people to consider a career in geospatial?
The geospatial industry is indeed currently facing challenges in attracting young and skilled individuals. To school kids and highschool pupils, my message would be this: We all share one planet, and we need to envision the kind of world we want to live in. And what better way to do that than through geospatial representation, such as the digital twin? Nowadays, we have the incredible opportunity to create and render our envisioned world using game engines. Instead of solely building virtual worlds for the gaming and film industries, we can utilize these tools to shape the actual planet we inhabit. Imagine a reality in which everyday life is just as thrilling – or perhaps even more so – than any video game or film you’ve ever experienced. Reality can be even more astonishing than fiction itself. So I would encourage young and talented individuals, including aspiring game developers, to explore this space. We have been diligently developing tools that allow people to delve into this realm. In this context, I would like to take the opportunity to highlight our iTwin platform, which can be accessed at https://developer.bentley.com. We welcome developers from all backgrounds to get involved and make use of this platform to build, manage and expand their digital twin solutions. Together, we have the power to create a world that surpasses our wildest imaginations. Join us in shaping the future through the geospatial industry!

Greg
is director of
Systems. With over two decades of experience in the architecture, engineering and construction (AEC) software industry, Demchak is a leader who has a deep understanding of digital twin technology and its potential to transform the built environment. In his role at the Digital Innovation Lab, he is responsible for leading a team of experts who work collaboratively to create tangible prototypes and develop innovative solutions to enhance human-computer experiences and unlock new modes of interactive communication. He holds a bachelor’s degree in Architecture from the University of Oregon and an MSc in Architectural Studies from the Massachusetts Institute of Technology.

Issue 7 2023 62
Demchak
the Digital Innovation Lab at Bentley
About Greg Demchak
Evaluating aerial laser scanning for seafloor mapping automation
Shallow seabed mapping based on airborne Lidar bathymetry
By Łukasz Janowski, Paweł Tysiąc and Agnieszka Kubowicz, Poland
Airborne Lidar bathymetry (ALB) is a modern measurement technology for obtaining rapid depth measurements in shallow underwater environments. The technique allows recording of the depth below the Secchi disk. ALB datasets are suitable for nearshore coastal mapping purposes, including the determination of submerged morphological bedforms and coastal protection structures. This article presents a novel methodological approach to understand and assess the suitability of ALB for the automatic classification and mapping of the seabed.
Human expansion into coastal areas and their intensive use for economic and recreational purposes require information on their state, evolution and functioning. Effective management of the coastal zone, making full use of its resources while ensuring the safety of people living in it, makes it crucial to monitor and map this zone, which is challenging from a technical and logistical point of view.
Shallow coastal mapping
Coastal mapping is one of the fundamental tools supporting coastal engineering. It is an important element in monitoring and assessing the condition of the shore and the coast and makes it possible to identify the areas that are
most sensitive to erosion. Therefore, it enables the effective and economical management of coastal protection. In the case of protected shores, surveying makes it possible to verify the functionality and efficiency of the reinforcement applied, which further contributes to the improvement of engineering practice.
Bathymetric Lidar measurements can provide capability for the measurement of shallow coastal areas. Compared to acoustic systems, they allow for much faster surveys in shallow areas at a lower cost. A bathymetric laser scanner uses a green (532nm) beam to register the depth below the water surface. Compared to topographic scanners, this is
characterized by higher power and lower laser pulse frequencies, due to the longer return time of the reflected echo beam.
The identification and classification of seabed geomorphology from remote sensing datasets can be performed manually, automatically or semi-automatically. Manual mapping is laborious and time-consuming and requires expertise by preferably one interpreter. Therefore, this study proposes a method for automatic mapping of the shallow seafloor based on ALB datasets for the Southern Baltic.
Study sites and acquired datasets
The study area was located on the Polish coast of the Southern Baltic (Fig. 1). Six polygons

Issue 7 2023 63 Feature
Figure 1: The study site and its location in Europe. Location of particular research areas N1–N4 (natural polygons) and A1–A2 (areas modified by anthropogenic pressure). Basemap: OpenStreetMap.
along the coast were selected for the study, representing strips of the seabed extending from the shoreline to a depth of about 5.5m. Four of these areas have a natural environmental character and two (near the towns of Rowy and Ustka) have been anthropogenically modified. The developed processing methods were also applied to a 48km shoreline section of the Southern Baltic.
The study used ALB data from the Maritime Office in Gdynia (https://www.umgdy.gov.pl/) via the SIPAM portal (https://sipam.gov.pl/). The data were in the form of bathymetry digital elevation models (DEMs), created using a registered point cloud in the .las data format. The measurements were obtained by OPEGIEKA with the following specifications: minimum average scanning density of 2x12.4 points/m², average point horizontal error (XY) of 0.02m and average point vertical error (H) not exceeding 0.07m. The resulting model in the form of a terrain model is presented in Figure 2.
Manual classification of the bedforms
The spatial extents of nine types of bedforms and three types of anthropogenic structures were separated manually based on interpretation and analysis of the ALB by qualified geomorphologists. The analysis was supported by additional investigations of the seafloor relief and interpretation of depth, slope and aspect (including delineation of edges, slope bases, bedform ridges and trough form axes). Thus, 13 classes of objects were distinguished: artefacts, undulating bed, undulating bed with artefacts, plain bed, plain bed with artefacts, other irregularities, uneven trough bed, linguoid (tongue-shaped) ripples, straight or sinuous ripples, groynes, submerged breakwaters, artificial reef modules and peat.

Automatic processing of the ALB datasets
The ALB bathymetry allowed the extraction of a total of 21 attributes, such as slope, aspect, rugosity and curvature, plus more advanced attributes such as geomorphons or multiresolution ridge top flatness (MrRTF). These were subjected to a feature selection algorithm whose results were further used for classification.

Ground-truth control points were generated based on manual classifications and a random process. They were separated for training and test samples and used as input for supervised classifiers. Automatic delineation and classification of the bedforms were carried out using geographic object-based image analysis (GEOBIA). This allows the segmentation of the remote sensing images (useful for delineation of the coverage of structures) and classification based on previously generated groundtruth datasets. All algorithms may be used in a semi-automatic way, to reach objective results. This study tested several segmentation and classification algorithms and selected the ones with the best results. The performance of the classifiers was measured using typical statistics such as producer’s, user’s and overall accuracy.
Performance of proposed predictors and machine learning classifiers
Analysis of the feature selection confirmed that all attributes were important for automatic classification, so all of them were used as inputs for the analysis. Initially developed for hydrology, MrRTF emerged as a good predictor for sandbar crests and tops of smaller bedforms such as megaripples, so was suggested as a potential diagnostic for the determination of such nearshore bedforms (Fig. 3).
This study proved that the random forest (RF) classifier is appropriate for the precise automatic classification of bedforms and anthropogenic structures based on ALB measurements. RF had the highest performance of all the classifiers that were tested. Overall comparison of its results with manual classifications showed a good agreement for all major types of bedforms (Fig. 4). The same algorithm performed well in more complex areas with a mixture of natural bedforms and anthropogenic structures on the seabed (Fig. 5), as well as the 48km-long nearshore environment of the Southern Baltic. The accuracy in all scenarios varied between approximately 75% and 91%, with a median of 84%. A stand-alone expert opinion showed that the resulting divisions are feasible and correct.
Will automatic classification replace manual interpretation?
The presented research covers various aspects of determining and evaluating
Issue 7 2023 64
Figure 2: Example section of the ALB dataset provided by the Maritime Office in Gdynia. A: Lidar point cloud classification, ground level; B: Intensity reflection of an ALB point cloud; C: Digital model of the terrain (coloured by height).
shoreline (Southern Baltic). Black lines with numbers 1–3 represent manually delineated sandbar crests. Basemap: OpenStreetMap.
automatic mapping methods based on ALB datasets. Nine types of bedforms and three types of anthropogenic structures occurring in the nearshore zone of the Southern Baltic were distinguished, proving the suitability of high-resolution ALB datasets for automatic mapping of the nearshore zone. The extraction of the MrRTF can be efficiently applied to the automatic delineation of sandbar crest courses, which are of high importance for coastal protection. Spatial coverage of the ALB presented in this study shows that there is still a potential for improvement in the precision and penetration range of bathymetric laser scanner measurements. Although many geomorphometric attributes were tested, secondary features from other sources or at other spatial scales may improve the classification performance. Therefore, while there is still room for further progress, significant advances have been made in the field.
The initial release of this article appeared in Hydro International, a globally recognized media brand in the field of hydrography.
Further reading
Janowski, L., Wroblewski, R., Rucinska, M., KubowiczGrajewska, A., & Tysiac, P. (2022). Automatic classification and mapping of the seabed using airborne Lidar bathymetry. Engineering Geology, 301, 106615. doi: https://doi. org/10.1016/j.enggeo.2022.106615


This research was funded in whole by the National Science Centre, Poland [Grant number: 2021/40/C/ST10/00240]
About the authors
Łukasz Janowski holds a PhD in Earth Sciences. He has been an adjunct at the Maritime Institute, Gdynia Maritime University, since 2019 and has authored several articles and conference proceedings. His research interests include remote sensing, object-based image analysis, geographic information systems, underwater acoustics, marine geology, geomorphology and benthic habitat mapping.
Paweł Tysiąc specializes in the use of devices that record images in space. These methods allow for the remote acquisition of information about the measured object and the development of a number of analytical methods to improve the safety of people and the environment.


Agnieszka Kubowicz holds a PhD degree in Earth Sciences. She has been an adjunct at the Institute of Oceanography, University of Gdańsk, since 2012. Her main research interests include coastal engineering, marine geology and geomorphology.

Issue 7 2023 65 Feature
Figure 4: Comparison of the manual (left) and random forest (right) results of automatic classification for natural areas. Basemap –supporting orthophotomap from the same flight survey.
Figure 5: Comparison of the manual (left) and random forest (right) results of automatic classification for anthropogenically modified areas. Basemap – supporting orthophotomap from the same flight survey.
Democratization, challenges and education
Push-button tools in photogrammetry
By Bashar Alsadik and Francesco Nex, University of Twente, The Netherlands
The advent of professional consumer-grade software in modern photogrammetry such as Pix4D, Metashape and Zephyr has been nothing short of revolutionary. These tools make the creation of 2D maps and 3D models possible for users not schooled in geospatial science, paving the way for the widespread use of photogrammetry in a multitude of application domains. However, the high level of automation of these tools has made photogrammetry so accessible that it gives the impression that maps and 3D models can be generated just by pressing a few buttons. The use of photogrammetry as a black box has therefore promoted the emergence of ‘buttonologists’, who apply software interfaces and functions expertly but lack a deep understanding of the scientific principles of photogrammetry and remote sensing. The surge in artificial intelligence and social media with every day more innovative content, and a growing cross-disciplinary interest in always up-to-date 3D geoinformation, have further triggered and influenced the development of photogrammetry and remote sensing. In this article, we discuss the implications of these trends and their impact on training and education.
Intersection of disciplines: a concept shift and unforeseen consequences
The use of push-button software in photogrammetry has reduced the technological differences between professional sectors and promoted the use of photogrammetry by experts in a variety of industries, including architecture, water management, forestry, urban planning, infrastructure inspection and cultural heritage (see Figure 1). Thanks to open-source and affordable commercial
software, as well as low-cost cameras and UAV platforms, these professionals can independently collect and process imaging data without the need for solid photogrammetric knowledge. While this can encourage creativity and expand practical applicability, it represents a challenge for photogrammetry experts (companies, educational institutes, etc.) on how to contribute to this societal change in the right way. Photogrammetry practitioners appear to have different priorities: accuracy
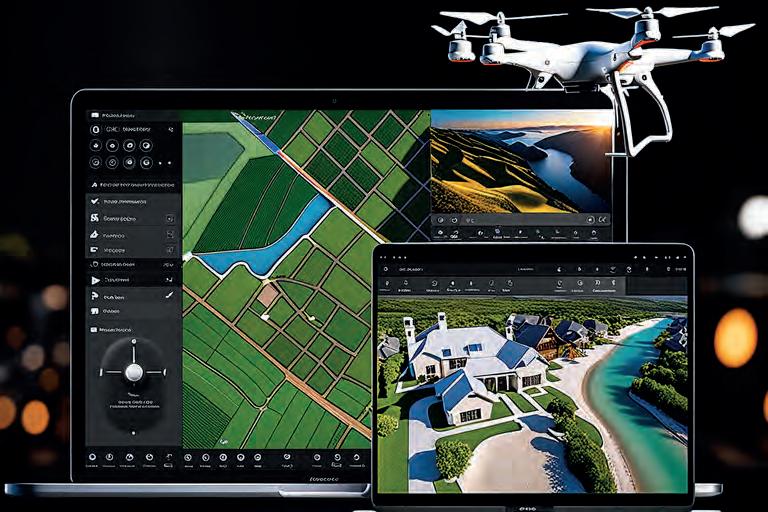
is not always one, while fast and nice-looking results seem to be the main requirement in many domains. These new priorities, however, cover only part of their needs.
For example, a nice-looking 3D model is enough for an architect if it is only needed for visualization purposes, but metric accuracy is still a must when measurement and geometry information are required. For agronomists, relatively inaccurate geolocation is acceptable for single crop

Issue 7 2023 66
monitoring flights, but more relevant when multi-temporal series are acquired, as shifts between time series will jeopardize conclusions on crop health or growth. Dealing with geographic information also brings additional challenges regarding the environmental and operational conditions, which requires specific expertise that professionals in many domains lack.
These examples highlight the importance of recognizing the limitations when relying on automated push-button tools alone. Without the basics of photogrammetry, users can misunderstand their results, often overestimating the accuracies and possibilities of photogrammetric products. This emphasizes the benefits of encouraging collaboration and knowledge exchange between nonspecialists and dedicated photogrammetry professionals.
Social media and online learning platforms: facilitating learning but expanding challenges
In response to the push-button trend and with a financial profit aim, some professionals (not necessarily photogrammetrists) have turned to media platforms such as YouTube – which has hundreds of video tutorials on creating 3D models using photogrammetry – or online learning platforms such as Udemy to offer customized tutorials (Figure 2). Wikipedia states that, as of June 2023, the Udemy platform had over 210,000 courses and more than 75,000 instructors teaching courses in about 75 different languages. About 66 of these were photogrammetry-related courses costing €20–40 each and either relying on professional tools such as Pix4D or open-source tools such as Blender.

Certainly, this democratization of learning in our field of photogrammetry and remote sensing increases accessibility, but might inadvertently encourage the rise of buttonologists. On this kind of platform, quick task-oriented tutorials often put software proficiency in the first place: quick and nice-looking 3D models are
About the authors
Bashar Alsadik is an assistant professor of photogrammetry at the ITC Faculty of Geo-Information Science and Earth Observation at the University of Twente in the Netherlands. His main research interests are in photogrammetry and geomatics. He has worked in the academic and industrial sectors for more than 20 years and is a member of the ITC UAV Centre.

Francesco Nex is a professor in the department of Earth Observation Science (EOS) at the University of Twente. His research interests focus on the development of innovative solutions, fusing elements from photogrammetry, deep learning and adjacent domains such as robotics to promote the application of UAV imagery in a variety of real-world remote sensing and geomatics applications. He is the lead of the ITC UAV Centre.
more important than the real quality of their results. While this may be sufficient for recreational purposes, it can lead to big failures in many professional applications. As with all information available on the web, we should be critical and raise questions regarding such paid or free courses and tutorials, such as:
• Is there a standardized verification process in place to confirm that instructors offering photogrammetry courses on platforms such as Udemy have enough practical experience and a deep understanding of the subject?
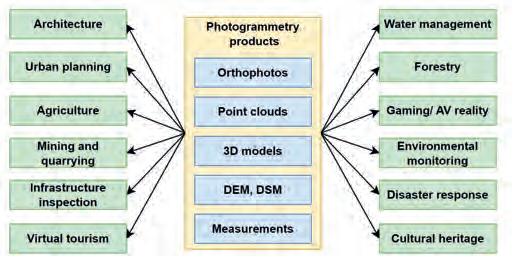

• How do we validate the quality and credibility of the material offered in YouTube photogrammetry lessons in an era where anyone can produce and publish tutorials on social media?
• Do these courses instruct on how to handle difficult operational conditions?
• And (although optional), are these courses affiliated with academicor industry-recognized certification that might assure students of the validity of the training they are receiving?
In summary, the spread of online platforms and social media tutorials raises concerns about the depth of expertise in photogrammetry. This challenge requires validating platform instructors’ qualifications, ensuring accurate content and bridging theory-practice gaps. Finding a balance is vital if we are to develop well-rounded professionals who grasp the photogrammetry topic foundations and market trends.
AI’s transformative influence
Artificial intelligence (AI) is an emerging technology across various industries, including geospatial sciences and photogrammetry. The automation procedures offered by AI simplify complex tasks and allow non-experts to easily manipulate geospatial data and extract
Issue 7 2023 67 Feature
Figure 2: Cross-interdisciplinary users of push-button photogrammetry.
Figure 1: Photogrammetry products for a variety of industries.
information from aerial or satellite imagery, representing an immense opportunity for the remote sensing field. While the use of AI in photogrammetry (e.g. 3D reconstruction using multiple images) is still a research topic, with almost no applications in commercial solutions, it is becoming a game changer in many other remote sensing applications such as classification or object recognition. For example, AI is used in modern agricultural applications to extract information from aerial images to identify crop types, detect areas of stress or disease in a field, and estimate yield (Figure 3). These functionalities using advanced AI can be found in various push-button tools such as Solvi and Agremo. More software tools have also started to use AI to identify and classify objects in images, such as buildings, roads, vehicles or natural landmarks. This capability is useful in applications such as urban digital twins, planning, disaster response and land-use mapping.
sensing in the broadest sense. Traditional academic programmes place more emphasis on developing solid theoretical basics than on meeting the expectations of professionals looking for quick outcomes. Regarding photogrammetry, therefore, the engagement of non-experts could necessitate the development of specialized courses tailored to their immediate needs with the risk of excluding the significance of in-depth understanding, which is essential for conducting robust analyses.
If photogrammetry specialists comply with the requests of practitioners seeking quick results, we will foster a generation of photogrammetry practitioners who are reasonably able to execute tasks using push-button software tools. This will allow photogrammetrists to develop even more advanced solutions, maintaining their role as pushers of new innovative solutions and developers of applications in various domains. The integration of cutting-edge sensors (such as multispectral Lidar) with cameras and the assessment of new sensors and platforms for new uses, to give some examples, will therefore remain within the expertise of the photogrammetrist alone.
Educational programmes should therefore meet the evolving demands of the photogrammetry field by adapting but not compromising the basic principles and theoretical topics that strengthen the photogrammetry study. The challenge lies in designing curricula that provide both practical skills and a deep knowledge base, ensuring that professionals (also from other domains) are not just buttonologists but skilled professionals capable of adopting the complexities of modern photogrammetry challenges.
AI in remote sensing is therefore a powerful technology for producing rapid results. However, this convenience might ignore the importance of understanding basic theories in photogrammetry and remote sensing. Accordingly, the main challenge is to find the right balance between harnessing the advantages of AI-driven efficiency and preserving thorough expertise in the remote-sensing field.

Shifting the educational orientation
The rise of the cross-disciplinary adoption of automation, AI tools, online media platforms and so on compels a reimagining of educational paradigms in photogrammetry, geodesy and remote

The following educational activities (Figure 4) hold the key to training students either to become proficient photogrammetry specialists or to simply use photogrammetry products to enhance their domainspecific applications:
• Teaching adjustment computations and the theory of errors, which will enable students to efficiently interpret the photogrammetric product quality and make responsible judgements on it. Moreover, teaching the application of guidelines for placing ground control points for precise data alignment and georeferencing – a crucial issue since buttonologists will not be able to decide on the quality of the
Issue 7 2023 68
Figure 3: AI’s influence on photogrammetry applications in agriculture. Figure 4: Topics required to train photogrammetry specialists.
The main challenge lies in harnessing the advantages of AIdriven efficiency while preserving expertise in the remote-sensing field
photogrammetry product as this requires a high level of knowledge. Relying on the quality report produced by software such as Pix4D may be misinterpreted and numbers can be misleading for non-professionals.


• Teaching coordinate systems, map projections and spatial reference systems, including positioning using the global navigation satellite system (GNSS), which is crucial in the context of geospatial sciences.


• Exploring the topic of sensor fusion, such as Lidar, multispectral sensors, hyperspectral sensors and so on. Students need to understand how to integrate data from these different sensors to make more informed decisions and solve complex geospatial challenges. They also need to understand how to apply sensor calibration.
• Combining coding skills, which is increasingly essential to enable students to effectively solve and automate advanced complex problems that will ultimately improve their creativity.
• Incorporating AI topics (machine learning, deep learning) into the curriculum can be
optional for students who are interested in gaining these skills.
By including these topics in the curriculum, instructors can ensure that students not only learn how to use software tools proficiently but also acquire critical thinking abilities, a thorough knowledge of the geospatial field, and the capacity to deal with challenging situations.
It is worth mentioning here that both photogrammetry and computer vision specialists play a role in extracting geoinformation from image data. However, photogrammetry experts have a unique combination of geospatial knowledge, sensor understanding and error analysis skills that enable them to produce dependable geospatial products with a strong focus on spatial precision and accuracy.

Conclusion


The democratization of photogrammetry through commercial or open-source
low-cost push-button software marks a transformative era full of opportunities and challenges. Various factors such as the use of AI technology, the needs of crossdisciplinary professionals and the increase in social media and online courses are collectively reshaping photogrammetry education. As a photogrammetry expert, it is crucial to find a balance between software proficiency and theoretical understanding. Through adaptation, collaboration with other domains and dedication to improving expertise, the photogrammetry community will head towards a promising future full of opportunities and new developments. In conclusion, the question emerges: Do we still require photogrammetry experts? The resounding answer is yes, for two compelling reasons. First, to drive future advances in photogrammetry, ensuring the field remains at the forefront of innovation, and second, to elevate the comprehension of results and facilitate the effective utilization of photogrammetry in existing applications.

Issue 7 2023 69 Feature
Open Day Photogrammetry 2023, Germany
Aerial mapping: time for more flexibility and standardization
 By Wim van Wegen, GIM International
What are the challenges of image-based data acquisition for photogrammetric mapping and mesh modelling? And how can photogrammetry be made accessible? In September 2023, the annual Open Day Photogrammetry provided some answers to these questions, with inspiring insights into sensor technology and plenty of engaging technical discussions in the beautiful German city of Münster.
Many people from outside the Germanspeaking region may not have heard of the Open Day Photogrammetry 2023; in German, it could be described as a Geheimtipp (a hidden gem). Held on 12 and 13 September at Münster/Osnabrück Airport – including social activities in the heart of Münster itself –the two-day event was an outstanding opportunity to remain at the forefront of photogrammetry-related innovations.
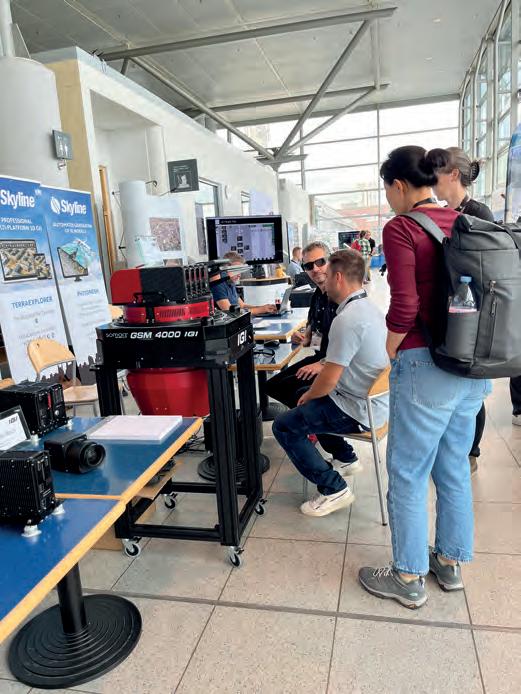
The theme for this year’s event was ‘Photogrammetry Made Accessible’. Attendees were given an exclusive glimpse into the world of aerial photogrammetry, gaining insights into the technology and engaging in discussions with manufacturers of both hardware and software. The event featured informative technical presentations and offered opportunities to participate in
workshops covering image processing, flight planning and surveying.
Broad mix of stakeholders
What sets this event apart is its ability to bring together manufacturers, service providers and end users, such as federal states and cities – and particularly their specialized geodesy departments responsible for fundamental state surveying. Thanks to this broad mix of stakeholders, the event is a true reflection of how the aerial mapping industry works in practice, from start to finish.
The event got off to an impressive start, with a display of aerial mapping aircraft and associated high-end sensor-based survey equipment on the first day. But another stand-out highlight was the lively fishbowl
discussion on the theme of ‘Geodata in administration: acquisition and application’. One key subject was the role of the government in relation to the aerial mapping industry. The issue of bureaucracy was frequently raised – not only in the context of the numerous local and regional regulations that aerial mapping companies must comply with in order to carry out projects, but also the patchwork of rules and requirements at European level. Meanwhile, various participants in the discussion expressed their frustration at the continued lack of a level playing field to support fair competition in the sector.
Demanding customers
Issue 7 2023 70
(sometimes unnecessary) demands. Michael Cramer, discussion moderator and a senior lecturer at the University of Stuttgart, questioned whether some customers are losing sight of the price/ quality ratio in the tender process, instead focusing on quality alone. But does every application really need to deliver maximum precision or the highest possible quality?
Participants also highlighted that illegible and inconsistent Statements of Works (SOWs) – the essential project planning and execution documents outlining the tasks, deliverables, timelines, pricing and standard regulatory and government terms and conditions – lead to not only a lot of annoyance, but also a lot of unnecessary costs. To avoid reinventing the wheel every time, a little more cooperation between the various German authorities would help, it was concluded.
Impact of climate change
Next up for discussion was the impact of climate change on the aerial mapping market from the perspective of both sensor developments and costs. For example, adverse summer weather resulting from global warming is increasingly delaying projects and forcing mapping companies to extend their flying season into the autumn months. But how is that affecting the geodata quality, e.g. due to less light towards the end of year? Konrad Wenzel, director of Esri’s R&D centre in Stuttgart (which was founded ten years ago as nFrames), indicated that sensors have developed in such a way over the last decade that the collection of first-class data quality should no longer be a problem, although the conditions under which data is gathered do present some challenges. Although part of the solution lies on the software side in terms of editing the images so that they meet the required standards, the quality of the sensors (especially in combination with the atmospheric conditions) remains a point of attention. However, advancements in sensor technology are increasing the possibilities for mapping outside the traditional flying season.
Flexibility and standardization
Aicke Damrau, managing director of GeoFly, agreed with Wenzel that technological developments are opening up new possibilities for geodata quality, but also felt compelled to state that political
decisions are still imposing limitations on the use of airspace. According to him, and his plea was supported by several other participants, it is time for more flexibility. This offers opportunities, because modern technology must ensure acceptable quality of aerial data, even under more challenging circumstances.
Engelbert Breg from Vexcel Imaging touched on several topics that were addressed throughout the two-day event when he called for a uniform Europe-wide description of every geospatial product (e.g. digital terrain model, digital elevation model, etc.). This would ensure that all products meet certain quality standards, and would also help in completing a European tender that does justice to the aerial mapping industry. The European Association of Aerial Surveying Industries (EAASI) was identified as the ideal organization that can include the most important discussion points as key takeaways in their activities.
Strengthening the sector’s profile
The Open Day Photogrammetry 2023 featured too many interesting presentations and workshops to cover in detail here, including crowdsourced processing of geospatial data, artificial intelligence in photogrammetry, and the launch of the IGI Ecomapper. But for me, one of the key takeaways is that the aerial mapping industry (and actually the mapping and surveying sector as a whole) often sees itself as being small, yet it is so important. As one of the speakers pointed out, 80% of all decisions are based on geodata. The message is clear: the sector stands to benefit from strengthening its profile. Needless to say, at GIM International we are willing and able to play a part in this!
After my first experience of the Open Day Photogrammetry in Münster, I can wholeheartedly say that I am eagerly anticipating next year’s event, which will be the fifth edition. I have even heard rumours that the 2024 edition is set to take place further south in Germany. More information is likely to follow in due time.
Open Day Photogrammetry 2023 was organized by the following companies: AVT Airborne Sensing, GeoFly, BSF Swissphoto, Geoplana and Aerowest. The event organizers kindly provided most of the images featured here.

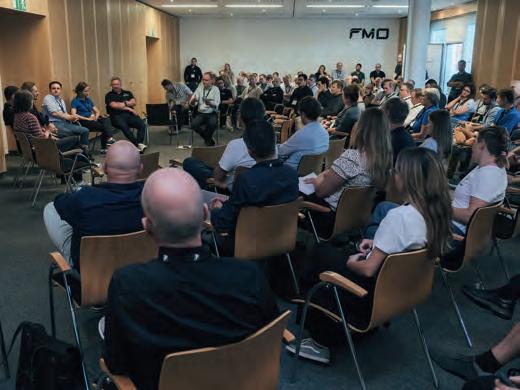
Issue 7 2023 71 Report
One of the standout highlights was the vibrant fishbowl discussion.
10 creative strategies to inspire young explorers to pursue surveying and geospatial careers
Attracting the next generation of surveying superheroes
By Elaine Ball, Get Kids into Survey
The surveying and mapping industries have evolved significantly over the years, adopting cutting-edge technologies such as GPS, Lidar and uncrewed aerial vehicles (UAVs or ‘drones’). Despite this, they are still often considered traditional fields – the ‘unsung heroes’ of urban planning, infrastructure development and environmental conservation – and so attracting the younger generation to careers in surveying and mapping remains an enormous challenge. To secure the future of these critical fields and foster innovation, it is incredibly important to ignite the interest of young minds. But how? Here are ten creative strategies for getting kids of all ages excited about surveying and mapping.
1. Demystifying surveying and mapping
The first step in sparking interest is to demystify surveying and mapping. Many younger people may not even be aware of the existence of these professions, and if they do know about them, they probably have some misconceptions. They might have already seen surveyors in the field, but had no idea who they were, what they were doing, or why they had funny-looking ‘cameras’ on tripods out on the road. Educational programmes, workshops and outreach efforts can help clarify what surveyors and mappers actually do – and how fascinating and important the work really is.
2. Showcasing real-world applications
Surveying and mapping play integral roles in various industries, from urban planning and construction to disaster management, wildlife conservation and even space exploration and sports. Highlighting the real-world applications and the impact of these fields can pique the interest of the younger generation. Skyscrapers, tornadoes, nature and outer space are the kinds of topics that younger students find fascinating! If they can gain an understanding of how a surveyor contributes to the planning of cities, managing recovery efforts after earthquakes or other catastrophes, or preserving land so that endangered species are safe, they can understand the impact they could have if they choose this career path. Other applications that may intrigue kids include:
• Surveyors play a crucial role in space exploration! In fact, NASA’s Mars rovers use surveying techniques to create detailed maps of the Martian terrain.
• The construction of Egypt’s Great Pyramids of Giza – more than 4,500 years ago – required remarkably accurate surveying techniques to align the massive structures with astronomical precision.
• The internet is physically mapped! Companies send out web crawlers to index web pages, creating a vast digital map of the internet so that users can find information quickly.
• Other examples include archaeology and sports – from placing lines on the fields to mapping the arc of a golfer’s swing to following runners or cyclists along a race route.
Presenting real-life case studies and success stories like these can be really effective in showcasing the diverse and fascinating applications of surveying and mapping.
3. Providing hands-on experiences
One of the most potent ways to engage young people is by providing hands-on experiences, such as by inviting them to participate in mapping projects or using surveying equipment. Schools and organizations can collaborate to offer internships or workshops that allow students to interact with professionals in the field. For younger learners, it is fun and engaging to meet community partners who have cutting-edge equipment like 3D laser scanners or capture indepth data using Lidar drones.
4. Leveraging technology
Today’s youngsters are tech-savvy, and this presents a unique opportunity to connect with them. Surveying and mapping have undergone a technological revolution with the integration of GPS,

Issue 7 2023 72
Elaine Ball (right) on Intergeo TV, after being interviewed by Denise Wenzel.
GIS and remote sensing. Creating interactive apps, games or virtual reality experiences that involve mapping and surveying concepts can captivate young minds. There are already popular geography-based mobile games like GeoGuessr on the market. Additionally, some of the leading software providers in the geospatial industry offer tools and interactive online resources designed for kids.
5. Highlighting environmental stewardship
Many kids are aware of climate issues and the impact they will have on their futures. In fact, a recent UN #YouthStats report revealed that 89% of the young respondents believe their generation can make a difference on climate change, and many have already taken some kind of action. Highlighting the role of surveying and mapping in conservation and sustainability can resonate with environmentally conscious children and teens. Projects related to tracking deforestation, monitoring wildlife habitats or managing water resources can be both inspiring and educational.
6. Emphasizing career pathways
Even though schools are increasingly offering science, technology, engineering and mathematics (STEM) programmes, students are not fully aware of the many career paths available to them, so it is crucial to emphasize the diverse opportunities within surveying and mapping. These fields offer not only traditional roles that involve standing in the field with a theodolite, but also positions in data analysis, software development and geospatial intelligence. Such data- and IT-focused careers may be very appealing to teens in particular (and they will provide a far more reliable income than jobs like ‘influencer’ and ‘YouTuber’!).
7.
Collaborating with educational institutions
Collaboration between surveying/mapping professionals and educational institutions is vital for both parties. While schools will benefit from the educational programming, it will help industries that require surveyors to attract the next generation. By providing content for guest lectures, field trips and curriculum integration, industry organizations can spark awareness and interest among students and contribute to a deeper understanding of the practical aspects of surveying and mapping. As an example, Diamondback Land Surveying in Las Vegas recently launched ‘Get Kids into Survey West Coast’, an ‘act local-global’ initiative that aims to inspire future geospatial experts between the ages of 8 to 12 by providing education and resources on everything geospatial.
8. Organizing competitions and challenges
Organizing competitions and challenges can be an exciting way to engage the younger generation. For instance, a mapping competition that involves creating maps to solve specific scenarios or problems can tap into their competitive spirit while promoting learning. Additionally, geocaching has become a popular activity in recent years and it can be used to teach kids the importance of mapping
Elaine Ball is the creator and visionary of Elaine Ball Ltd (EBL), a global sales and marketing consultancy for the geospatial industry. Elaine’s mission is to level up the geospatial sector globally by giving surveyors and equipment manufacturers a dedicated resource for business, sales, marketing and strategic communications, and to encourage and excite the next generation of surveyors. Together with her sister Elly, she founded ‘Get Kids into Survey’ in November 2017 with the aim of building a well-recognized global brand and reducing the shortfall of surveyors.
and location data. So why not set up a geocaching challenge for students, asking them to not only use GPS to find prizes, but also to draw maps of the routes they used?
9. Providing role models and mentoring
Young people often look up to role models who inspire them, and mentorship programmes can provide valuable insights and guidance for those considering careers in particular fields. Established surveyors and mappers can play a key role in inspiring and guiding the next generation by volunteering to become mentors.

10. Creating public awareness campaigns
Creating public awareness campaigns can increase the visibility of surveying and mapping. Social media, documentaries and outreach programmes can all showcase the importance of these professions and the incredible projects they contribute to. Any materials created for this campaign should be appealing for younger students, but also their parents and teachers so that they too are made aware of the need for surveyors, the potential career paths and the skills needed to embark on a surveying career. Additionally, educators should understand how neatly this knowledge and skillset can fit into existing STEM curricula, and that surveying is a viable and available career path for their students. Surveying and mapping examples from popular culture – such as Indiana Jones deciphering ancient maps or the high-tech mapping technology featured in sci-fi films like Avatar –are great images to include in any campaign you launch.
Key takeaway
If we want to drive interest in geospatial and surveying careers, we will need to combine education, inspiration, outreach and, of course, technology. By introducing these fields, demonstrating their real-world impact with exciting examples, and allowing kids some hands-on time with industry technology, we can ignite their curiosity and passion. Ultimately, engaging young minds in surveying and mapping is not only essential for the continued growth of many key industries, but also for addressing the many challenges the future of our planet holds.
Issue 7 2023 73 Perspectives
About the author
Exploring the world of SGIS Desktop
A tale of geospatial innovation

In the current landscape of readily available GIS solutions, a small team of entrepreneurs asked themselves whether originality still holds any allure when templates and pre-made solutions abound. They decided that it does, and embarked on a journey of creation from the ground up. The result: the emergence earlier this year of an intuitive, user-friendly and feature-rich geospatial data editing tool known as SGIS Desktop.
In today’s vast, interconnected world, geographic information systems (GIS) have become indispensable heroes, shaping our comprehension of the environment and fostering collaboration within the geospatial community. This unassuming technology possesses the transformative power to bridge gaps, resolve intricate challenges and contribute to a sustainable and well-informed global future. At its core, GIS captures, analyses and interprets spatial data, transforming it into actionable insights. Within this community, collaboration and knowledge-sharing thrive, with GIS serving as a universal language.
However, the dedicated team behind SGIS Desktop found themselves grappling with the complexities associated with editing and analysing cadastral and infrastructure data using existing, open-source tools such as QGIS. These endeavours demanded tiring hours and often entailed the loss of data and discrepancies in information. The team recognized the pressing need to streamline these laborious
processes, driven by an aspiration to optimize efficiency, save valuable time and ensure the precision of outcomes.
The start of the SGIS Desktop journey
The SGIS Desktop journey got underway with the team setting out to develop a distinct, tailored solution for the geospatial ecosystem, embodying values of simplicity, swiftness and efficiency. Consequently, they embarked on a path to construct every function, without reliance on external libraries or conformity to market software functionalities and interfaces.
Remarkably, the journey commenced without the trappings of a formal business plan. Nevertheless, as SGIS Desktop was disseminated across numerous government bodies and international institutions, it became apparent that a multitude of individuals and entities faced the same challenges that once beset the creators. This epiphany ignited a steadfast conviction that SGIS Desktop was poised
74
An engineer collaborating with a fellow surveyor in the field, following the instructions with SGIS.
Issue 7 2023
A vineyard survey.
to make a meaningful impact and extend its support to those in need.
Numerous strengths
One notable distinction of SGIS Desktop lies in the internal loading of GIS data within the software. All modifications made to data within layers occur exclusively within this internal structure, rather than directly on the data stored on disk. As a result, any changes affecting data on disk necessitate explicit user confirmation, ensuring data integrity and guarding against unintended alterations.
SGIS Desktop offers numerous other strengths that set it apart in the geospatial software landscape. For example, it is available in both 32-bit and 64-bit processing for Windows and Linux, ensuring compatibility with a range of systems. Its processing speed is impressive, providing swift results for users. Moreover, it boasts minimal disk space requirements, which is advantageous for storage efficiency. Additionally, SGIS Desktop is costeffective, offering accessible licensing and maintenance options. It places a strong emphasis on vector-based tools, merging the capabilities of CAD and GIS functionalities. Users benefit from robust data editing capabilities and advanced attribute data editing tools, thus enhancing data management. Furthermore, SGIS Desktop provides specialized utilities and network tools, making it versatile for various applications. It tailors tools for cadastre and surveying, meeting the specific needs of these domains.
Beyond a mere preview tool
SGIS Desktop is designed to go beyond the role of a mere geospatial data preview tool.


Instead, users gain the capability to actively edit and modify data, akin to the precision and flexibility offered by CAD environments. Noteworthy functionalities include the facilitation of zip archive loading containing GML/SHP files, direct creation of point, line and polygon layers from imported text data, and convenient loading of folders containing numerous GIS files or subfolders. It also demonstrates compatibility for reading and writing Google Earth files.
When extracting CAD layers, SGIS Desktop preserves their original format from a DXF file and seamlessly integrates them as analogous GIS layers. An innovative ‘Smart Snapping’ tool adeptly aligns points, lines or polygons with the nearest existing features or designated reference layers, preserving topological integrity.
Valuable insights
The ‘Automatic Land Parcel Subdivision’ feature is a standout innovation of SGIS Desktop. It not only subdivides parcels, but also automatically assigns numeric identifiers to the new subdivisions. This feature streamlines the expropriation procedure, reducing it to a matter of seconds. Meanwhile, to support users in obtaining valuable insights from their understanding of the ‘where’, SGIS Desktop integrates easy GIS data organization and management through multiple built-in functionalities, enhancing attribute data management.
Despite its technological prowess, SGIS is not just about numbers and pixels; it is also about people. It bridges the gap between data and decision-making, automating processes, fostering collaboration, and empowering individuals,
organizations and governments to make informed choices.
User-friendliness and simplicity
As Einstein is quoted as saying, “If you can’t explain it simply, you don’t understand it well enough”. The SGIS team embrace this ethos, believing that simplicity is the path to innovation. Therefore, a sleek and simple interface eases navigation for users. In the spirit of enhancing the power of GIS to unravel spatial complexities, SGIS Desktop does not entail a steep learning curve. Its intuitive design, seamless navigation and smooth onboarding process make it accessible to all – even newcomers to the spatial realm.
Furthermore, the software is designed with ease of learning in mind and provides comprehensive help resources, ensuring users have the support they need. An array of tools, documentation and online support solidify its positioning as a user-friendly GIS software solution for individuals of all skill levels. In this era of rapid geospatial advancement, SGIS Desktop combines genuine innovation with human-centric design.
Start-Up
75
A DXF file loaded in the SGIS Desktop software interface.
SGIS Desktop is supported by comprehensive online resources.
SGIS software facilitates cadastral survey procedures.
Issue 7 2023
Akwaaba
Why Accra has been chosen to host the FIG Working Week 2024
Thanks to various significant areas of growth, the African continent offers interesting markets and exciting possibilities. With over 32 million inhabitants, Ghana is one of the most populous countries in West Africa, second only to Nigeria. As a young, thriving, stable democracy in a hotbed region, Ghana’s involvement in promoting peace and stability in Africa is legendary. Its rapidly growing economy provides countless opportunities for investment and enterprise.
These are just a few of the many reasons why FIG is pleased that the upcoming main FIG event, the FIG Working Week 2024, will take place in Accra, the capital of Ghana. The Ghanaian word for ‘Welcome’ is Akwaaba and you will undoubtedly hear the expression used several times a day once you land in Ghana. The welcoming smile is very much a Ghanaian trademark that you need to have seen with your own eyes. The experience of being in this vibrant nation will leave you with a lifelong memory and a yearning to return to this friendly country.
So from 19-24 May 2024, FIG and our Ghanaian hosts will say ‘Akwaaba to Ghana’
and ‘Akwaaba to Accra’ for the FIG Working Week. Mark the dates on your calendar right now!
From a professional point of view, you will have plenty of opportunities for learning thanks to the technical programme, the exhibition and the networking activities with your peers from over 80 different countries. The conference venue is La Palm Royal Beach Hotel and Conference, where you will experience a real taste of Ghana and the genuine hospitality of the local organizers. It is located in a resort area of Accra, directly on the coast. Whether you are an exhibitor, a sponsor or a participant, you will enjoy special networking opportunities in comfortable surroundings.
Meanwhile, this is your chance to gain unique insights while exploring this beautiful West African country as a tourist. There really is something for everyone in Ghana – from the wildlife (everything from elephants to butterflies) and breathtaking scenery (from tropical forests to majestic waterfalls and perfect beaches), to history and culture, including the rich regalia of the institution of chieftaincy, which links the past to the
FIG Working Week 2024
present in all kinds of fascinating ways. Additionally, the Atlantic coast of Ghana is dotted with centuries-old forts and monuments that bear testimony to Africa’s trading links with Europe and its part in the transatlantic slave trade.

Submit your abstract


The main theme of the FIG Working Week 2024 is ‘Your World, Our World: Resilient Environment and Sustainable Resource Management for All’. The event will build on the FIG vision to ‘Serve society, benefiting people and the planet’ and will focus on tackling the global challenges as these specifically relate to the wellbeing of our planet and natural resources with a special focus on:
• Land and mineral resources


• Water, oceans
• Land management and governance including urbanization/rural/geospatial


• Technology and ethics.
Do you have exciting research, best practice experience, or an interesting story that you would like to share with colleagues from all over the world? We encourage highquality contributions from researchers and practitioners that provide insights for debate and action on topics that contribute to the advancement of a greener and more resilient world. The deadline for abstract submission is 1 November 2023.
76 Issue 7 2023
More information www.fig.net/fig2024
FIG WORKING WEEK 2024 ACCRA, GHANA 19-24 May Your World, Our World: Resilient Environment and Sustainable Resource Management for All
Accra, Ghana
The horizontal velocity field of ITRF2020 sites, reflecting the motion of tectonic plates (boundaries shown in orange).

The nonlinear trajectory of the GNSS station at Tsukuba site (Japan), following the three components (North, East and Up): the raw station position time series (blue), the piecewise linear trajectory (green) and the trajectory obtained when adding the parametric PSD model (red). This highlights not only the seasonal signals due mainly to loading effects (visible mostly in the Up component), but also the post-seismic trajectory after the devastating Tohoku earthquake occurred in 2011.
ITRF2020: A new release of the International Terrestrial Reference Frame for Earth science and positioning applications
What is the current rate of sea level rise in different regions of the globe? How does our Earth deform under the effect of plate tectonics, seismic phenomena or the melting of ice caps? How is the Earth’s centre of mass varying? How can the position of a point on the surface of a constantly deforming Earth be determined and compared to positions estimated decades apart?
The answers to these fundamental questions for understanding the dynamics of our planet require the availability of a global, long-term stable terrestrial reference frame. This should preferably be a standard reference to ensure interoperability of various measurements collected by sensors on the ground or via artificial satellites.
What is the ITRF?
The International Terrestrial Reference Frame (ITRF) is the standard reference
recommended by a number of international scientific organizations, including the International Union of Geodesy and Geophysics (IUGG) and the International Association of Geodesy (IAG) for Earth science, satellite navigation and positioning applications. The ITRF is an international effort that is built on the investments of space and mapping agencies, universities and research groups in operating geodetic observatories, archiving and analysing the collected geodetic observations to derive not only the ITRF, but also critical geodetic products for science and society. The ITRF integrates and unifies technique-specific reference frames provided by IAG’s four international services of space geodetic techniques (DORIS/IDS, GNSS/IGS, SLR/ILRS and VLBI/IVS). It is provided in the form of temporal coordinates of more than 1,500 stations, together with parametric functions describing nonlinear station motions.

Regularly updated
It is necessary to regularly update the ITRF in order to benefit from continuous observations and further improve its accuracy, considering station position temporal variations due to geophysical phenomena. The most recent update, the ITRF2020, was published on 15 April 2022.
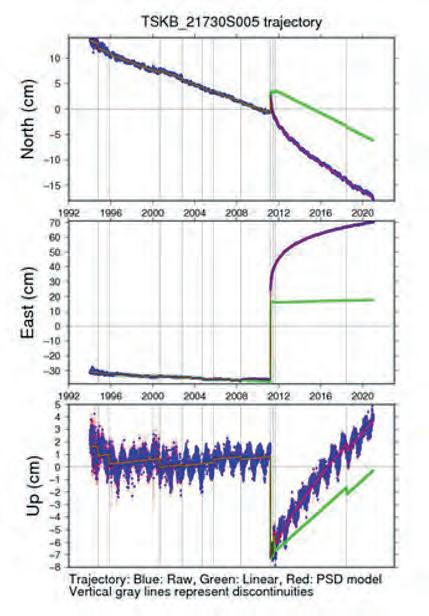
More information
https://itrf.ign.fr/en/solutions/ITRF2020
Altamimi, Z., Rebischung, P., Collilieux, X., Métivier, L., Chanard, K. (2023) ITRF2020: an augmented reference frame refining the modeling of nonlinear station motions.
J. Geod. 97(47). https://doi.org/10.1007/ s00190-023-01738-w
77 Issue 7 2023
ISPRS supports the young generation
The young generation has its own organization within the International Society for Photogrammetry and Remote Sensing (ISPRS), called the ISPRS Student Consortium (SC). An extract from its website reads:
“The main purpose of the ISPRS SC is to link students, young researchers and professionals in different countries, who are interested in photogrammetry, remote sensing and spatial information sciences. ISPRS SC also aims to provide a platform for exchange of information and to organize student-specific events and other activities that integrate students and the youth more effectively into ISPRS activities.”

The SC was founded 19 years ago at the XX ISPRS Congress in Istanbul in 2004, and there are many scientists and experts now working in photogrammetry, remote sensing and geospatial areas who are former members. Although it is financially supported by ISPRS, the SC is an independent organization with a president and board of directors. They represent the new generation of experts who continue in the footsteps of the ISPRS founders, but are also advocates of modern tools and technologies.
The SC has been organizing and assisting in the organization of summer schools in various countries of the world since the very beginning. Therefore, it is possible to find educational materials on many of the Summer School websites (especially for online events) and on the official Student Consortium YouTube channel.
The aim is to publish four issues of the online SC newsletter, called Spectrum, each year. The first issue was published in 2007. During the pandemic, the SC members put additional efforts into its already established series of webinars. Moreover, the consortium initiated new virtual events such as ISPRS SC virtual rooms and ‘Geomixers’, in collaboration with several other organizations. An overview of all SC events is summarized in the General Activities section of the website.
Both facilitating networking between students and bringing them closer to ISPRS experts have been major priorities of the consortium. Now, to provide more networking opportunities and a platform for discussion, the SC is launching its own Discord channel. By following the recent
trends in technological transformations/ advancements in data science, artificial intelligence and digital twins, ISPRS SC is looking forward to engaging the young generation in skilling up in those fields so that they are well prepared for the upcoming academic and industrial market demands. For this, the SC president and board of directors decided to take a new step in the consortium’s journey. Students and young researchers are now invited to create Student Consortium Chapters in individual countries, regions, universities and institutes, to encourage more members to engage with the common goals of the ISPRS SC. These members of the consortium are the new generation; they are our future.
The ISPRS SC is committed to pushing the boundaries of cutting-edge technologies while keeping in touch with the older generations currently running ISPRS. The Student Consortium welcomes new members who are keen, willing and able to ultimately ‘take up the baton’.

More information
https://sc.isprs.org
https://www.youtube.com/@ISPRSSC
78 Issue 7 2023
Student Consortium members at the ISPRS Geospatial Week 2023 Conference in Cairo, Egypt, in September 2023.
Focusing on True Performance
• Extended Reflectorless range: About 1000m




• Quicker measurement time: Less than 1 second


• Longer operation time: About 50 hours with dual/hot-swap batteries

Positioning System G2U


• Powerful GNSS engine compatible with all GNSS systems: GPS, GLONASS, Galileo, Beidou and QZSS.


• Integrated battery for easy power charge via USB cable.


• Compact, light-weighted and robust housing.
• Intergated tilt compensation function. •


Station V-100N Series V-101N I V-102N I V-102NL (V-101N,
V-102NL TI Asahi Co., Ltd. International Sales Department 4-3-4 Ueno Iwatsuki-Ku, Saitama-Shi Saitama, 339-0073 Japan www.pentaxsurveying.com/en/ Tel.: +81-48-793-0118 E-mail: International@tiasahi.com
Total
V-102N)
The
and
to
New New
design
specifications of the products are subject
change without notice.






CERTUS EVO - RTK GNSS/INS FOG-like performance with low SWaP-C 0.05° Heading 0.03° Roll & Pitch 0.2° /hr MEMS gyroscope 1000 Hz Update Rate 10 mm RTK Positioning OEM Option Available Advanced Navigation develops AI-based navigation and robotics solutions. To learn more, scan the QR code or visit www.advancednavigation.com ACCURATE POSITIONING FOR DEMANDING APPLICATIONS


 By Jakob Voigt, Ferdinand Vettermann and Johann Heller, deeeper.technology, Germany


 By Wim van Wegen, GIM International


 By Wim van Wegen, GIM International


