
8 minute read
Geospatial Empowering Non-profits to Tackle Food Insecurity in US


Several non-profit organizations in the US use Geospatial tools and analytics to introduce predictability with layered imagery and mapping to make better informed decisions for the areas they operate in. By Rituparna Sengupta
Maps have provided GEOINT solutions for several social challenges through the ages. One such powerful example highlights GIS maps empowering non-profit food distribution programs in the US.Today mapping tools are being used to plan and execute food distribution programs to effectively reach large numbers of deserving households.
Location Analysis Bolsters Non-Profit Food Distribution Programs “Mapping and location analysis helps nonprofit food banks to assess their progress as well as identify areas where there is
still unmet need. As the challenges change and shift, Geographic Information System (GIS) can help these organizations to prepare for what’s to come” shared Emily Swenson, non-profit program lead for Esri in a conversation with Geospatial World.
Maps may be used to track the efficiency of their food distribution routes, identify areas in need of the required help and also provide an effective evaluation tool to measure the impact of such programs. This holiday season here in the US, Esri GIS maps are lending their hand in offering effective solutions to food insecurity challenges to ensure the festivities and food distribution networks for underprivileged communities may proceed in the most effective manner.
Festivities Around the Corner Thanksgiving celebrations just concluded and the Christmas – New Year months are coming up soon. Good cheer and festive spirit have filled up the air. At this point, it is pertinent to look behind the scenes to look at the steady effort being streamlined by so many dedicated social organizations. They are working round the clock to ensure that the not-so-privileged sections of communities can celebrate and have access to equitable food supplies through efficient food distribution networks. Map usage to streamline the delivery routes, identifying the neighborhood needs, and related factors have been a great asset for such campaigns which reach out to large numbers of households to make a difference in the receiving families’ lives. For example, Ed Westreicher, Director, Marketing and Communications

Esri Map used by Atlanta Community Food Bank
with the Atlanta Community Food Bank shared with Geospatial World that their organization “and their partner network reported approximately 200,000 households served in October 2022”. Michael Truitt, Director of Community Partnerships and Programs at Freestore Foodbank in Cincinnati shared “our large 2022 Thanksgiving distribution served 2000 households” this year. Feeding America Riverside in San Bernardino has served 903,072 households in the one and half year period from January 2021 to June 2022.
Challenges Faced This Season The present holiday season had the farmers and producers of the nation toiling hard to ensure families can continue to put food on the table and engage in memorable celebrations with their loved ones. This season, in particular, poultry producers have faced a number of challenges, including an outbreak of highly pathogenic avian influenza (HPAI), which resulted in the loss of over 50 million birds, including over 8 million turkeys.
USDA reported that all stakeholders have been working closely to implement a comprehensive response to this outbreak and ensure there is an adequate supply of turkeys for the holiday season. This factor exacerbated by rising inflation costs and economic challenges caused by rising unemployment has led to several underprivileged sections of many US cities facing threats of food insecurity.
Geospatial Technology Helps Social Organizations in Serving Communities Better Several social organizations across the nation have risen to the growing need for food distribution. This is not only during the
holiday season demand but also the overall demand raised through the uncertainties brought in by the pandemic in the last couple of years. Geospatial technologies have been a great asset for many of these organizations lending great value to their dedicated efforts.
Michael Truitt shared how “mapping software has allowed the Freestore Foodbank to better serve the community by providing insights into areas of opportunities.”
“Freestore has utilized this information to do transformative work at the macro level by identifying neighborhoods that lack sufficient food access points and at the micro level by being able to supportfamilies directly through an array of strategic programs” added Truitt.
The Esri GIS maps helped the team carry out targeted efforts of food distribution in very specific neighborhoods. They could better engage target neighborhoods and provide the communities with better service and thereby earning the trust of those being served. This is indeed a wonderful social benefit of a meaningful technology alliance.
Jacqueline Arias, Programs Director of the organization Feeding America Riverside in San Bernardino, California shared similar insights. “GIS mapping has allowed us to be more efficient in running our programs. We want to be able to provide the most help to most of the people in the Inland Empire” shared Arias. Their organization have several food distribution programmes like the HERO (Homebound Emergency Outreach program) program which initiated food boxes for those in need and are homebound and unable to step out to arrange their daily food needs. The California-based food bank is experiencing the effectiveness of using Esri maps to streamline its activities to address its mission of alleviating hunger in the inland empire region in California.
Similar affirmative conversations echoed between Geospatial World and the Atlanta Food Bank. “Geospatial technology is helping us get deeper insights into the food insecurity landscape, allowing us to layer available resources over need to identify areas where more help is needed ” shared Sharay Erskine, Chief Information Officer, Atlanta Community Food Bank.
The discussion yielded insights on how ground-level execution of food distribution activities is benefitting from mapping technology interventions.
Erskine pointed out that “also, with the ability to add in various demographic data available from the census we can better serve

California-based Feeding America Riverside’s food delivery Map.
our communities, targeting outreach via culturally appropriate mediums and/or languages and plan for more culturally appropriate foods and more. Hunger is a persistent national crisis and so data will help us be more efficient and effective in helping those in need.” chain shared some maps he has developed. These Esri maps have helped food distribution activities in Cincinnati. He highlighted how his work is aiding the non-profit work groups since COVID “to support this work stream by providing data science and geospatial support.”
The first map (Figure 1) was a sample map to show where the team started their data analysis. In this case, they mapped the poverty rate by census tract to see where potentially vulnerable populations are located.
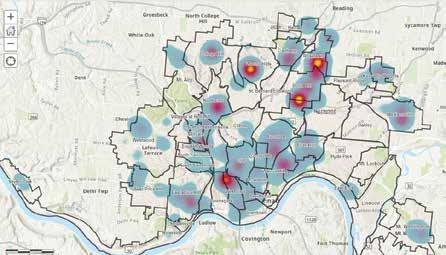
The next map (Figure 2) was an example of how the team then added layers to the supply of a certain resource by area. In this case, the map is showing a sample of charitable meals provided in the city as a heat map. If this heat map is now layered on top of the poverty map, then it would start to show where there is a need that is not being met by a certain resource.
The third (Figure 3) This showed the whole work stream where they over layered emergency food support against childhood poverty to identify areas of concentrated poverty that were outside of 1 mile from a food site. This then allowed the food distribution groups to try to direct resources to those underserved areas.
Hoffman added in their “current goal is to build an automated process that can be used in Cincinnati and easily transferred to other cities to convert publicly available data into actionable insights for decision-makers and citizens.”
Mapping Relevant Data to Streamline Food Distribution Activities Charles Hoffman, Data Scientist from Cincinnati, from the organization 84.5, a subsidiary of Kroger the US national food

(Figure 1) This is a sample map that shows poverty rate by census tract to see where potentially vulnerable populations are located.
(Figure 2) This map shows a sample of charitable meals provided in the city.
GIS is an Effective Mapping Tool Esri maps and GIS-enabled analytics have been of great aid to

(Figure 3) This map shows layered emergency food support map over childhood poverty map to identify areas of concentrated poverty. several food distribution efforts in the US. They have proved to be an effective tool for many US food banks, helping them to understand their service area, better manage their volunteers and efficiently deliver food.
Emily Swenson, pointed out “when resources are limited and demand for those resources increases, nonprofit organizations are required to innovate to continue meeting the needs of the people they are positioned to serve. In the face of the pandemic, inflation, and the myriad web of challenges in our world today, GIS continues to be a means for innovation.”
Maps have provided a visual layer to the non-profit operations which have brought greater clarity at different operation levels of food distribution programs. An important point added in by Swenson was that “maps are an important advocacy tool that help people to understand what’s happening where and why it matters. They help to build support.” This is a very important aspect where “communicating through maps is not only done to build support, but also to quickly and easily share information with those who need it” said Swenson.
“Using geo-enrichment and other network analysis, organizations can understand things like the number of families that may not have access to a car in a given area, or the languages that people speak who may miss out on communications coming from the food bank” continued Swenson.
Addressing food insecurity challenges with the aid of geospatial technology is an excellent example of a value-creating collaboration between technology and social change stakeholders. Indeed a holistic overview of the ground zero non-profit actions and also the ability to measure the impact of such initiatives over a period of time gains greater momentum with the usage of mapping and location analysis.
Rituparna Sengupta
Associate Editor Americas Rituparna@geospatialworld.net


