This work is a product of the staff of The World Bank with external contributions. The findings, interpretations, and conclusions expressed in this work do not necessarily reflect the views of The World Bank, its Board of Executive Directors, or the governments they represent. The World Bank does not guarantee the accuracy of the data included in this work. The boundaries, colors, denominations, and other information shown on any map in this work do not imply any judgment on the part of The World Bank concerning the legal status of any territory or the endorsement or acceptance of such boundaries.
Nothing herein shall constitute or be considered to be a limitation upon or waiver of the privileges and immunities of The World Bank, all of which are specifically reserved.
Rights and Permissions
This work is available under the Creative Commons Attribution 3.0 IGO license (CC BY 3.0 IGO) http://creativecommons.org/licenses/by/3.0/igo. Under the Creative Commons Attribution license, you are free to copy, distribute, transmit, and adapt this work, including for commercial purposes, under the following conditions:
Attribution Please cite the work as follows: World Bank Group 2025 Thailand Economic Monitor: Unleashing Sources of Growth: Innovation, SMEs and Startups World Bank, Bangkok. License: Creative Commons Attribution CC BY 3.0 IGO
Translations If you create a translation of this work, please add the following disclaimer along with the attribution: This translation was not created by The World Bank and should not be considered an official World Bank translation. The World Bank shall not be liable for any content or error in this translation.
Adaptations If you create an adaptation of this work, please add the following disclaimer along with the attribution: This is an adaptation of an original work by The World Bank. Views and opinions expressed in the adaptation are the sole responsibility of the author or authors of the adaptation and are not endorsed by The World Bank.
Third-party content The World Bank does not necessarily own each component of the content contained within the work. The World Bank therefore does not warrant that the use of any third-party-owned individual component or part contained in the work will not infringe on the rights of those third parties. The risk of claims resulting from such infringement rests solely with you. If you wish to re-use a component of the work, it is your responsibility to determine whether permission is needed for that re-use and to obtain permission from the copyright owner. Examples of components can include, but are not limited to, tables, figures, or images. All queries on rights and licenses should be addressed to the Publishing and Knowledge Division, The World Bank, 1818 H Street NW, Washington, DC 20433, USA; fax: 202-522-2625; e-mail: pubrights@worldbank.org.
Preface
The Thailand Economic Monitor (TEM) reports on key developments in Thailand’s economy over the past six months, situates these changes in the context of global trends and Thailand’s longer-term economic trajectory, and updates Thailand’s economic and social welfare outlook. Each edition of the TEM also provides an in-depth examination of selected economic and policy issues and an analysis of Thailand’s medium-term development challenges. The TEM is intended for a wide audience, including policymakers, business leaders, financial-market participants, and the community of analysts and professionals engaged in Thailand’s evolving economy.
The TEM is produced by the staff of the World Bank’s Bangkok office, consisting of Kiatipong Ariyapruchya, Cristian Quijada Torres (Task Team Leaders), Warunthorn Puthong, Jun Ge, Sakulrat Bovornsantisuth, Anchidtha Roonguthai, Ornsaran Manuamorn, Robert Palacio, Ou Nie, Sutirtha Sinha Roy, Kajetan Wladyslaw Trzcinski, and Samuel Hill Melinda Good, Fabrizio Zarcone, Sebastian Eckardt, Francesco Strobbe, Kim Edwards, Xavier Cirera and Jaime Frias provided overall guidance. The team is grateful to Ergys Islamaj, Luis Andres Razon Abad, Kim Alan Edwards, and Arvind Nair, for their constructive peer review comments. Kanitha Kongrukgreatiyos, Surintorn Methitanpongwanit, and Piathida Poonprasit are responsible for external communications related to the TEM, as well as the production and design of this edition.
The findings, interpretations, and conclusions expressed in this report do not necessarily reflect the views of the Executive Directors of the World Bank or the governments they represent. The latest data that inform this report date from December 15, 2024, and include data from authorities as well as World Bank staff calculations. The boundaries, colors, denominations, and other information shown on any map in this work do not imply any judgment on the part of the World Bank concerning the legal status of any territory or the endorsement or acceptance of such boundaries.
Photographs are copyright of World Bank. All rights reserved.
This and other reports are available for download via: worldbank.org/tem
Previous editions of the TEM:
▪ July 2024: Unlocking the growth potential of secondary cities
▪ December 2023:Thailand’s path to carbon neutrality: the role of carbon pricing
▪ June 2023: Coping with floods and droughts
▪ December 2022: Fiscal policy for a resilient and equitable future
▪ June 2022: Building back greener: the circular economy
▪ December 2021: Living with COVID in a digital world
▪ July 2021: The road to recovery
▪ January 2021: Restoring incomes; recovering jobs
▪ July 2020: Thailand in the time of COVID-19
▪ January 2020: Productivity for prosperity
▪ July 2019: Harnessing fintech for financial inclusion
To receive the TEM and related publications, please email Surintorn Methitanpongwanit (smethitanpongwan@worldbank.org). For questions, please contact Kiatipong Ariyapruchya (kariyapruchya@worldbank.org)
For information about the World Bank and its activities in Thailand, please visit: wbg.org/thailand
IBRD International Bank for Reconstruction and Development
IFC International Finance Corporation
km Kilometer
KPI Key performance indicator
kW Kilowatt
L Liter
LAOs Local Administrative Organizations
LCR Liquidity Coverage Ratio
M&E Monitoring and Evaluation
MOF Ministry of Finance
MRR Marginal Retail Rate
NEER Nominal Effective Exchange Rate
NESDC National Economic and Social Development Council
NPL Non-Performing Loan
NSO National Statistical Office
OECD Organization for Economic Co-operation and Development
PPP Public-Private Partnership
R&D Research and Development
REER Real Effective Exchange Rate
SMEs Small And Medium Enterprises
SOEs State-Owned Enterprises
TFP Total Factor Productivity
THB Thai Baht
USD United States Dollar
TABLES
EXECUTIVE SUMMARY
Recent Developments: Subdued Recovery
The economy is estimated to have grown by 2.6 percent in 2024, surpassing expectations due to an unexpected surge in activity but the recovery continued to lag behind peers. The rollout of fiscal stimulus (THB 10,000 cash transfer) in Q4 2024, strengthened electronics exports and tourism arrivals offset slowing private consumption the main driver of growth (Figure ES 1). While household debt declined, government measures to tackle high household debt led to a contraction in loan approval for automobile purchases. As a result, manufacturing weakened. Despite the recent uptick in GDP growth, Thailand’s recovery continued to lag behind peers such as Malaysia and Philippines (Figure ES 2) with GDP remaining below potential.
The latest GDP release showed that growth picked up at 3.0 percent year-on-year in 2024 Q3.1 Public investment (25.9 percent, 2024 Q3) returned to the fore as a growth driver following several quarters of delayed budget execution amid the political transition. Goods exports (8.3 percent) benefited from the electronics upcycle. In contrast, private consumption slowed (0.7 percent), manufacturing remained flat (0.1 percent) and private investment contracted (-2.5 percent) due to tightened credit and high household debt. Thailand’s tourism arrivals also showed signs of slowing momentum: arrivals reached only 86 percent of prepandemic levels end-2024. Growth in the last quarter is estimated at 3.6 percent boosted by fiscal stimulus of consumption
In Q3 2024, the current account surplus rose to 1.5 percent of GDP as the trade balance benefited from robust global demand (Figure ES 4) The goods trade balance remained positive, with both export and import growth accelerating on the back of the current global technology upcycle supported by the demand for AI-enabled devices. Exports expanded by 8.9 percent in Q3 2024. Meanwhile, import growth surged to 11.3 percent in Q3 2024 from last year’s low base, driven primarily by imports of capital goods, raw materials, and intermediate products from China. This pattern of trade flows highlights Thailand’s growing role in global value chain (GVC) participation. In Q2 2024, the financial account deficit narrowed to 2.2 percent of GDP, compared to a deficit of 3.9 percent in the previous quarter, driven primarily by a reduction in net portfolio outflows from 7.5 percent from June to December 2024, making it the secondstrongest currency among peer countries in the region.
Inflation edged up due to the removal of diesel subsidies but remained among the lowest in ASEAN due to remaining energy subsidies and weak domestic demand. In November, headline inflation edged up from 0.8 percent to 1.0 percent, marking the fourth consecutive month of increase, but remained the lowest among ASEAN peers and below the central bank’s target range (1-3 percent) due to below-potential growth The rise was driven by core inflation, on the back of prepared food prices, as well as energy prices (Figure ES 3). Energy prices rose following the removal of the diesel price subsidy in April despite the decline in Dubai crude oil prices. However, the government continued electricity and cooking gas subsidies. Given anchored inflation expectations, the Bank of Thailand (BOT) lowered the policy rate to 2.25 percent October to alleviate household debt-servicing pressure amid recent tightening credit standards.
Thailand’s financial system remained stable, but credit conditions have tightened amid government efforts to tackle high household debt. The level of household debt declined to 90.7 percent of GDP in Q2 2024 from its peak of 95.8 percent two years ago. However, it remains a major vulnerability for the financial sector due its level and large share of uncollateralized consumer loan in bank lending portfolios. System-wide non-performing loans (NPL) ratio remained low at 2.9 percent as of June 2024, and the level of special mention loans, an early warning indicator, also remained stable. The banking sector has adequate buffers to withstand potential adverse shocks: the capital adequacy ratio (CAR) stood at 19.5 percent mid-2024, above the regulatory minimum of 10.5 percent. Profitability remained below pre-pandemic levels, with Return on Assets (ROA) and Return on Equity (ROE) at 1.3 percent and 9.4 percent, respectively, as lending slowed. The government has implemented various debt relief measures to address the high levels of household debt,
including interest suspensions and reduced principal payments. However, these initiatives have also led to stricter lending criteria by banks dampening consumer demand for automobiles and other durables
Despite the recent rollout of the cash transfer scheme, the fiscal stance turned less expansionary as capital spending slipped due to the delayed budget. The FY24 deficit (October 23-September 24) was at a 5-year low of 2.5 percent of GDP, despite the September surge. This was due to improved revenue collection, driven by the economic recovery, and low capital expenditure, caused by a seven-month delay in implementing the FY24 budget. Despite a recent acceleration, investment budget disbursement reached only 70 percent in FY24, well below the average of 74 percent over the past three years. Public debt reached 63.3 percent of GDP and is projected to continue rising in line with a widening budget deficit for FY25, driven by increased spending, particularly for fiscal stimulus and cash transfers. In the last month of FY24 (September), the fiscal deficit widened primarily due to accelerated current and capital spendings. Current spending rose significantly because of the THB 10,000 cash transfer scheme, implemented as part of the first round of the Digital Wallet program, for 14 million Social Welfare Card holders (approximately 42 percent of the population in the lowest income deciles). While our preliminary estimates suggest that these transfers raised GDP growth by 0.3 percentage points in 2024, based on an estimated fiscal multiplier of 0.4, this comes at a high fiscal cost of THB 145 billion or 0.8 percent of GDP
Poverty declined in 2024, underpinned by the ongoing economic recovery and cash transfer program. Poverty is estimated to have declined to 8.2 percent in 2024, supported by stronger economic growth and easing inflation. The cash transfer also likely raised household consumption, contributing to a 3-percentagepoint reduction in poverty at the upper middle-income international poverty line (USD 6.85 per person per day). Additionally, inequality is estimated to have declined by about 1.5 Gini points. However, achieving sustainable progress in the medium term will require addressing vulnerabilities to climate-related shocks, such as this year’s flooding, along with structural challenges related to aging and labor incomes.
Outlook and Risks: Accelerating the Recovery
The economy is set to gain momentum in 2025, driven by stronger domestic demand and fiscal stimulus, while external factors will slow slightly. Growth is projected to accelerate to 2.9 percent in 2025 up from 2.6 percent in 2024 (Figure ES 5). Growth will be driven by a rebound in investment, supported by higher budget execution and implementation of pipeline infrastructure projects compared to the previous year. Tourism and private consumption will remain key, but slowing, drivers. Tourism is projected to return to pre-pandemic levels by mid-2025. Private consumption will be boosted by fiscal stimulus, in particular, the cash transfer (Digital Wallet) but face headwinds from the deleveraging cycle and stricter lending standards. Goods exports are expected to moderate slightly due to softer growth in the US and China, despite the global electronics upcycle. In 2026, growth is projected to slow to 2.7 percent, and the output level is expected to reach its potential level by 2028.
The current account surplus is projected to increase due to higher tourism receipts and lower shipping costs. The current account balance is expected to increase from 2.4 percent of GDP in 2024 to 3.6 percent of GDP in 2025, driven by services trade. The goods trade balance is projected to decline slightly due to slower export demand from key trading partners.
Inflation is projected to increase to 0.8 percent, up from 0.4 percent in the previous year but remain below the central bank’s target range in 2025. Core inflation and food prices are expected to increase due to demand pressures from rising household earnings, boosted by consumption-driven fiscal stimulus and a rebound in domestic economic activity. In contrast, energy prices are projected to contract, in line with global oil price.
With the planned fiscal stimulus and accelerated budget execution, the expansionary fiscal stance will support the economic recovery. The general government deficit is projected to increase from 1.3 percent of GDP in FY24 to 3.1 percent in FY25. This is mainly due to the acceleration in budget execution and fiscal stimulus spending in FY25, following the delayed budget approval in FY24. In FY25, the
1 All growth rates are expressed in year-on-year terms, unless otherwise noted.
government has earmarked around THB 300 billion for economic stimulus, focused on boosting consumption. This amount is part of the previously announced THB 450 billion Digital Wallet program, following the THB 140 billion already disbursed to the Social Welfare Card (SWC) holders in FY24. However, the details of the measures and overall funding source under the stimulus plan for FY25 remain uncertain.
Fiscal policy faces the rising triple challenge of meeting growing spending needs for aging-related public services, revitalizing investment to boost growth and keeping public debt levels sustainable. Public debt is projected to rise to 64.8 percent in FY25 and approach the ceiling of 70 percent of GDP in the next five years Thailand’s public debt remains fiscally sustainable with low levels of foreign currency denominated debt (1.0 percent of total debt) and relatively low cost of funding, but the pressure for higher social spending and public investments in human capital due to aging is increasing (WB Thailand Public Spending and Revenue Assessment 2023) Pro-growth consumption-stimulating measures such as the Digital Wallet have added to fiscal pressures. Key recommendations to enhance fiscal resilience amid rising spending needs:
• Reduce regressive energy subsidies (i.e. transportation, electricity, cooking gas) which contribute to the State Oil Fund deficit and instead focus on more targeted social assistance and transfers to effectively support vulnerable households and poverty alleviation.
• Raise tax revenue, promote equity, and create fiscal space. Despite improved revenue collection of 16 percent of GDP in FY24, it continues lag behind its upper-middle-income peers. Reforms to adjust VAT rates and exemptions to increase revenue while reducing poverty by simultaneously introducing VAT rebates can be implemented, for example. Other measures include broadening personal income tax base, streamlining generous tax incentives, expanding wealth tax collection, improving tax compliance, and introducing carbon taxes
• Accelerate investments. Public investments in infrastructure, new technology and complementary human capital can crowd in private sector investments and connect lagging regions (see Chapter 2 on Innovation in a Changing World: Empowering SMEs and Startups; WB Thailand Economic Monitor June 2024: Unlocking the Growth Potential of Secondary Cities).
While a cautiously accommodative monetary stance is appropriate to support the recovery, providing targeted household debt relief while minimizing credit tightening and maintaining financial stability remains a priority. Going forward, it will be important to specify the details for the selection of eligible program participants linked to an exit strategy down the road, to mitigate uncertainty on the part of creditors. Care must be taken in preserving the alignment of key prudential regulatory standards such as loan loss classification frameworks, provisioning requirements and accounting standards with international best practices. The change of regulatory definitions and classifications should be avoided. Temporary relief measures must be used in conjunction with longer-term and structural policy reforms by financial sector authorities in enhancing financial consumer protection, implementing the responsible lending framework such as an application of debt service ratio limits, and macroprudential framework.
Structural reforms on economic competitiveness can boost long-term growth. Projections indicate a sustained structural slowdown in Thailand’s growth without urgent policy reforms. Potential growth is expected to decrease by around 0.5 percentage points, dropping from an average of 3.2 percent in 2011-21 to 2.7 percent in 2022-30. At this rate, Thailand will not achieve its high-income aspirations by 2037. Raising competitiveness can help Thailand attract investments and move into more innovative or productive global value chains Key recommendations:
• Increase competition in the domestic market to encourage the entry of productive firms and the exit of unproductive firms. Policies include reducing barriers to entry, particularly in the services sector, improving regulatory frameworks and increasing labor market flexibility
• Support small and medium-sized enterprises (SMEs) to enhance productivity (see Chapter 2 on Innovation in a Changing World: Empowering SMEs and Startups).
Innovation in a Changing World: Empowering SMEs and Startups
Thailand is at a crossroads. The country has made big social and economic advances over the last 50 years To reach the levels of wealth and living standards that Thais aspire to, a concerted effort will need to be made to increase the productivity of the private sector, especially among SMEs. Increasing technology adoption and innovation will be fundamental to this effort Thailand sits in a very competitive region, so not doing enough can carry a hefty price when other countries are rushing to become innovation hubs.
External and internal challenges increase the need for more innovation. In addition to the productivity gap, other challenges, both internal and external, are testing Thailand’s ability to compete economically and to provide solutions to the country’s needs. The pace of technological change is accelerating and with it the risk of a widening technological gap between developed and developing countries. Climate change already presents a challenge to firms in Thailand, and adaptation will require adoption of cleaner and more sustainable production techniques. Thai companies will need to go green, or risk being shut out of global value chains demanding more sustainable practices among their suppliers.
Providing solutions to the country’s evolving needs. These challenges, however, also represent an opportunity. New products, services, and ways of doing things will be needed to address the effects of climate change, but also to address current and future needs such as an aging population, health care delivery (telemedicine), education, logistics and mobility, to cite but just a few. New solution providers are needed that introduce new business models that are resilient and flexible to adapt to an evolving world.
However, not enough SMEs are currently investing in innovation and technology upgrading in Thailand. The number of entrepreneurs trying to break into the market is also low, especially in the digital sector, which is crucial for productivity and innovation.
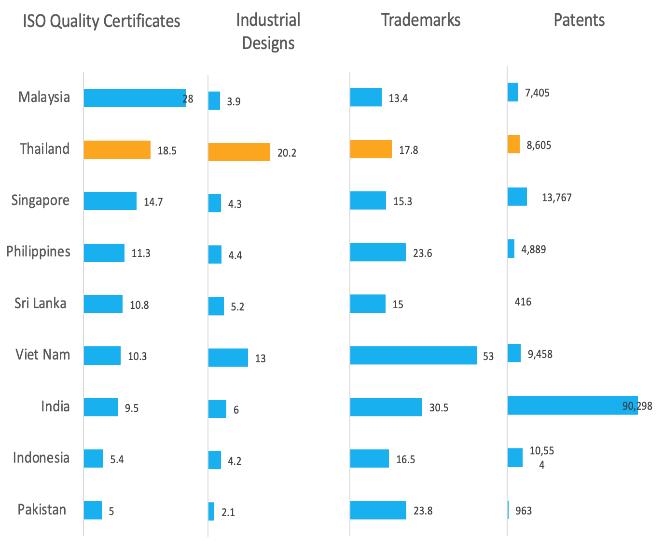
While overall R&D spending has increased in the last decade, private R&D remains concentrated on very few firms. R&D expenditures as a share of GDP have grown significantly, reaching 1.33 percent of GDP in 2020, from an average of 0.23 percent of GDP between 1999 to 2009. And while the share of private R&D over total R&D expenditure has been increasing (reaching as much as 74 percent of gross expenditure in R&D in 2021)2, these R&D investments remain very skewed. The number of private businesses investing in R&D activities is low (2.9 percent in 2016), lower than in peer and other middle-income countries.
Research done at universities and research centers may be misaligned with the needs of the private sector. A review of the allocation of innovation funding shows that most resources, even when focusing on technology adoption, go to public research organizations and universities. If the private sector does not lead these interactions, their priorities may not get the needed funding.
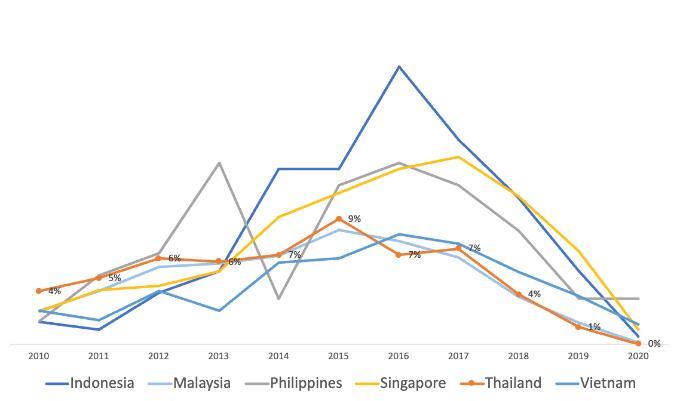
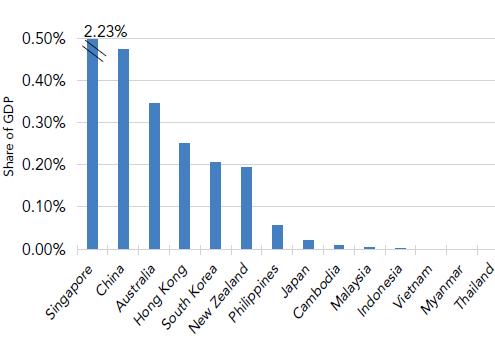
FDI can play a significant role in innovation. Foreign companies can also be another important conduit for the entry of new ideas, technologies and management processes. However, FDI flows in Thailand have lagged those of its peers. Until 2022, Thailand’s rate of investment was lower than those of regional and structural peers, suggesting potential uncompetitive entry regulations, especially when compared to some of its peers.
Several complementary factors must be in place to enable innovation. Some of these factors are more within the control of firms to address (staff training and management practices), while others are more economy and sector wide obstacles that impact firms’ ability to innovate (regulations on competition, business entry and access to finance, among others).
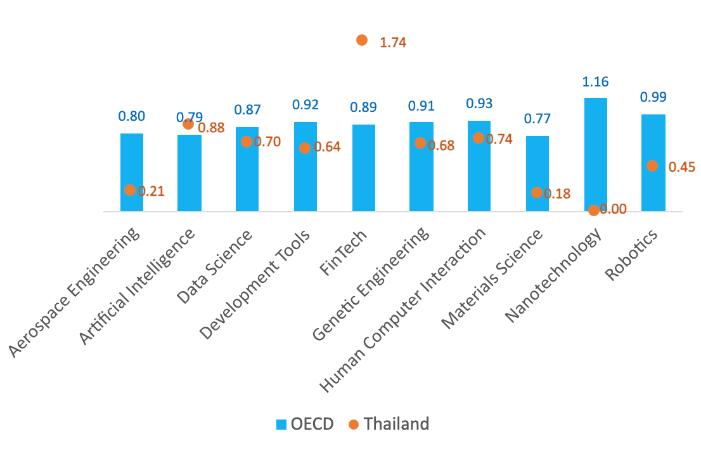
Innovation requires skilled labor to implement new processes and produce new products. Evidence suggests that the education system in Thailand is not creating the type of trained labor that is needed to push for innovation and high technology development.
2 The United Nations Conference on Trade and Development (UNCTAD 2017) estimated that the business sector contributed 45 percent to total R&D in 2009. More recently, some reports indicate that business expenditure in R&D (BERD) contributed as much as 74 percent of gross expenditure in R&D (GERD) in 2021 (NRCT, 2023).
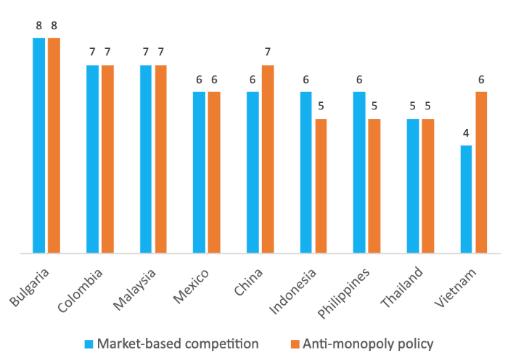
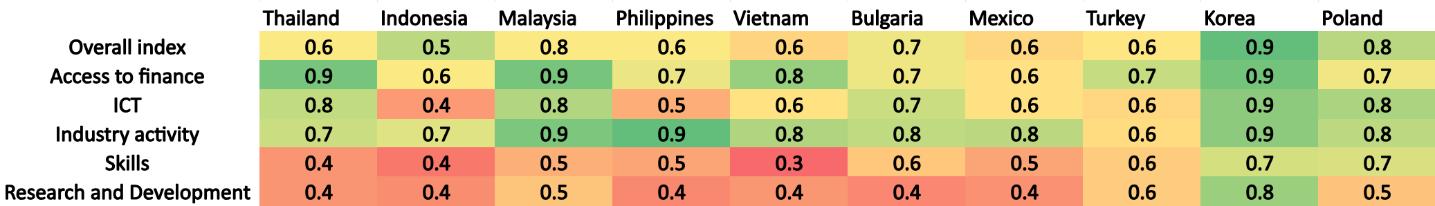
Limited competition and an uneven playing field constrain the emergence of new innovative firms. Competitive pressures stimulate firms to innovate and upgrade their technology, management practices, and products and services. Competitive forces are notably feeble in Thailand and are weakened by distortive policies. Thailand has lower scores on indicators of market competition and enforcement than many of its peers.
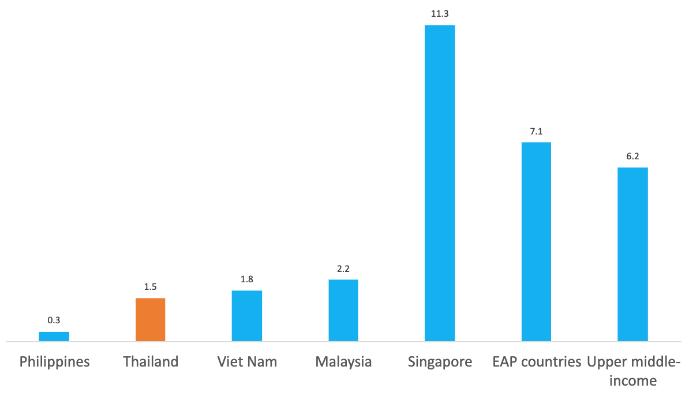
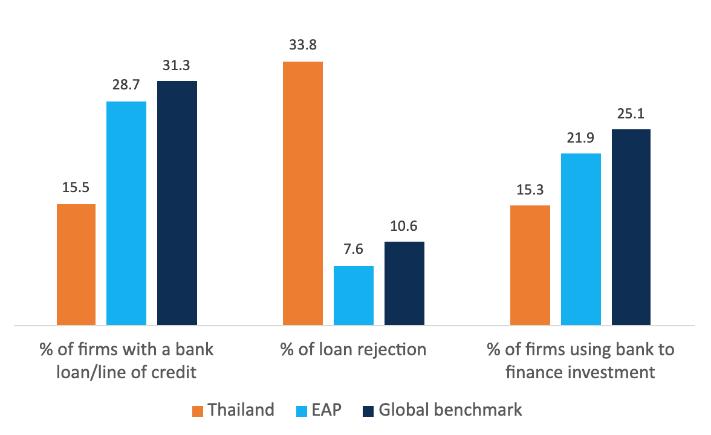
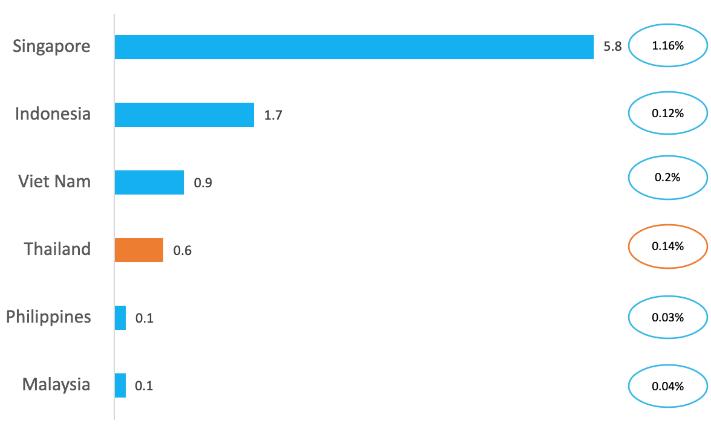
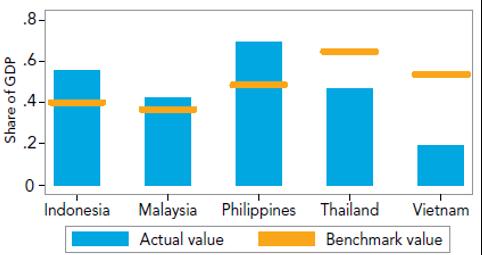
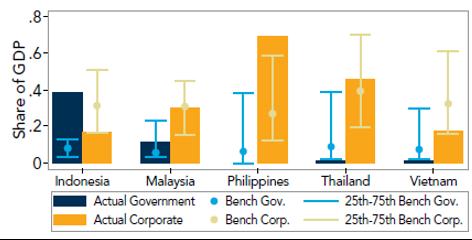
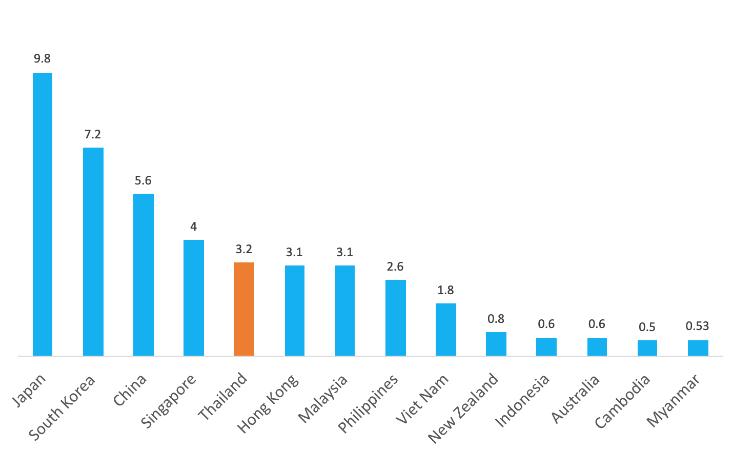
Finally, financing new business is challenging, especially for innovative, tech-based companies Thai MSMEs have limited access to bank loans, are more likely to be rejected for a loan, and use more of their own resources to finance investment than regional peers (Figure ES 13). The amount of venture capital in Thailand is low (0.14 percent of GDP) and there is a significant funding gap for early-stage ventures more generally.
The good news is that Thailand has risen to big challenges before and can do so again. Becoming an upper-middle income has given the country many lessons and experiences to draw from. Moreover, the country is well integrated in trade networks that can be leveraged and built upon. Business regulation is not overly burdensome, and the country is an attractive place for foreign talent. The push now is to build a sense of urgency that can bring Thais together to focus on the most pressing issues that are constraining firms to innovate and upgrade. A challenging and unpredictable international environment puts a premium on having agile and innovative systems of support so that SMEs can push and be pushed to greater productivity. Thailand has its work cut out. This report offers some recommendations on what to prioritize. These are summarized next.
Support SME modernization and upgrading. Current programs should be reviewed to ensure that a strong focus is given to this upgrading, especially digital and climate technologies. Expanding outreach of these programs will be important: every SME should know that these programs exist, what they support and how to apply for them. At the same time, managers and employees will need to increase their capacity to implement and manage these innovations.
Leverage Thailand’s role in GVCs to increase innovation and productivity. To fully leverage Thailand’s insertion into GVC, the country will need to continue to ease restrictions on Foreign Direct Investment (FDI), particularly on services trade including professional, scientific, and technical activities and land transport services and to a lesser extent also financial activities service. In addition, a more pro-active use of instruments that create linkages to global value chains and FDI should be pursued: open innovation challenge instruments, and supplier linkage and development programs.
Bring in new business models and products and services. Thailand will need to see more businesses created. There is likely a need for public support for more incubation and acceleration programs, within a framework that follows international best practices (professionally run, competitive selection of beneficiaries, time-bound, structured programs of incubation). But technical support will need to be complemented with financing. The notable gaps in financing need to be reviewed, to ensure availability of financing to start-ups at various stages of development (ideation, prototyping, go to market, scaling up). This should include an evaluation of current regulations around risk financing, such as Venture Capital. Finally, successful entrepreneurs should be celebrated, to provide role models for the next wave of entrepreneurs.
From supply to demand driven R&D. A big change will be needed to move R&D from a supply driven to a demand driven effort. This means making research more connected to industry needs by promoting industry-academia research consortia projects that are led by the private sector, and not the other way around. Additional reviews and upgrade of regulations and incentives that affect higher education institutions should be conducted, to ensure that researchers and professors that would like to engage in commercialization and entrepreneurship efforts are not only allowed to but also incentivized to do so.
Improve R&D support instruments. Government programs that support R&D need to be reassessed, to ensure that more SMEs are supported to introduce product or process innovation. R&D tax incentives need to be simplified, increasing their predictability and alignment with international best practices. Finally, improving Monitoring and Evaluation efforts to enhance effectiveness of these interventions is essential, to optimize resource allocation amongst competing programs.
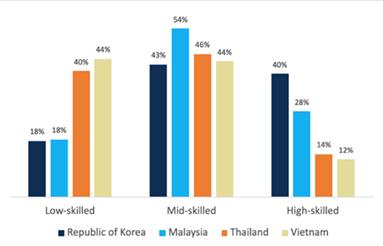
More high-tech skills. Thailand needs to focus on developing more high-tech skills, including digital and creative skills. Link targeted activities to specific high-growth sector needs, maintaining close coordination and communication with private sector to continually adjust the curriculum as technologies develop. And when needed, these initiatives must be complemented with targeted talent attraction efforts to fill skill gaps that are already present and will continue to occur in the short to medium term. Regional peers such as Korea offer interesting examples of how to address this issue (see Box 3, chapter 2).
Competition and trade. Continuously assess the state of competition and market-entry in key sectors linked to innovation priorities. Remove restrictions to the importation of capital goods or services that are important for firm technology upgrading and innovation. If the technology already exists in the world, there is no need to reinvent the wheel. Thailand should facilitate that acquisition and absorption of technology.
Coordination. The final element of a concerted effort to promote innovation is coordination. As it is clear from the different policies and factors that affect innovation that have been highlighted above, coordination of these efforts is key. Promotion of start-ups needs to be done in tandem to ensuring fair competition and entry to targeted growth sectors, while skills development will be essential to staff these growing and more technologically sophisticated enterprises. The left hand not only needs to know what the right hand is doing, they actually need to move together. And while essential, the need for this coordination is not restricted to the public sector. Frequent and open communication and coordination of actions is needed with the universities and research institutes and with the private sector. Thailand needs to take this challenge on as a country, not only as a government
Recent Developments and Medium-Term Outlook
Figure ES 1: Growth exceeded expectations in Q3 2024 due to strong public investment
Figure ES 2: The pace of post-pandemic recovery has picked up but Thailand continues to lag peers (Percentage-point contribution to real GDP growth, year-on-year) (GDP Index, seasonally adjusted, Q4 2019 = 100)
Source: NESDC
Note: Change in inventories include statistical discrepancies
Figure ES 3: Headline inflation remained low due to easing global prices and continued price controls
Source: CEIC; World Bank staff calculations
Figure ES 4: Indicators point to an ongoing recovery in goods exports amid subdued global demand (Contribution to headline inflation, % change y-o-y) (Left: Diffusion Index; Right: Percent year-on-year)
Source: CEIC; World Bank staff calculations
Figure ES 5: Public debt is projected to rise due to planned stimulus while peers are consolidating
Source: CEIC; World Bank staff calculations
Figure ES 6: Potential growth can be uplifted by investments and structural reforms (Percent of GDP) (Output index versus potential output index, 2019=100)
trend (2008-23)
Source: CEIC; World Bank staff projections.
Source: World Bank staff projections
Table ES 1: Macroeconomic Indicators
GDP Growth Rate (at constant factor
Note: 1/ Exports of goods and services accounted for 69.4 percent of GDP in 2022. See more details in the outlook section
Source: NESDC; World Bank staff calculations
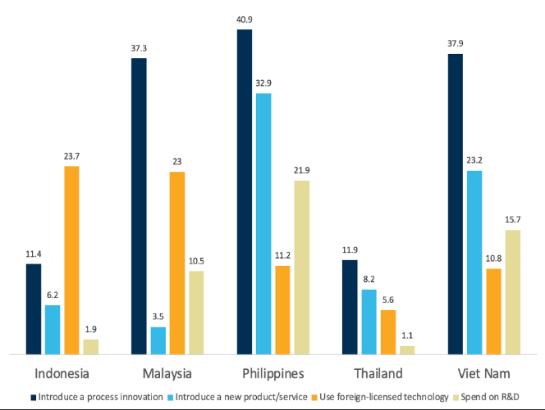
Figure ES 7: Thai firms can do more in terms of innovation (Share of Firms, %)
Source: World Bank Enterprise Surveys
Figure ES 8: …and more entrepreneurs are needed in the country. (New Business Registration,
1,000
Source: WDI
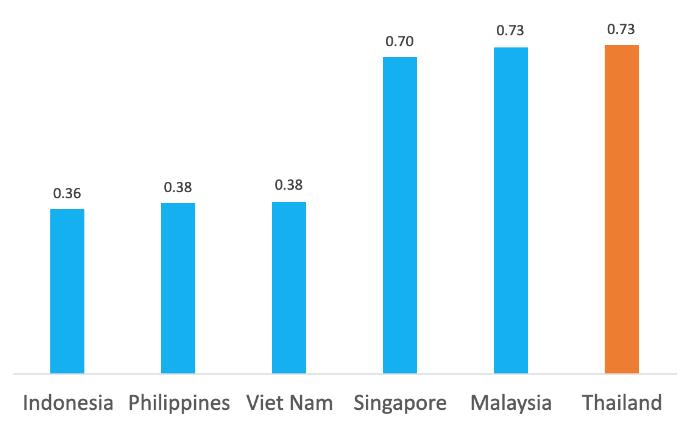
Figure ES 9: FDI can be a conduit for new technologies and practices, but inflows into Thailand have remained behind peer countries (Percent of GDP)
Source: CEIC; World Bank staff calculations.
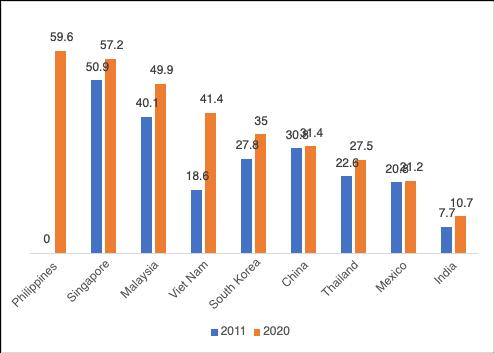
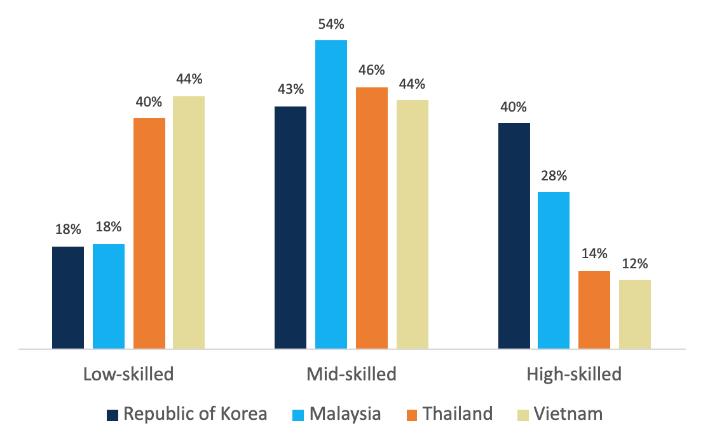
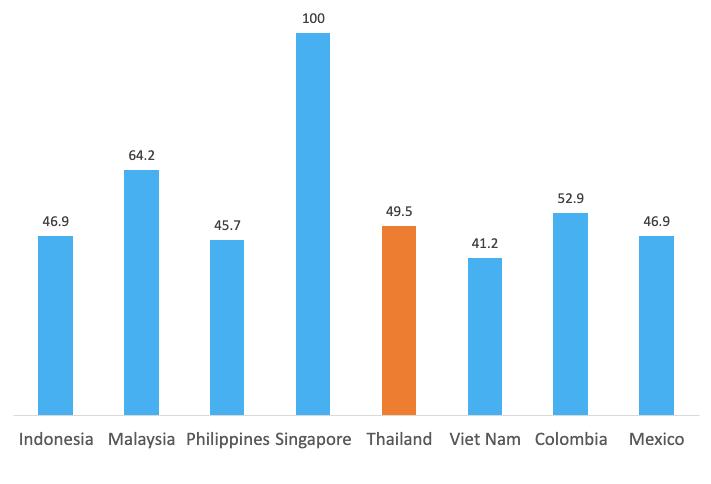
Figure ES 11: To innovate and move into more high-tech sectors, skill levels will need to be upgraded (% of labor force, 2019)
Source: ILOStat
Figure ES 13: Improving access to finance for SMEs will be essential for firms to be able to invest in technology adoption and innovation (% of firms responding)
Source: World Bank Enterprise Survey, 2016
Figure ES 10: Making FDI regulations more competitive with peer countries in the region may help attract more investments
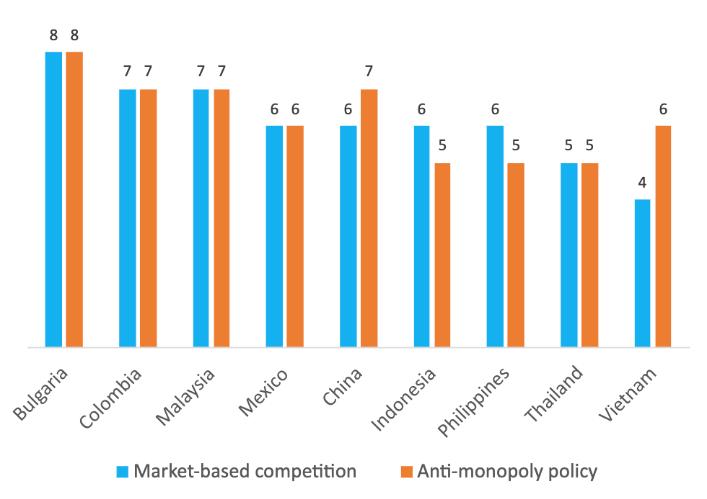
Figure ES 12: While greater and more equal competition will allow for new firms to enter markets and bring with them innovations.
Source: Country Private Sector Diagnostics, 2022 Note: higher scores mean better competition enabling environment and stronger anti-monopoly policies in place.
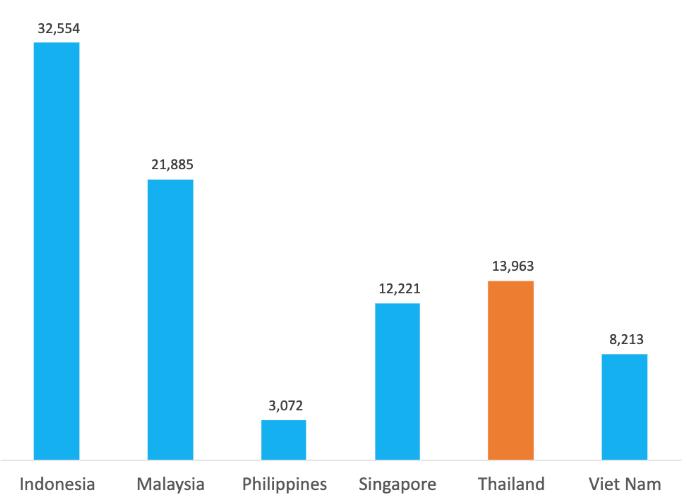
Figure ES 14: …while risk financing for highgrowth and innovative start-ups will also need to be significantly enhanced (Size of Venture Capital Funding in Southeast Asia, US$ billion.)
Source: SEA venture capital landscape 2020, White Star Capital
Part 1. Recent Economic Developments and Outlook: Subdued Growth
1. Recent Economic Developments
i.
The Global Economy
Global growth remains subdued.
After reaching standstill last year, global trade appears to be recovering, supported by a pickup in goods trade.
Despite some improvement in recent months, global growth remains subdued, with advanced economies and emerging market and developing economies (EMDEs) set to grow, in aggregate, at a slower pace over 2024-26 than in the decade preceding the pandemic. There is marked divergence across the three main engines of global growth, with the United States exhibiting remarkable resilience, contrasting with feeble growth in the euro area and a notable slowdown in China this year. While domestic demand growth is set to step down in some large EMDEs, this year owing to a range of idiosyncratic factors, more broadly, EMDE domestic demand is projected to improve, reflecting a moderate cyclical recovery after last year’s slowdown due to high inflation, tight financial conditions, and anemic industrial activity. That said, growth prospects have deteriorated since January in the most vulnerable EMDEs, including many lowincome countries, and those facing increased levels of conflict and violence.
The global trade outlook remains lackluster compared to the two decades preceding the pandemic, weighed down by proliferating trade-restrictive measures and elevated trade policy uncertainty, among other factors. Services trade growth is expected to provide less of a tailwind, given the post-pandemic tourism recovery is nearing completion. Further trade fragmentation could have adverse global repercussions via declining economic confidence, increasing trade distortions, and related financial market reactions particularly for open economies such as Thailand. Nevertheless, Thailand could benefit from potential trade diversion of US imports away from China.
ii. Growth and Real Sector Developments: Subdued Recovery
Economic growth surged above expectations in Q3 2024.
However, growth has yet to become broadbased: goods exports, tourism and public investment have strengthened but private domestic demand has slowed.
The economy expanded notably by 3.0 percent, (consensus: 2.6 percent), up from 2.2 percent in the previous quarter Quarterly growth accelerated to 1.2 percent (seasonally adjusted), marking the third quarter consecutive expansion (Figure 1). GDP remained below potential, reflecting an economy in prolonged recovery.
Public investment expansion (25.9 percent) returned to the fore as a growth driver following several quarters of delayed budget execution amid the political transition (Figure 2) The resumption of public infrastructure projects, such as high-speed rail, mass transit and waterworks boosted construction activity (see Box 1) External demand for goods (8.3 percent) and services (21.9 percent) expanded. Goods exports benefited from the electronics upcycle and technological advances such as Artificial Intelligence Services continued to be supported by the ongoing recovery in tourism, though this recovery is slowing as global tailwinds dissipate Other domestic drivers weakened Private consumption continued to slow (0.7 percent), with automobile purchases contracting sharply as indebted consumers had difficulty accessing loans amid tighter credit standards. Significant inventory rundown reflected external and domestic uncertainties surrounding growth. Private investment contracted (-2.5 percent) due to reduced investments in equipment and construction, influenced by tightened credit standards and economic uncertainty.
Reliance on consumption and tourism resulted in modest growth and a lagging recovery end 2024.
Growth in private consumption, which accounts for more than half of overall output growth, slowed in the first 3 quarters of 2024 amid high household debt, tighter credit conditions and subdued medium-term growth prospects. 3 Purchases of durables (vehicles) contracted while non-durables remained strong After two months of contraction, the Private Consumption Index turned positive in Q4 2024 due to fiscal stimulus from the THB 10,000 cash handout to lowincome households and easing concerns over the recent floods.4 Reliance on private consumption5 as a driver of the economy in the past, subdued investment and slowing potential growth have contributed to low household savings and the highest household debt level in ASEAN (89.5 percent of GDP end-2024) Mirroring weak private consumption, high frequency supply-side indicators show that manufacturing output contracted by 3.6 percent, marking its deepest contraction in 8 months (Figure 3), due to slowing domestic and external demand for automobiles Tourism typically constitutes a large share of the GDP at 12-17 percent prior to the pandemic However, tourist spending reached only 8.9 percent of GDP with tourism arrivals remaining at only 86 percent of prepandemic levels end-2024 despite the recovery in global tourism Investment has yet to emerge as driver of recovery and medium-term growth.6 As a result,
3 Private consumption has typically been the largest contributor to output growth, accounting for close to 40 percent of output growth over 2006-2020. In an upturn, private consumption leads output growth, contributing the largest share at one-third of output growth while in a downturn it helps support aggregate demand, contributing to more than half.
4 The floods in Northern and Central Thailand affected 240,857 households across 44 provinces and resulted in 52 deaths from August to early October 2024.
5 See Box 2. Private investment and economic cycles passing the baton WB Thailand Economic Monitor January 2022
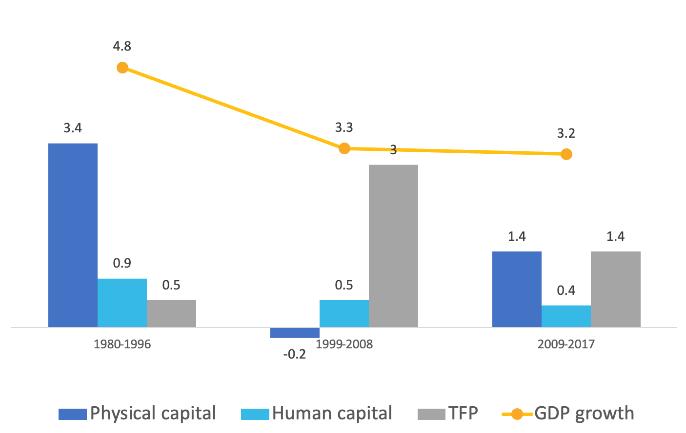
6 See WB Thailand Systematic Country Diagnostic Update 2024 The slowdown of investment contributed approximately two-thirds to the average GDP decline between 1980-96 and 2000-19. The deceleration in investment and growth in Thailand can be attributed to various adverse shocks, beginning with the Asian Financial Crisis (AFC) and followed by subsequent crises such as the Global Financial Crisis (2008-09), the 2011 floods, and the 2013-14 political crisis.
Thailand’s growth divergence from ASEAN peers remains considerable; the gap is equivalent to accumulated losses of 8-14 percent of GDP following recovery to pre-COVID income levels (Figure 4).
Figure 1: Positive quarterly momentum remained positive but subdued
Figure 2: Public investment offset weak goods exports private investment and consumption (Percentage change) (Percentage-point contribution to real GDP growth, year-on-year)
Source: NESDC
Figure 3: Manufacturing remained weak
Source: NESDC
Figure 4: Thailand’s recovery has lagged behind ASEAN peers by 8-14 percent of GDP (Index, sa) (Index Q4 2019 = 100, sa)
Source: CEIC; World Bank staff calculations
Note: The MPI series for year 2024 are adjusted by the OIE (coverage and base year at 2021). MPI series for year 20192023 use 2016 as base year.
On the supply side, services dominated growth while manufacturing was broadly flat.
Source: NESDC; CEIC; World Bank staff calculations
The services sector, particularly tourism, played the predominant role in overall economic growth (Figure 5). The sector expanded by 4.1 percent, driven by international tourist arrivals and domestic travel. Hospitality, retail, and transportation services benefited the most. The manufacturing sector grew by just 0.1 percent primarily due to contracting automotive production reflecting prolonged weakness in the sector before and after the pandemic. Reaping opportunities from weak global manufacturing remains a challenge for exportoriented downstream industries.
7 The agricultural sector saw a modest growth of 1.8 percent due to flood in northern Thailand (Figure 6). Favorable weather
Investment growth averaged only 3 percent between 1999 and 2019, with both public and private investment slowing. The COVID-19 pandemic further impacted investment in 2020
7 See World Development Report: Trading for Development in the Age of Global Value Chains (2020) and WB Thailand Manufacturing Productivity Report (2020).
conditions and higher crop yields in the beginning of the quarter as well as flood mitigation measures offset the flood impact.
Figure 5: Services, particularly tourism, continued to drive the recovery
Figure 6: Agricultural production grew modestly despite flooding (Percentage-point contribution to real GDP growth, year-on-year) (Base year 2005 = 100, seasonally adjusted)
Source: NESDC
Source: Office of Agricultural Economics, Ministry of Agriculture and Cooperatives
iii. The current account remained in surplus as the trade surplus strengthened
In Q3 2024, the current account surplus rose to 1.5 percent of GDP as the trade balance benefited from improved services.
The current account surplus rose to 1.5 percent of GDP in Q3 2024, mainly due to a smaller deficit in services trade(Figure 7). This reduced deficit in net services and income from abroad reflected an improved balance in travel services trade as the number of tourist arrivals increased in Q3. The goods trade balance remained positive, with both export and import growth accelerating on the back of the current global technology upcycle supported by the demand for AI-enabled devices.8 Exports expanded by 8.9 percent in Q3 2024; automatic data processing machines (ADPM) such as computers, contributed to more than a third of the export growth. Among the major trading partners, the US, the EU, and ASEAN economies underpinned the robust export demand in Q3. Meanwhile, import growth surged to 11.3 percent in Q3 2024 from last year’s low base, driven primarily by imports of capital goods, raw materials, and intermediate products from China. This pattern of trade flows highlights Thailand’s growing role in global value chain (GVC) participation despite global trade tensions. Thailand’s share of GVC-related trade in gross trade increased from 43.9 percent in 2019 to 51.3 percent in 2022, marking one of the fastest increases among peer countries (Figure 8).9
Reduced foreign portfolio outflows in Q2 narrowed the
In Q2 2024, the financial account deficit narrowed to 2.2 percent of GDP, compared to a deficit of 3.9 percent in the previous quarter, driven primarily by a reduction in net portfolio outflows (Figure 9).
8 Global demand for AI-related goods has been increasing. Preliminary data suggests that aggregate ADPM exports including graphics processing units (GPUs) for top 6 exporters increased by 18.4 percent in 2024 Q3. The 6 countries are China, US, Mexico, Netherland, Germany and Czech, which account for over 70 percent of global ADPM exports based on data released by UN COMTRADE. Hong Kong (SAR) and Taiwan, Province of China were excluded due to lack of Q3 data.
9 GVC-related trade encompasses all traded items that cross at least two international borders, meaning they are re-exported at least once before being absorbed in final demand. For the detailed methodology, see World Development Report (2020).
Foreign currency markets suggest limited exposure to potential trade tariffs.
The easing portfolio outflows from both equity and bond markets, along with a weakening U.S. dollar index, surging gold prices, and improving domestic political stability, contributed to a rapid strengthening of Thai Baht since the end of Q2, erasing the loss in the first five months. The Real Effective Exchange Rate (REER) of the Baht rallied by 7.5 percent from June to December 2024, making it the second-strongest currency among peer countries in the region, following Malaysia where the REER of the Ringgit appreciated by 8.1 percent over the same period (Figure 10).
In the run-up to the US elections and until end-2024, the Thai baht depreciated against the US dollar as markets priced in potential trade tensions. However, the magnitude of the depreciation was smaller compared to other major trading partners, as Thailand’s direct exposure to US trade tariffs remained limited, due to its relatively smaller trade surplus with the US (see Table 1). Despite this current limited exposure, future redirection of trade flows poses risks for Thailand, similar to other Asian peers and Mexico, which may emerge as connector countries with increased exposure to US trade tariffs (see WB East Asia Update October 2024). Protectionist measures have risen globally since 2020; in parallel, import growth from China to Thailand has surged 7.5 percentage points higher than the historical average. Nevertheless, potential upsides from trade diversion and relocation of new supply chain exists.
FDI remained subdued, mostly due to the decline in manufacturing.
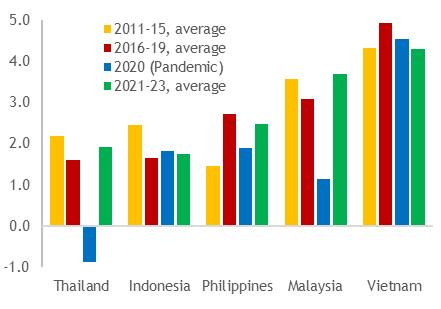
Direct investment recorded a net outflow equivalent to 1.0 percent of GDP in Q2 2024, reflecting subdued foreign direct investment (FDI) inflows into Thailand, consistent with the trend in developing economies10 as rising geopolitical and economic fragmentation weighed on investor sentiment. While Thailand still leads ASEAN peers in terms of FDI stock11, recent FDI inflows remain behind many peers (Figure 11). The decline in net FDI inflows was particularly pronounced in manufacturing, notably the automobile sector in the first half of 2024, in part due to the disruptions caused by EVs on multinational internal combustion engine (ICE) vehicle manufactures (Figure 13 and Figure 14).Yet, this impact can be offset by transitioning the sector towards electric vehicles (EVs). Applications for investments in targeted sectors (e.g. EVs, electronics, and digital economy) reached a record high in Q4 (Figure 12)
10 “FDI flows to developing economies rose by 5 percent, mainly due to a USD 35 billion project in Egypt. Without it, flows would have decreased by 3 percent, continuing the decline observed in 2023.” Global Investment Trend Monitor, UNCTAD https://unctad.org/publication/global-investment-trends-monitor-no-47
11 Thailand’s FDI inward stock as a share of GDP has consistently been the highest among ASEAN economies over the last decade. In 2023, the FDI inward stock stood at 61 percent of GDP, surpassing Malaysia, and Vietnam. See UNCTAD World Investment Report 2023 and WB Thailand Economic Monitor December 2023
Figure 7: The current account surplus rose in Q3 2024, with a narrower net services deficit
Figure 8: Thailand’s participation in global value chain trade increased amid global trade tensions (% of GDP) (GVC-related trade % gross trade)
Source: Bank of Thailand; World Bank staff calculations
Figure 9: Easing foreign portfolio outflows contributed to a smaller financial account deficit
Source: World Integrated Trade Solution (WITS; World Bank staff calculations.
Figure 10: The REER for Thailand appreciated rapidly since June 2024 (% of GDP) (January 2020 = 100)
Source: Bank of Thailand; World Bank staff calculations
Figure 11: FDI inflows in 2021-2023 improved but remained behind Philippines, Malaysia and Vietnam
Source: World Bank Global Economic Monitor (GEM)
Figure 12: Applications for investments in targeted sectors reached its record high (Percent of GDP) (Percent of GDP, quarterly)
2011-15, average 2016-19, average 2020 (Pandemic) 2021-23,
Source: CEIC; World Bank staff calculations.
Source: Board of Investment; World Bank staff calculations.
Table 1: Key trade indicators of major US trading partners
Note: *annual average Imports growth in 2020-2024, deviation from average of 2011-2020; FX depreciation between October and December 2024
Source: CEIC; World Bank staff calculations
Figure 13: FDI in the manufacturing sector remained subdued in H1 2024
Figure 14: Declining FDI inflow into auto sector reflected challenges faced by traditional ICE vehicle manufacturers (USD million) (USD million)
The reserve position remains robust. Thailand’s external buffers remain robust by the end of Q3 2024. The improvement in current account surplus contributed to an increase in foreign exchange (FX) reserves by approximately USD 7.0 billion in Q3, resulting in a Ranks US trading partners
Source: Bank of Thailand; World Bank staff calculations
Source: Bank of Thailand; World Bank staff calculations
total reserve accumulation of USD 11.0 billion for the first nine months of 2024. Overall, FX reserves are equivalent to 10.8 months of imports. As of the end of September, Thailand’s net international reserves and forward position presented 46.0 percent of GDP or 3.6 times the level of short-term external debt, providing authorities with adequate flexibility to respond to external shocks (Figure 15).
Figure 15: Thailand’s international reserves and forward position remain robust at more than three times the level of short-term external debt (LHS: % of GDP, RHS: short-term debt)
International reserve and forward position (net), % of GDP International reserve and forward position (net)/Short-term external debt (RHS)
Source: Bank of Thailand; World Bank staff calculations
iv. Inflation edged up slightly but remained the lowest amongst emerging markets
Inflation edged up due to the removal of diesel subsidies but remained among the lowest in ASEAN.
In November, headline inflation edged up from 0.8 percent to 1.0 percent, marking the fourth consecutive month of increase, but remained the lowest among ASEAN peers and below the central bank’s target range (1-3 percent)12 due to below-potential growth (Figure 18). The rise was driven by core inflation, on the back of prepared food prices, as well as and energy prices (Figure 16 & Figure 17) Energy prices rose following the removal of the diesel price subsidy in April despite the decline in global oil prices compared to last year. However, the government continued electricity and cooking gas subsidies. From January to April, the power tariff was reduced to 4.15 baht per kilowatt-hour, down from 4.18 baht per unit in 2024, as part of the government’s policy to ease households' living costs. The government has promised further cuts to 3.70 baht per unit.
12 The inflation target serves as a nominal anchor for monetary policy, while the flexibility in exchange rates helps absorb shocks to the economy Thailand's stable inflation has contributed to a stable economic environment and hence the effectiveness of the managed-float regime. See Nuwat Nookhwun and Rawipha Waiyawatjakorn (2024) Flexible Inflation Targeting and Macroeconomic Performance: Evidence from ASEAN. Bank of Thailand.
Figure 16: Headline inflation edged up in the second half of 2024 driven by core prices
Figure 17: Core inflation increased slightly due to elevated food prices
(Contribution to headline inflation, % change y-o-y)
(Contribution to core inflation, % change y-o-y)
Note: Headline inflation includes raw food and energy.
Source: CEIC; World Bank staff calculations
Figure 18: Inflation remained well below other ASEAN economies
(Percent year-on-year)
Source: MOC; CEIC; World Bank staff calculations
Note: Core inflation includes prepared food and excludes raw rood and energy.
Source: Haver Analytics; World Bank staff calculations
Figure 19: Long-term inflation expectations remained within the target range
Source: Puey Ungphakorn Institute for Economic Research, Bank of Thailand
v. Financial stability has been maintained but high household debt remains a vulnerability and credit conditions have tightened
Household debt remained the highest among ASEAN and poses risks to the financial sector and household welfare.
In the decades prior to the pandemic, household debt surged (40 percent in 2003 to 90 percent in 2020) due to financial liberalization in consumer finance, proconsumption fiscal and quasi-fiscal stimuli in 2011-2012 (e.g. first car tax rebate, first home, and the rice pledging scheme) and income shocks (2011 floods, political protests 2013-14 and the pandemic). The level of household debt declined to 90.7 percent of GDP in Q2 2024 from its peak of 95.8 percent two years ago as households began to deleverage post-pandemic. Nevertheless, household debt remains a major vulnerability for the financial sector due not only to its level but also the share of uncollateralized consumer loan in bank lending portfolios. The bottom 20 percent of Thai households (e.g. farmers, selfemployed, elderly) use significant credit card debt (40 percent) and face high debt service ratio (DSR) at 40 percent, twice as high as other income groups and slightly higher than comparable income groups in Malaysia and Indonesia.13 Given that these households spend on average 60 percent of their income on food
13 Socio-Economic Survey (SES) 2021, National Statistical Office. Also see Monetary Policy Report (2021). Box 4: Thailand’s household debt situation and financial vulnerabilities. Bank of Thailand.
The financial sector remained generally resilient.
and housing, little or no liquidity buffer is left. 14 Measures by the BOT to promote responsible lending, curb excessive pricing in informal lending and enhance macroprudential policies are welcome progress in tackling household indebtedness and complement temporary relief measures, discussed further below.
System-wide non-performing loans (NPL) ratio remained low at 2.9 percent as of June 2024, and the level of special mention loans, an early warning indicator, also remained stable. The banking sector also has adequate buffers to withstand potential adverse shocks: the capital adequacy ratio (CAR) stood at 19.5 percent mid-2024, above the regulatory minimum of 10.5 percent. The liquidity coverage ratio (LCR), designed to gauge bank liquidity conditions in times of stress, stood at 195 percent in June 2024, well above the 100 percent regulatory minimum. Profitability remained below pre-pandemic levels, with Return on Assets (ROA) and Return on Equity (ROE) at 1.3 percent and 9.4 percent, respectively, as lending slowed.
Temporary debt relief measures in Thailand have contributed to tightened credit conditions.
The government’s directive to lower loan interest rate for vulnerable lowincome households can provide temporary relief if well-targeted while avoiding the erosion of regulatory standards.
The government has implemented various debt relief measures to address the high levels of household debt, including interest suspensions and reduced principal payments. These measures aim to support retail borrowers and small businesses struggling with debt. However, these initiatives have also led to stricter lending criteria by banks. The Bank of Thailand has tightened credit standards, particularly for auto and home loans, to manage the increase in nonperforming loans. This has resulted in a reduction in loan advances and a slowdown in sectors like auto production and residential property sales. Lending to the real economy weakened further as credit to private non-financial corporate sector dipped into negative territory (-0.3 percent in September 2024), following a continuous decline since March 2024.
The reduction of debt burden for lower-income households could reduce income and wealth inequality as well as boost aggregate demand due to the higher marginal propensity to consume by lower-income household. 15 Poorer households are more likely to face credit and liquidity constraints, higher debt concentration among households with limited access to credit tend to amplify negative aggregate demand shocks. Hence, well-targeted relief measures aimed at changing the distribution of household debt burdens could potentially reduce inequality and increase consumption, and hence have positive implications for economic growth through improved consumer sentiments and higher aggregate demand. The Thai Bankers’ Association’s recently announced a debt restructuring program, in the form of interest payment suspension for vulnerable borrowers. The program has several desirable design features such as being targeted, time-bound, well-funded, and mindful of risks of moral hazard in the financial market. These design features render the proposed debt relief program more suitable as a starting point to resolve the household debt situation than broad-based policy measures such as the use of monetary policy.
Going forward, it will be important to specify the details for the selection of eligible program participants, as well
Care must be taken in preserving the alignment of key prudential regulatory standards such as loan loss classification frameworks, provisioning requirements and accounting standards with international best practices. The change of regulatory definitions and classifications should be avoided. Temporary relief measures must be used in conjunction with longer-term and structural policy reforms by financial sector authorities in enhancing financial consumer protection and macroprudential framework.
14 Monthly household expenditure survey, November 2024, Ministry of Commerce.
15 Lombardi, Mohanty and Shim (2017) finds evidence that negative long-run effects on consumption and growth intensify as household debt-to-GDP exceeds 60 percent and 80 percent, respectively.
as an exit strategy down the road.
vi. Despite recent cash transfers, the fiscal stance has become less expansionary due to the delayed budget approval?
The central government's fiscal deficit decreased in FY24 due to delayed budget approval.
The FY24 deficit (October 23-September 24) was at a 5-year low of 2.5 percent of GDP, despite the September surge (Figure 20). This was due to improved revenue collection, driven by the economic recovery, and low capital expenditure, caused by a seven-month delay in implementing the FY24 Budget (Figure 21) The investment budget disbursement reached only 70 percent by the end of FY24, well below the average of 74 percent over the past three years. Public debt reached 63.3 percent of GDP and is projected to continue rising in line with a widening budget deficit for FY25, driven by increased spending, particularly for fiscal stimulus and the cash handout. In the last month of FY 24 (September), the fiscal deficit widened primarily due to accelerated current and capital spendings. Current spending rose significantly because of the THB 10,000 cash handout scheme for 14 million Social Welfare Card holders.
20: The central government’s fiscal deficit in FY24 declined slightly
(% of fiscal year GDP, Central Government, GFS basis)
Figure 21:The overall fiscal spending declined in FY24
(% of fiscal year GDP, Central Government, GFS basis)
Source: Fiscal Policy Office, Ministry of Finance
Source: Fiscal Policy Office, Ministry of Finance, NESDC
Figure
The government rolled out the first phase of the Digital Wallet universal cash transfer program.
Public debt remains sustainable, despite recent increase in borrowing for financing fiscal deficit.
The Digital Wallet program aims to provide a one-time transfer of THB 10,000 to 45 million Thai citizens. While the overall program is universal, the first phase, rolled out in September, was targeted: cash transfers were provided to 14.5 million Social Welfare Card holders. The first phase focused on cost-of-living support for the low-income and vulnerable groups, who tend to have a higher marginal propensity to consume. As a result, it boosted private consumption and reduced poverty in Q4, with fiscal costs amounting to THB 145 billion (0.8 percent of GDP). Our preliminary estimates suggest that these transfers may have raised GDP growth by 0.3 percentage points in 2024, based on an estimated fiscal multiplier of 0.4. In 2025, the initiative may expand to a broader population at an additional cost of THB 305 billion (1.6 percent of GDP). However, with the remaining budget for this program at THB 170 billion (0.9 percent of GDP), securing the additional funding needed may be challenging While the program could boost domestic consumption and regional economic activity, considerable challenges, such as concerns regarding the legality of using the supplementary budget to fund the program, implementation delays, spending restrictions and uncertainties regarding fiscal multipliers, remain.
Public debt rose to 63.3 percent of GDP at the end of FY24, 22 percentage points higher than the pre-pandemic level (Figure 22). The fiscal deficit remained higher than pre-pandemic period and contributed to the increase in public debt, while other ASEAN peers, including Indonesia and the Philippines consolidated and lowered their debt. Thailand’s public debt is assessed to remain sustainable with low levels of foreign currency denominated debt at 1.0 percent of total debt and relatively low cost of funding (Table 2). The 10-year government bond yield declined on average in FY24 consistent with the lagging recovery, low inflation, and recent policy rate reduction (Figure 23).
Note: *average of the period, **Maturity as of November 12
Source: Public Debt Management Office, Ministry of Finance; World Bank staff calculations
Table 2: Key fiscal-responsibility indicators remain well within their established parameters
Figure 22: Public debt increased but remained sustainable
(Percent of fiscal year GDP)
Figure 23: Government bond yields remained stable
(10-Year Government Bond Yields, Percent)
Note: *includes SOEs, SFI guaranteed and agency debt
Source: PDMO, World Bank staff calculation.
Source: CEIC, World Bank staff calculation.
Box 1: Public investment and large pipeline projects of state-owned enterprises
Thailand has an opportunity to implement planned public investment in infrastructure to support the current recovery and medium-term growth while remaining fiscally sustainable.16
In the third quarter of 2024, government investment rebounded and reached THB 347.8 billion, 26.6 percent increase compared to the same quarter of the previous year. For the total nine months, government investment reached THB 806.8 billion (-2.3 percent). However, a strong recovery is projected in the fourth quarter, with disbursements expected to rise to THB 294.4 billion, a significant 59.5 percent year-on-year increase. For the full year, total government investment is expected to expand to THB 1.101 trillion (8.9 percent).
Among the 14 major state-owned enterprise (SOE) projects, with a combined investment plan of 78 billion baht (20.5 percent of the total SOE budget), disbursements reached THB 48.7 billion in the first nine months, achieving 82.5 percent of the nine-month disbursement plan
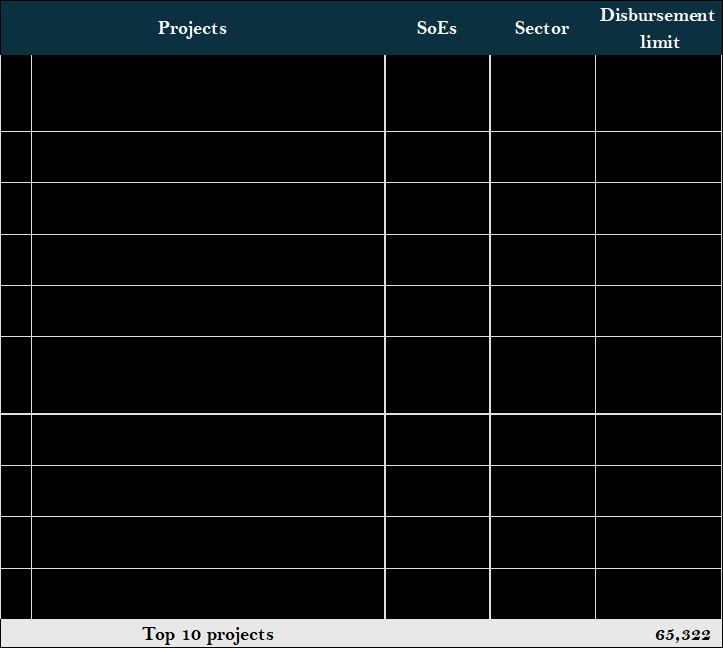
Looking ahead, the SOE investment budget for FY2025 is set at THB 378.3 billion, a 0.5 percent decrease from the previous year. Focusing on 46 SOEs, the top 10 pipeline projects spanning transportation (6 projects), energy (2 projects), commerce and services (1 project), and public utilities (1 project) will receive THB 65.3 billion, accounting for 31 percent of the investment budget of 214 billion baht. These projects are critical to improving regional connectivity and expanding household access to essential resources like water and energy.
To sustain economic recovery and medium-term growth, the government can consider:
1. Accelerating disbursements: Streamline project approval processes to ensure timely fund allocation and mitigate early-year disbursement lags.
2. Strengthening oversight: Implement rigorous monitoring frameworks for SOE projects to enhance efficiency and address bottlenecks.
3. Boosting regional development: Prioritize high-impact projects in lagging regions to reduce disparities and stimulate local economies.
4. Encouraging Public-Private Partnerships (PPPs): Leverage private sector expertise and financing to support large-scale infrastructure initiatives, particularly in energy and transportation.
Source: NESDC
Note: Investment disbursement limit is the actual amount disbursed to carry out operations according to the contract.
vii. Poverty declined in 2024, underpinned by labor market recovery and social assistance
Poverty declined in 2024, underpinned by the ongoing economic recovery and cash transfer program.
Poverty is estimated to have declined to 8.2 percent in 2024, supported by stronger economic growth and easing inflation. The one-time cash transfer to 14.6 million state welfare cardholders, implemented as part of the first round of the Digital Wallet program, was likely to have raised consumption. Based on the World Bank microsimulation model, approximately 42 percent of the population in the lowest income decile are potential beneficiaries of the cash transfer program, as they either possess a SWC and/or have a disability (see Box 2) This targeted cash transfer has likely contributed to a 3-percentage-point reduction in poverty at the upper middle-income international poverty line. Additionally, inequality is estimated to have declined by about 1.5 Gini points. However,
Table 3: Top ten state-owned enterprises investment projects (2025)
Unit: Million baht
achieving sustainable progress in the medium term will require addressing vulnerabilities to climate-related shocks, such as this year’s flooding, along with structural challenges related to demographics and labor incomes.
Box 2: Distributional impact of the targeted cash transfer to state welfare cardholders.
The initial phase of Thailand’s cash transfer program, providing a one-time benefit of 10,000 THB, was launched in October 2024. The program supported approximately14,500,000 eligible recipients, including Social Welfare Card (SWC) holders and persons with disabilities. A World Bank microsimulation model designed to evaluate the distributional impact of fiscal policies provides insights into the potential poverty and inequality effects of this cash transfer program.
The model applies the Commitment to Equity (CEQ) methodology to the 2019 Social Economic Survey (SES) conducted by the Thailand National Statistics Office (NSO). Figure 18 depicts the distribution of SWC ownership and persons with disabilities across income deciles in the SES data. It reveals that approximately 42 percent of the population in the lowest income deciles are potential beneficiaries of the cash transfer program, as they either possess an SWC, have a disability, or both. Furthermore, intended beneficiaries of the first phase are predominantly concentrated in lower income deciles, with the share of potential transfer recipients progressively decreasing at higher income levels.
The targeting criteria used in the initial phase resulted in varying levels of average benefits across income deciles Figure 19 estimates the change in per capita disposable income before and after the implementation of the 10,000 THB transfer program (adjusted to 2019 THB terms). Due to the progressive targeting observed in Figure 20, households in the bottom income decile are expected to receive an additional 321 THB per person per month in fiscal transfers, raising their disposable income by approximately 14.1 percent. In contrast, households in the top decile are projected to see a modest 0.1 percent increase in disposable income due to the cash-transfer program.
Figure 24: Coverage rate of SWC and persons with disabilities
Figure 25: Fiscal benefits before and after the cash transfer
Absolute change (left axis)
Proportional change (right axis)
Market income deciles
The significant increase in fiscal transfers to lower-income households is expected to reduce poverty and inequality in the short term. Simulations in Table 4 indicate that, in 2019, the headcount poverty rate at the $6.85 (2017 PPP) line was approximately 8 percent. If a similar cash transfer program had been implemented in 2019, the poverty rate in 2019 would have fallen to 5 percent. This suggests that the recent cash transfer program has likely contributed to a 3-percentage-point reduction in poverty at the upper middle-income international poverty line. Additionally, inequality is estimated to have declined by about 1.5 Gini points due to the program.
However, whether these reductions in poverty and gains in shared prosperity will be sustained over the medium to long term depends on households investing proceeds of the cash-transfer program towards productive activities and sustainable income-generating opportunities, rather than spending more on conspicuous items, sin goods or other such expenses.
Table 4: Poverty and inequality estimates with and without the 10,000 THB transfer
Disposable income (2019)
Box prepared by: Sutirtha Sinha Roy and Kajetan Wladyslaw Trzcinski
Disposable income (2019) + the simulated 2024 cash transfer
2. Outlook: Accelerating the Recovery
i. The economy is projected to improve but significant challenges remain Global growth is estimated to stabilize in 2025 and 2026 but remaining below prepandemic level.
In the United States, the economy is approaching a soft landing, with growth projected to slow as inflation declines gradually toward the target level over the forecast horizon. Growth is expected to stabilize at 2.7 percent in 2025 and 2026 as deceleration in the two main engines of the global economy the United States and China is expected to be offset by firming growth elsewhere, including in many emerging market and developing economies. In China, growth is projected to slow to 4.5 percent in 2025 and 4.0 percent in 2026, from 4.9 percent in 2024. The continuing challenges in the property sector combined with longer-term structural trends are expected to weigh further on activity. Excluding China, growth in EAP is projected to pick up to 4.9 this year, a further improvement from 4.8 percent in last year, supported by solid domestic demand is expected to underpin growth over the forecast horizon. Commodity prices are projected to continue easing over the forecast horizon, led by energy prices. The Brent crude oil price is projected to decline from an average of $80/bbl in 2024 to $72/bbl in 2025 and $71/bbl in 2026. The projection assumes that there is no prolonged additional escalation of ongoing armed conflicts, global economic growth remains stable, and oil supply from non-OPEC+ producers steadily expand (World Bank Commodity Markets Outlook October 2024).
The economy is set to gain momentum in 2025, driven by stronger domestic demand, while external factors will slow slightly.
In 2025, Thailand's economic growth is anticipated to accelerate to 2.9 percent, up from 2.6 percent in 2024 (Table 5). Growth will be driven by a rebound in investment, supported by higher budget execution compared to the previous year, which will also boost business sentiment (Figure 26Figure 21). Recent trends in manufacturing output suggest an expansion in production moving forward (Figure 27). However, weakness in the automotive sector may limit the recovery. Tourism and private consumption will remain key drivers, although at a slower pace. Private consumption will be supported by fiscal stimulus, including cash transfer measures, but the deleveraging cycle and stricter lending standards by commercial banks will slow consumption further. Tourism is projected to return to pre-pandemic levels by mid-2025. Goods exports are
expected to moderate slightly due to softer growth in the US and China, despite the global electronics upcycle. In 2026, growth is projected to slow to 2.7 percent, and the output level is expected to reach its potential level by 2028. Potential growth is estimated at around 2.7 percent annually, 0.5 percentage points lower than the previous decade
Table 5: Growth is projected to rebound in 2025 and continue to expand in 2026
Note: *including statistical discrepancies
Source: NESDC, Haver Analytics; World Bank staff calculations
Figure 26: Output will be supported by domestic demand and tourism
Figure 27: Manufacturing output showed smaller contraction in recent quarters (Contribution to GDP growth, Percent year-on-year) (Percent year-on-year)
Note: *including statistical discrepancy. Source: World Bank staff projections.
Source: NESDC; World Bank staff calculation
Goods export growth in 2025 is expected to moderate due to weaker demand from the US and China despite stronger growth elsewhere and the electronics upcycle.
Goods export growth is expected to moderate to 2.7 percent (nominal US dollar term) in 2025 due to softer demand from key trading partners, including the US and China. The recent contraction in the global Manufacturing Purchasing Manager Index signals a slowdown in global trade in the coming months (Figure 28). However, this slowdown will be partially offset by continued expansion in major export products, particularly electronics, and strong growth in emerging market economies, excluding China. The global electronics upcycle is expected to significantly influence Asia's export dynamics in 2025, driving robust growth in countries like South Korea, Taiwan, Japan, Malaysia, and Thailand, all key producers of electronic components (Figure 29 and Figure 30) This export expansion is likely to also support a recovery in private investment as business confidence strengthens. Inventories of computers, electronics, and electrical equipment have begun to accumulate after several quarters of depletion, while motor vehicle inventories continue to decline, reflecting contractions in production (Figure 31).
28: Global Purchasing Manager Index continued to contract
(LHS: Diffusion Index; RHS: Percent year-on-year
29: The global electronic upcycle is expected limit goods export slowdown
Source: CEIC; S&P Global; World Bank staff calculation.
Source: CEIC; World Bank staff calculation.
Figure 30: Exports of electronic and electrical products showed strong recovery…
Figure 31: ...leading to the restocking of electronics and electrical inventory (Exports of electrical and electronic products, %YoY, 3mma) (Change in goods inventory, %yoy)
Source: CEIC; World Bank staff calculation
Source: OIE; CEIC; World Bank staff calculation.
Tourism will continue to recover, although at a slower pace, while tourism promotion measures are expected to help boost growth.
The tourism recovery is expected to reach pre-pandemic levels in early 2025. In 2025, tourist arrivals are expected to surge to 41 million, surpassing the prepandemic levels, a notable increase from 35.3 million in 2024 (Figure 32). Tourist spending per person per trip has decreased significantly by 22 percent, relative to pre-pandemic levels. Recently, tourism promotion measures are expected to help growth in the sector. To boost tourist spending, the government has implemented several policies targeting high value-added, longer stay, and longhaul travelers. A new visa program which allows up to 180 days per visit –Destination Thailand Visa (DTA) – was introduced to attract digital nomads and remote workers. Applicants can also obtain the visa if they join Thailand's "soft power" activities (e.g. Muay Thai boxing, cooking and short-term education courses).17 Visa-free entry of up to 60 days was also extended to 93 countries from 57 countries previously, to include Australia, Austria, Belgium, Canada, Denmark, Finland, and France.
The current account surplus is projected to increase due to higher tourism receipts and lower shipping costs.
The current account balance is expected to increase from 2.4 percent of GDP in 2024 to 3.6 percent of GDP in 2025, driven by services trade (Figure 33). The goods trade balance is projected to decline slightly due to slower export demand from key trading partners. However, the current account will be supported by an improvement in the services trade balance, driven by increased tourism receipts and stabilized freight costs. Despite this, the current account surplus is expected to remain below pre-pandemic levels throughout the forecast period due to lower tourist spending per person per trip.
Figure 32: Tourist arrivals is forecasted to reach pre-pandemic levels by Q1 2025
(Percent of pre-pandemic level in 2019)
Figure 33: The current account balance will remain well below pre-pandemic levels
(Percent of GDP)
Inflation is expected to rise, fueled by consumption-driven fiscal stimulus, while energy prices are set to fall due to global oil price moderation and continued price controls.
In 2025, inflation is projected to increase to 0.8 percent, up from 0.4 percent in the previous year (Figure 34) Core inflation and food prices are expected to increase due to demand pressures from rising household earnings, boosted by consumption-driven fiscal stimulus and a rebound in domestic economic activity. In contrast, energy prices are projected to contract, in line with global oil price moderation and continued price controls on diesel, electricity, and cooking gas. The recent influx of cheap Chinese products, exacerbated by weakening Chinese demand and US-China trade diversion, has also exerted structural disinflationary pressure on Thai inflation, through lower imported and producer prices 18 (Figure 35The monetary stance is expected to remain cautiously accommodative
18 Bank of Thailand’s Economic Pulse (Issue No.8) https://www.bot.or.th/th/research-and-publications/research.html
Source: CEIC; World Bank staff projection.
Source: CEIC; World Bank staff projections.
in 2025, aiming to balance the promotion of eased financial conditions with limiting price pressures from recent fiscal stimulus.
Figure 34: Headline inflation is projected to remain low
Figure 35: The influx of cheap Chinese products contributed to disinflationary pressure (Percent of GDP) (imports value from China, classified by price levels, USD billion)
Source: CEIC; World Bank staff projection.
The new fiscal stimulus and planned acceleration in budget execution are expected to lead to a supportive fiscal policy stance.
Note: 1) Consumer goods include textiles, electronic appliances, furniture but does not include automobiles and mobile phone; 2) Cheap products from China reflect unit value of products from China that have lower values than average of products elsewhere
Source: Bank of Thailand’s Economic Pulse (see Issue No.8)
The general government deficit is projected to increase from 1.3 percent of GDP in FY24 to 3.1 percent in FY25 (Figure 36). This is mainly due to the acceleration in budget execution in FY25, following the delayed budget approval in FY24, and the expected rise in fiscal stimulus spending. In FY25, the government has earmarked around THB 300 billion for economic stimulation, focused on boosting consumption. This amount is part of the previously announced THB 450 billion Digital Wallet program, with THB 140 billion already disbursed to the Social Welfare Card (SWC) holders in FY24. However, the details of the measures and overall funding source under the stimulus plan for FY25 remain uncertain. Existing energy subsidies, particularly those on fuel and electricity, have been a significant fiscal burden and are often regressive, disproportionately benefiting higher-income households, and can distort market incentives, leading to inefficiencies and overconsumption. 19 By adopting targeted social assistance measures, such as those targeted at the vulnerable group (SWC holders) rather universal subsidies and transfers, Thailand can alleviate fiscal pressures, promote more efficient energy use, and better support vulnerable populations. On the revenue side, tax revenue as a percentage of GDP is expected to remain stable. This aligns with the government’s medium-term fiscal target, which forecasts increased public expenditure in FY25, leading to a higher fiscal deficit, followed by a gradual pace of normalization between FY26 and FY28 (Table 6). The public debt is projected to reach 64.8 percent in FY25, and continue to increase over the next five years, approaching the ceiling of 70 percent of GDP, with an estimated 69.3 percent of GDP in FY29 (Figure 37)
19 WB TH PRSA 2023.
Figure 36: The general government deficit is projected to widen…
Figure 37: … and public debt is projected to increase (Percent of GDP) (Percent of GDP)
Source: FPO; World Bank staff projections.
Source: IMF WEO; *World Bank staff projections.
Table 6: The Government’s Medium-Term Fiscal Forecast, Cash Basis
Note: share of GDP in parenthesis; *Public debt is based on PDMO projection; projection as of January 2025
Source: Budget Bureau; CEIC; World Bank staff calculation
ii. The outlook faces both upside and downside risks, influenced by both external and domestic factors.
External risks to Thailand’s growth include weaker global demand, trade policy uncertainty, and geopolitical tensions.
Trade policy uncertainty, fueled by Thailand's trade links with the US and China, can have both upside and downside
External risks to Thailand’s growth are tilted to the downside, driven by weakerthan-expected growth in key global economies, particularly China, and global policy shifts. A cooling US labor market and slower consumption growth could reduce demand for Thailand’s exports, dampening investment sentiment across the region. Additionally, ongoing trade policy uncertainty, including new restrictions targeting goods imported from China, heightens the risk of increased costs, lower profitability, and potential retaliatory actions, all of which could negatively affect Thailand’s economic outlook. Geopolitical risks also pose significant threats, as intensifying conflicts, particularly in the Middle East, could disrupt global commodity supplies, stoke inflation, and impact shipping costs.
Trade policy uncertainty poses a particularly significant threat given Thailand’s openness to trade and participation in global value chains. While Thailand has strategically positioned itself as a connector between the US and China, benefiting from increased imports and investment from China to support exports to the US, it remains vulnerable to shifts in global economic activity (Thai goods exports to US account for 10 percent of GDP; Thai imports from China 13 percent of GDP). A slowdown in the US, China, or EU economies could lead to weaker demand for Thai exports, dampening growth prospects. Additionally, the
impact on the economy.
The EV sector presents opportunities to attract FDI, given the country’s strong supply chain and interest from large overseas players.
influx of low-priced consumer and intermediate goods from China, while beneficial to consumers, intensifies domestic competition for Thai manufacturers, compelling them to enhance their competitiveness. Heightened global trade policy uncertainty may undermine FDI prospects for Thailand. On the other hand, Thailand may also benefit from trade diversion of US imports away from China.
As a regional auto hub, Thailand has significant opportunities to attract FDI into the electric vehicles (EVs) sector by leveraging on its well-established SMEs in the auto supply chain, government incentives for both consumption and investment 20 as well as expanding global demand. The transition to EV production requires significant investment in new technologies and processes on the part of SMEs. About 15 percent of Thai ICE automobile parts companies (by current sales values) will likely not be able to transition into EV. The parts that are directly affected are in the power train group: engine system, exhaust system, and fuel system components – which accounts for about 20 percent of the total sales values of all auto parts. In addition, 18 percent of the parts production will need to adjust their products to fit in with the EVs. However, the majority of the companies (64 percent by sales value) will be able to adapt to EV production as EVs occupy a unique product space that blends elements of both traditional automotive and modern electronics industries. Parts that do not require substantial changes are in the Body and Electrical & Electronics Groups. In addition, support to build charging infrastructure and regulations on commercial vehicle use (e.g. taxies) could accelerate EV usage.21
iii. Policies can balance near and long-term growth.
The new government has outlined key policy priorities, emphasizing a balance between immediate economic relief and long-term structural reforms.
Thailand faces the rising challenging of reconciling shortterm stimulus and fiscal sustainability.
Looking ahead to 2025, the government plans to roll out the second phase of THB10,000 stimulus targeting senior citizens aged 60 and above (4 million people), empower communities through the Village and Community Development Program, expand educational opportunities with scholarships and skill training, and provide affordable housing. Structural reforms will focus on water management, air pollution reduction, drug trafficking, monopolies, and informal businesses, with a broader vision to position Thailand as a regional hub for AI innovation and sustainability.
The potential fiscal stimulus program (Digital Wallet) is expected to provide substantial short-term stimulus to the economy in 2025, boosting consumer spending and economic activity. However, domestic risks also persist, such as elevated household debt levels and the increased risk of household insolvency, which may limit consumption growth and hence the success of the fiscal stimulus in terms of the fiscal multiplier. In such a scenario, fiscal space will lessen and may crowd-out long-term investment and further limit long-term growth. In the baseline, public debt is projected to rise close to 70 percent by 2028. Balancing
20 The purchase subsidy ranges from THB 50,000 (USD 1,397) to THB 100,000 baht (USD 2,794) per vehicle, depending on the battery size and vehicle type. To receive the subsidy, manufacturers must meet production ratios of imported to locally produced EVs. For example, in 2024, the ratio is 1:1, and in 2025, it is 1:1. Alongside the subsidy, there are excise tax reductions and duty exemptions for eligible EVs, further incentivizing both production and consumption.
21 WB Thailand Electric Mobility Adoption note (2023) and WB Thailand Economic Monitor December 2023: Thailand’s Path to Carbon Neutrality.
Promoting growth through these policies requires sufficient fiscal space, by enhancing spending efficiency and boosting revenue mobilization, to ensure fiscal sustainability.
these risks and tradeoffs will be crucial for policymakers to navigate Thailand through these uncertain times and sustain economic growth.
To ensure fiscal sustainability amid mounting spending pressures,22 Thailand must maintain sufficient fiscal space by enhancing spending efficiency and boosting revenue mobilization. Addressing these challenges requires targeted actions.
• First, reducing regressive energy subsidies (i.e. transportation, electricity, cooking gas) which contribute to the State Oil Fund deficit, by increasing targeted social assistance for low-income groups to enhance spending efficiency and inclusion (
•
•
• Figure 38). A survey of 12 middle-income countries finds that governments can build public support for subsidy reforms by showing commitment to targeted subsidies in health and education. 23
• Second, improve revenue collection. Despite improved revenue collection FY24 at 16 percent of GDP, it continues lag behind its uppermiddle-income peers (
•
•
Boosting innovation and investment, particularly for small firms, can help Thailand find new
• Figure 39). Reforms to adjust VAT rates and exemptions to increase revenue while reducing poverty by simultaneously introducing VAT rebates (See Box 3), broaden the personal income tax base, streamline generous tax incentives, expand wealth tax collection, improve tax compliance, and introduce carbon taxes could significantly bolster revenues. Addressing structural issues like high informality and low compliance will also be essential to strengthen fiscal capacity and support long-term economic resilience.
Thailand’s weak growth prospects, high household debt, and reliance on consumption underscore the urgent need to boost investment and empower SMEs and startups. With private consumption driving much of the economic activity while private investment remains below pre-1997 Asian crisis levels, the country faces structural constraints that hinder sustainable growth. To address these challenges, it is imperative to foster a more dynamic investment environment. By shifting focus towards investment and empowering smaller
22 The government’s medium-term fiscal targets indicate persistent challenges, with budget expenditures projected to remain high at 18 percent of GDP and public debt nearing the 70 percent ceiling at 68.6 percent of GDP (See table 6 in outlook section).
23 See WB Building public support for energy subsidy reforms, November 2023. https://www.worldbank.org/en/topic/poverty/publication/building-public-support-for-energy-subsidy-reforms
sources of near-and long-term growth.
enterprises, Thailand can build a more resilient and diversified economy, capable of sustaining long-term growth and reducing vulnerability to the shifting global value chains. Long-term growth ultimately rests on innovation. In this respect, Thailand can boost productivity growth by promoting SME innovation and adoption of new technologies. Another strategy to add dynamism to the economy is to have more start-ups enter high growth sectors, or sectors with potential for higher growth and higher value-added (See Part 2 on Innovation in a Changing World: Empowering SMEs and Startups).
(% of fiscal year GDP, Cash basis)
Figure 38: The State Oil Fund deficit narrowed
Figure 39: Revenue increased only marginally, despite ongoing recovery
(State Oil Fund balance, THB billion)
Source: Oil Fuel Fund Office; World Bank staff calculations
Source: Fiscal Policy Office, Ministry of Finance, NESDC.
Box 3: Revolutionizing Fiscal Policy: How Targeted VAT Rebates can Boost Revenues and Reduce Poverty
A promising new approach to fiscal policy is emerging that has the potential to help countries simultaneously increase tax revenues and reduce poverty: targeted VAT rebates. Its origins lie in four fiscal policy challenges faced by most low and lower middle-income countries.
• Struggling to collect taxes: Tax-to-GDP ratios are below the 15 percent benchmark for 86 percent of low and 43 percent of lower-middle-income countries.
• Dependence on VAT revenues: Value-added taxes typically yield twice as much revenue as income and payroll taxes in low- and middle-income countries.
• Gaps in social assistance: transfers are the primary instrument to protect the poor but cover only about half of households in the bottom quintile of the income distribution (World Bank ASPIRE 2024). Meanwhile, subsidies and tax exemptions favor higher income households.
• Fiscal policy doesn’t reduce poverty significantly or at all: Overall, fiscal policy taxes and transfers combined fails to reduce poverty and has marginal impact on inequality in most low and middle-income countries (World Bank 2022).
According to the International Monetary Fund (IMF)’s estimates of c-efficiency ratios, lowand middle-income countries collect only between 40 and 60 percent of what they could potentially mobilize due to evasion and exemptions. To address evasion, more than a dozen countries have implemented VAT rebates. The idea is to provide consumers with an incentive to prove that tax has been paid on goods and services they purchase, thereby making it more difficult for firms to underreport their sales. Using this “Consumers as Tax Auditors” approach, Brazil posted net revenue gains (Naritomi, 2019). Similarly, Mongolia’s rebate system produced positive results as consumers demanded receipts from retailers to receive rebates.
Much of the gap between VAT potential and actual collection is due to exemptions intended to protect the poor. For instance, the average Latin American country loses a whopping 1.6 percent of GDP due to VAT exemptions. However, as in the case of energy subsidies, there is overwhelming evidence that most of the benefits of these exemptions accrue to higher-income households, making them ineffective in protecting the poor.
By combining VAT rebates with social protection delivery systems, targeted VAT rebates aim to return taxes to individuals from poorer households instead of providing VAT exemptions. Simulations for low- and middle-income countries from various regions have shown that even with moderate targeting accuracy (even quasi-universal transfers), eliminating exemptions and channeling the proceeds to households through cash transfers can significantly reduce poverty.
Targeted VAT rebates have already been implemented in a few Latin American countries. Bolivia has provided a rebate for low-income individuals since 2021. Argentina rebated 100 percent of VAT payments on basic goods to low-income pensioners and social assistance beneficiaries until the program ended in 2024. In 2021, the state of Rio Grande, Brazil, introduced a targeted rebate that reversed the regressivity of the VAT while increasing VAT compliance (Tonetto et al. 2023). New legislation is underway to expand the targeted rebate nationally to Bolsa Familia beneficiaries. This approach may also be useful for expanding social insurance coverage. Globally, payroll-taxfinanced social insurance has failed to cover informal workers, exposing them to idiosyncratic risks and old age poverty. In contrast, with the rapid growth of digital payments and mobile money, consumption has become easier to track than incomes part of the reason for the increasing reliance on VAT revenues. In 2019, Thailand used the targeted VAT rebate for both social assistance and pensions, returning 5 of the 7 percent VAT tax paid by low-income individuals to their e-wallets and allocating 1 percent to pension accounts. In 2023, the Costa Rican government submitted the “Ley de Pension Basada en el Consumo” or “Consumption based pension law” which, if passed, would channel two percentage points of VAT into individual pension accounts.
Not all countries are ready to implement targeted VAT rebates. It requires a robust identification system with near-universal coverage, electronic invoicing linked to the identifier, and a digital payments mechanism connected to a bank account. Legislation and technology that minimize personal data protection threats are also important. And crucially, it requires a strong social protection delivery system effectively targeting the bottom part of the income distribution.
With the right investments, many countries could put these building blocks in place quickly. The lessons from the pandemic have already motivated some governments to improve their digital public infrastructure (DPI) and their Social Protection delivery systems to handle future crises, including climate-related shocks. The Philippines, for example, fast-tracked its national ID program and improving its SP delivery system in the wake of the COVID-19 experience.
The win-win solution of consumption-based financing of social protection combined with higher tax revenues is a powerful argument for making these investments.
This Box was prepared by Robert J. Palacios, Lead Specialist in the Social Protection and Jobs Global Practice.
Part 2. Innovation in a Changing World: Empowering SMEs and Startups
Introduction
Investing more and better in innovation24 will be key for Thailand to move to high income status by 2037, as envisioned by the Government. Promoting innovation will help to improve productivity among its firms25, while also helping to address challenges such as the effects of climate change and mitigate some of the risks of geopolitical conflicts.
Productivity should be at the center of the policy agenda in Thailand. Economic research has consistently shown that a country’s ability to raise its standard of living over time depends almost entirely on its ability to raise its output per worker. This chapter26 provides an overview of how innovation policy and programs can help Thailand improve productivity, allowing the country to raise the standard of living of its population.
24 This chapter takes a broad definition of innovation, defined as any introduction of a new product, service or solution that contributes to a real and positive impact for people and firms. It means that good ideas do not stay in an academic paper, or in a drawing, but they actually get implemented, with tangible results. This “newness” does not necessarily need to refer to the world, but it can mean, for example, the introduction of new manufacturing equipment to a firm (first time in Thailand, or in the sector or in the firm), or the digitalization of certain functions. All of this counts, as long as it is something the firm was not doing before.
25 Firm productivity is understood to be how efficient firms are in turning inputs into outputs. That is, how much production of goods or delivery of services can a firm do with a given amount of labor and capital (this is usually referred to as total factor productivity). Labor productivity only looks at labor inputs, that is, how many employees contributed to the production of a given amount of goods or services. We also refer to labor productivity as output per worker. We use both measures of productivity in this note, based on availability of data.
26 This note summarizes the main findings from the WB’s Thailand Innovation Policy Effectiveness Review.
Context and Background
Thailand experienced strong economic growth between 1980 and 1996. Since then, growth has slowed.
Thailand is now faced with the challenge of escaping the “middleincome trap”.
Capital accumulation and an export-led growth model allowed Thailand to grow at an average rate of 7.7 percent from 1980 to 1996. This period saw a labor shift from agriculture to manufacturing, a structural economic transformation that enabled Thailand to rapidly converge with upper middle-income comparator countries while achieving important gains in poverty reduction. The three major global crises that came after that period significantly changed the country’s longrun economic trajectory, with the annual economic growth rate falling to 4.8 percent for the period 1998-2008 and falling further to 3.3 percent between 2008 and 2018. A big contributor to this slowdown in economic growth has been the decrease in productivity growth, with total factor productivity (TFP) growth going from 3.0 percent27 between 1999 and 2008 to an average of 1.4 percent between 2009 and 201728
Based on the experience of other countries that have successfully overcome that challenge, increasing innovation will be key to achieving that goal29. Moreover, the country is now faced with new global threats: the real and already present effects of climate change, and the evolving consequences of geopolitical conflicts that affect, among other things, key global value chains where the country has built a lot of its success, as well as FDI flows in general.
29 World Bank. 2024. World Development Report 2024: The Middle-Income Trap. Washington, DC: World Bank. doi:10.1596/978-1-4648-2078-6
Figure 40: GDP growth composition comparison by physical capital, human capital and TFP (%)
Source: World Development Indicators (WDI), World Bank staff estimates
Productivity growth drives economic growth and better paying jobs.
Increasing firm productivity has been a driving force for the development of many countries around the world30. When firms become more productive, they add more value to the economy through their products and services. As firms increase the value they add to the economy (and their revenue), they can then increase the wages paid to their workers. And since the private sector is the main source of employment creation in an economy, productivity growth finally means growing firms that lead to wage increases and better paying jobs. In short, increasing firm productivity is key for the economic development of a country.
Drivers of Productivity Growth
There are three key channels contributing to productivity growth: “withinfirm”, “between-firm” and dynamic growth.
The literature on productivity generally distinguishes three channels contributing to productivity growth (Cusolito & Maloney 2018). The first channel involves increasing firms’ capabilities and how this affects productivity growth. This includes capabilities such as technological advancements, organizational practices, and innovation. We can think of this channel as looking at what the management of firms can do, what is mostly under their control to improve productivity. The second channel looks at how issues largely outside of the firm’s control, such as access to finance and unfair competition, affect the reallocation of resources towards more productive firms. And the third channel, known as the dynamic channel, relies on both the extent of market selection (enabling "creative destruction") and the capabilities of new entrants. This channel emphasizes the impact of market forces on productivity, as less efficient firms exit the market while more productive firms enter, leading to an overall increase in aggregate productivity.
Source: World Bank Innovation, Productivity, Growth and Resilience
Innovation can help increase productivity, and ultimately, growth.
Whether a firm introduces a new product or service that adds more value than their last product, or it introduces a new equipment that increases the efficiency of their manufacturing process (by reducing losses, for example), these are all ways whereby innovation will help increase the overall productivity of the firm:
30 Cusolito, Ana Paula, and William F. Maloney. 2018. Productivity Revisited: Shifting Paradigms in Analysis and Policy. Washington, DC: World Bank. doi:10.1596/978-1-4648- 1334-4. License: Creative Commons Attribution CC BY 3.0 IGO.
Figure 41: Drivers of Productivity Growth
either by increasing the value of the output or decreasing the value of the cost to produce. And consistently increasing firm productivity over long periods of times will ultimately lead to the transition from middle income to high income status that Thailand aspires to 31 Innovation also adds resilience: the COVID19 pandemic clearly showed how more resilient were firms that had digitalized some or all of their services. Green innovation can also help increase resilience and position firms to more fully benefit from the changing context of global value chains (GVCs) and the evolving requirements of developed nations regarding sourcing with minimal environmental footprint. For some firms, adopting greener production processes will be the only way to continue participating in GVCs (see box 4 on green innovation)
Thailand’s performance in terms of firm innovation and technology adoption is presented next, before an overview of the current support system is addressed.
Within Firm: innovation and technology adoption among Thai firms
Overall, Thailand has made a significant effort to increase R&D spending in the last decade.
Concentration of private R&D in only a few firms is a concern
R&D expenditures as a share of GDP have grown significantly, reaching 1.33 percent of GDP in 2020, from an average of 0.23 percent of GDP between 1999 to 2009. The number of researchers in R&D per capita is also high: in 2021, the country had 1,699 researchers per million inhabitants, higher than the average of upper middle-income countries, which stood at 1,327.
Despite Thailand’s relatively good performance in terms of aggregate R&D intensity, a detailed analysis shows that investments in private R&D remain concentrated in only a few firms. While the share of private R&D over total R&D expenditure has been increasing (reaching as much as 74 percent of gross expenditure in R&D in 2021)32, these R&D investments remain very skewed. The number of private businesses investing in R&D activities is low (2.9 percent in 2016), lower than in peer and other middle-income countries. Data for R&D expenditures across establishments in 2016, also suggests a very concentrated R&D activity in a handful of firms. In other words, the vast majority of Thai firms (97 percent) do not conduct any R&D, with only about 1 percent of them conducting most of the private R&D. This limits broader gains in productivity that can come from investments in innovation by a larger group of companies, especially among SMEs.
Micro-level data confirms that firms in Thailand are less likely to introduce innovation than peer countries.
Thai establishments are less likely to introduce product and process innovations than peer countries (including through licensing of foreign technology) and severely underperform in relation to their income level (Figure 42). (Figure 43) also shows benchmarking with other countries in East Asia and the Pacific regarding intangible capital formation. The results show that firms in Thailand do make use of industrial designs and are able to achieve ISO quality certifications more than their peer countries, but lag in the registration of trademarks and patents
31 World Bank. 2024. World Development Report 2024: The Middle-Income Trap. Washington, DC: World Bank. doi:10.1596/978-1-4648-2078-6.
32 The United Nations Conference on Trade and Development (UNCTAD 2017) estimated that the business sector contributed 45 percent to total R&D in 2009. More recently, some reports indicate that business expenditure in R&D (BERD) contributed as much as 74 percent of gross expenditure in R&D (GERD) in 2021 (NRCT, 2023).
Figure 42: Share of firms that engage in innovation activities (%)
(% of firms)
Source: World Bank Enterprise Surveys
Note: The year of data available varies by country. Data for Malaysia, Vietnam, Indonesia, and the Philippines is from 2015, and data for Thailand is from 2016.
Figure 43: Selected intangible capital formation metrics, 2022
Source: ISO; WIPO; WDI
Note: The data for ISO quality certificates, industrial designs and trademarks are from 2022 and are expressed as a percentage of firms. The data on patents is from 2023 and is presented as the absolute number.
Entry and Exit: creative destruction in Thailand
The importance of the churnfor innovation. In addition to the importance of having existing firms innovate and adopt new technologies, the entry of new, innovative firms, and the exit of uncompetitive ones is a crucial process (the churn) to achieve higher rates of productivity growth. Firms with new products and services and novel ways of doing business need to come in, be nurtured and be given the right conditions to develop and grow. This usually also requires ensuring that incumbents do not abuse of their market power and impede the entry or the growth of new enterprises33
Thailand needs to incentivize more entrepreneurs to start businesses, especially digital ones.
While firm entry performance is comparable to some regional peers (Figure 44), it lags significantly when compared to peers in other regions. This is even more pronounced for the entry of new digital businesses (Figure 45). Given the importance of digital services to increase productivity not only for the services sector but for manufacturing, this gap in performance in the digital sector should cause particular concern.
33 World Bank. 2024. World Development Report 2024: The Middle-Income Trap. Washington, DC: World Bank. doi:10.1596/978-1-4648-2078-6.
Figure 44: New Business Registration aged 15-64
Figure 45: Formation of New Digital Businesses (Per 1,000 people, 2022) (% of digital business with headquarter in the country of comparison)
Source: WDI
Note: Due to availability of data, the year of data varies by country. Data for Malaysia, Philippines, Singapore, Thailand, Vietnam is from 2022; data for Brunei Darussalam, Cambodia, Lao PDR, Upper middle-income countries and EAP countries is from 2020.
Source: World Bank Digital Business Database (based on CB insights and Pitchbook)
FDI can play a significant role in innovation.
Foreign companies can also be another important conduit for the entry of new ideas, technologies and management processes. Spillover effects from FDI are an important way for local firms to innovate and become more productive. FDI flows in Thailand have lagged those of its peers (Chapter 1,
Figure 46Figure 32). Until 2022, Thailand’s rate of investment was lower than those of regional and structural peers, suggesting potential uncompetitive entry regulations, especially when compared to some of its peers.
46: Change in Foreign Direct Investment Regulatory Restrictiveness Index
(FDI Restrictiveness Index)
Source: OECD FDI Regulatory Restrictiveness Index
Note: 1=more restrictive; 0=less restrictive
Figure
Box 4: Green innovation: climate change as both a challenge and an opportunity for Thai firms
Climate change affects Thailand, and Thai firms in particular Thai firms are highly vulnerable to a wide range of climate hazards, including floods, cyclones, landslides, droughts, and extreme heat. These can cause and have caused already significant damages to assets, disrupting supply chains, customers, financial institutions, and infrastructure34. Regional climate variations add complexity due to the resulting differences in climate change impacts across the country. Rapid urbanization, particularly in cities like Bangkok, has sharply increased the vulnerability of densely populated areas to climate-related risks, amplifying the potential for damage and disruption. Estimates project the intensity of these risks to grow over the next decades.
But where there are risks, there are also opportunities.
Climate change also offers opportunities for firms to develop and implement innovations that can help in mitigation and adaptation. New products, services, and ways of doing things will be needed to address the effects of climate change, while changing weather patterns also can create new business opportunities (such as new cultivation areas that open up due to changing climate conditions). Similarly, the financial sector will need to support the private sector's transition to the new climate reality. It can do so by helping firms finance its green transition, develop and scale new technologies, and manage physical and transition risks (Didier et al., 2022).
Businesses will need to address the impacts of these climate change events while also helping the country to transition to a low-carbon economy. After the 2011 floods, for example, the private sector implemented various measures to protect against future floods. The Industrial Estate Authority of Thailand updated its design criteria for prevention measures: drainage improvements, raising flood barriers, and installing water monitoring and warning systems. Some food and beverage companies conducted climate risk scenario assessments to identify potential risks such as flooding or water shortages at their operating plants. On the other hand, as contributors to environmental damage and climate change, businesses also have a responsibility and key role in reducing CO2 emissions and biodiversity loss.
Green innovation and adaptation to stay globally competitive. The shift towards a low-carbon global economy brings with it changing consumer preferences demanding sustainable products and services and government policies promoting environmentally friendly growth. Thailand’s trade openness means that for the country to remain competitive in global value chains, Thai companies will need to revamp their business models and build a reputation for sustainability. According to a 2021 report by Standard Chartered, 78 percent of multinational companies aim to stop doing business with suppliers who don't take adequate steps to reduce their carbon footprint by 2025. International trading partners are imposing requirements on the emissions of their imports, such as the European Union's Cross Border Adjustment Mechanism. Western consumers are pushing multinational companies to minimize deforestation, plastic waste, and other environmental impacts within their supply chains. These consumers are also willing to pay a premium for products certified as environmentally friendly. As a result, around US$1.6 trillion worth of global production could potentially be relocated annually.
How is Thailand doing on green innovation?
Assessing green innovation in Thailand is challenging due to a lack of direct data. Data is currently unavailable to measure R&D investments in green innovation and climate technology, training, investments in enterprise systems for energy efficiency, licensing for green and climate technology, and investments in innovative climate change adaptation techniques. Proxies can be used, however, including financial transactions related to debt and equity investments in green, climate, and clean technologies. Exports of low-carbon technology products, complemented with emissions metrics, can be used to assess outcomes in terms of green innovation. The data available shows that Thai firms are not investing as much as they should on climate adaptation (especially when compared to some of its peers) and have an opportunity to increase exports of lowcarbon technologies.
Debt financing remains unexplored and a potential source of green financing. Thailand has a robust debt market, but it is relatively shallow for green issuances compared to its regional peers. Acknowledging that not all these investments financed by green debt can be classified as innovation and climate technology, it can provide a rough idea of how Thailand ranks versus regional peers. Thailand presents an average gap of 63 percent below the market depth of peer countries when it comes to green debt as a share of GDP. Non-financial
corporations in Thailand, on the other hand, have been active investors and issuers in green debt markets, second only to the Philippines (as a share of GDP), while government entities have been notably absent and well below the predicted average for green debt issuance.
Figure 47: Green debt Total Amount Outstanding as share of GDP, 2021
Source: Unleashing Sustainable Finance in Southeast Asia, 2022
Figure 48: Government Green Debt Outstanding as share of GDP, 2021
Source: Unleashing Sustainable Finance in Southeast Asia, 2022
Thailand showed one of the lowest levels of private equity financing for projects in climate and clean technology35 compared to peers. The transactions for the ASEAN-5 group were relatively low during the period 2017-2021 (and particularly low for Thailand), totaling US$265 million, representing about 0.57 percent of total private equity financing in these countries or about 0.01 percent of GDP.
Figure 49: Value of Private Equity Investments in Climate and Clean Technologies, 2017-2021
Source: Unleashing Sustainable Finance in Southeast Asia, 2022
Figure 50: No. of Unique Firms with Private Equity Funding 2017-2021
Source:
Energy efficiency among Thai firms can be improved. Thailand showed the lowest ratio of industrial value added to industrial energy consumption across selected countries in 2021. This points to a significant opportunity to push Thai industry to increase their energy efficiency, also providing openings for Thai firms to provide solutions to improve this performance, from financial products to digital (potentially AI driven) systems that can optimize energy consumption in industrial operations, among others.
34 The floods in 2011 caused an estimated 12.6 percent of GDP in overall damages.
35 These technologies include de-carbonization technologies and processes and clean technologies, which seek to reduce the environmental impact of human activities or significantly reduce the number of natural resources consumed through such activities.
Unleashing Sustainable Finance in Southeast Asia, 2022
Figure 51: Exports of low-carbon technology products as a share of total exports, 2022.
Source: IMF Climate Change Indicators Dashboard, 2023
Figure 52: Value Added Relative to Energy Consumption in Industry Sector, Selected Countries 2021 US$ / (TJ)
Source: International Energy Agency (IEA) and WDI, 2022
The Role of Thai Government in Supporting Green Innovation
Governments play an important role in nurturing and supporting green innovation Governments can lay the foundations for green innovation and the adoption of green technology36 by enhancing investments in education and skills for green products and technologies, directing research incentives towards applied green R&D projects, facilitating access to information and finance for the adoption of green technologies by SMEs, and promoting innovative business models like Energy Service Companies to bridge the information and financing gaps.
Government support for green innovation in Thailand will need to be adjusted. While the amount of resources being allocated to green and climate objectives has increased, the majority of these funds are allocated to mitigation rather than adaptation. In fiscal year 2022, approximately 16-17 percent of the total budget disbursement, around 3.86 billion THB, was allocated to green and climate objectives. Based on a portfolio mapping exercise conducted by the WB, Thailand's STI policy mix presents gaps in climate adaptation. Of 341 STI instruments profiled in 2022, 62 addressed the green agenda, including climate change and the environment. Specifically, 33 instruments target climate change and the environment, 23 target only climate change mitigation, and six focus solely on climate change adaptation, with 2.19 billion THB of the budget being spent on climate mitigation, and 1.65 billion THB on climate change adaptation. This distribution suggests that the Thai government remains focused on supporting innovation for climate change mitigation over climate adaptation37
Need to emphasize the demand for green innovation. Most of the budget for green innovation and climate technology initiatives is still allocated to research institutes, government agencies, higher education institutions, and researchers, with limited involvement from the private sector as beneficiaries of green initiatives. Notably absent is the use of policy instruments that promote non-R&D-based innovation, such as
36 Innovations for climate change mitigation include: improved recycling, energy-efficient lighting, and thermal insulation for buildings, innovative production processes that reuse waste, advancements in agriculture such as genetically modified crops and mechanical irrigation, cleaner energy supply from sources like wind, solar, and hydropower, climate-friendly cement, carbon capture and storage (CCS), and support for sustainable production of plants and livestock. Innovations for climate adaptation include climate-resistant products and processes suitable for changing environments, higher yield seeds for arid and saline soils, and tools for understanding and protecting against climate risks, such as improved early-warning systems.
37 For example, despite being at high risk of climate-related impacts like drought and flooding, only 10 percent of Thailand’s green innovation and climate technology expenditures are dedicated to water management, biodiversity conservation, and soil restoration
vouchers for innovation, innovation finance de-risking facilities, including partial credit guarantees, and earlystage support programs for startups with new green technologies.
Green innovation in Thailand: a good start, and a clear agenda for the next phase. Thailand has advanced in prioritizing green innovation. However, stronger participation of the private sector is needed as both beneficiaries of these programs, and as parties engaged in the prioritization of policies and resources, to ensure government programs are addressing the main constraints for firms to adopt and develop green technologies. Using the financial sector to advance a green innovation and climate technology agenda will continue to be crucial and will require bringing together for this type of financing credit rating systems, a sound insolvency framework, collateral registries, standards, and financial taxonomy for green innovation investments.
Box 5 6: Upgrading Thailand’s Global Value Chain: The Role of Innovation and Services
Thailand's economy has achieved significant progress in manufacturing but continues to face challenges in advancing to higher-value stages within the global value chain (GVC). As nations ascend towards highincome status, innovation becomes the primary driver of GVC participation, typically achieved through serviceintensive sectors or advanced manufacturing deeply integrated with services like R&D, logistics, and data analytics. New technologies, including robotics, cloud computing, artificial intelligence, 3D printing, and the Internet of Things, require robust service inputs that enhance production and innovation. By embracing these advance technologies, manufacturers can improve their production processes, reduce costs, and stay competitive in an increasingly fast-paced global market. In Thailand, only 15 percent of exporting firms operate in the top complexity quartile, indicating the possible lack of innovation and inability to upgrade functions in the value chain (World Bank CPSD, 2020). SMEs have a lower degree of engagement in both backward and forward GVC participation.
The COVID-19 pandemic, however, has highlighted Thailand’s lagging position high-technology exports, while many Asian peers have successfully capitalized on technology-intensive growth in electronics and telecommunications (Figure 33). Asian economies, particularly China, Korea, and Vietnam, captured significant growth in ICT and electronic component exports, contributing to Asia’s 75% share of global ICT exports by 2020. Thailand, however, concentrated on computer peripherals, a segment facing declining global demand. In the electric vehicle (EV) sector, Asia emerged as a global leader, yet Thailand played a minimal role. With exports in this fast-growing sector largely dominated by China and Korea, Thailand’s contribution remained modest, accounting for only 3% of Asia’s total E-mobility exports (Figure 34).
SMEs are crucial to Thailand's economic growth, but their low innovation and limited participation in global value chains highlight untapped potential SMEs, which account for 99.5 percent of firms in Thailand, 69.5 percent of national employment, and 35.3 percent of overall GDP, are a major asset in reigniting economic growth However, Thai SMEs have shown one of the lowest incidences of innovation among ASEAN peers, with the lowest proportion of firms introducing product or process innovation. Thailand SMEs' participation in international trade and global value chains (GVCs), both as direct and indirect exporters, is also lower than that of its peers (World Bank Thailand SME Program Review, 202338). In 2018, only 5 percent of all registered firms engaged in exports compared to the regional average of above 11 percent (WDI). This highlights the importance of focusing on SME innovation
SMEs in Thailand face three main challenges in moving up to innovative global value chain, due to limited access to innovation financing, inadequate skills for the future, and regulatory barriers to growth and skill acquisition. The innovation finance landscape is shallow, with venture capital funding at only 0.03 percent of GDP, leaving SMEs underserved by mechanisms like the Market for Alternative Investments (MAI), crowdfunding, and venture capital, which larger firms are better positioned to access. Additionally, Thailand lags regional peers in high-skilled labor availability, and the weak Technical and Vocational Education and Training (TVET) system disproportionately impacts SMEs, which lack the resources to invest in workforce development compared to larger firms. Furthermore, restrictive regulations, such as rules that set minimum capital requirements for hiring of expatriates and the minimum wages to be paid to them, further constrain SMEs' ability to attract talent and compete with large firms and dominant e-commerce platforms.
Advancing into sophisticated GVCs requires fostering advanced skills, attracting FDI, enhancing infrastructure, and pursuing deep integration agreements to drive innovation and policy reforms. According to the World Bank Development Report on Trade, countries can move into sophisticated GVCs through policies that build advanced skills, forge deep trade agreements, and foster advanced ICT services. Attracting foreign direct investment (FDI) remains essential for gaining access to capital, technology, and management expertise. Thailand could also benefit from infrastructure enhancements in transport and communications to overcome geographical limitations. Building a skilled workforce for R&D, while encouraging the inflow of foreign talent, can stimulate innovation. Additionally, deep integration agreements,
paired with technical and financial assistance, could drive institutional and policy reforms that further integrate Thailand into complex GVCs.
In Thailand, declining service intensity in manufacturing exports and reliance in imported services indicate that domestic service capacity has remained limited. Post-pandemic, Thailand holds potential to chart a more inclusive growth trajectory by engaging in innovative and high-value GVC activities that depend on services. For instance, Thailand’s electronics and automotive sectors already show relatively high service intensity, yet are constrained by restrictive trade policies, particularly regarding foreign expertise. From 2008 to 2018, Thailand’s overall service intensity remained comparable to regional peers, but while other countries increased service integration, Thailand’s share has declined (
Figure 53). In sectors like electronics and motor vehicles, the reliance on imported services rather than domestic inputs underscores Thailand’s limited domestic service capacity. Between 2016 and 2018, foreign services accounted for more than half of total service intensity in exports of electronics, motor vehicles, and other transport equipment. This capacity gap could be addressed by short-term service imports, but high trade restrictions on skilled professionals continue to hinder progress.
Thailand must enhance service integration by addressing trade restrictions that limit service intensity in key sectors, as well as easing FDI restrictions and improving domestic service capacity to reduce reliance on imported services in high-value GVC activities. Opening Thailand’s service sectors and easing FDI restrictions could attract investment flows, boost GVC participation, and facilitate knowledge transfer. Currently, Thailand's services trade restrictiveness index (STRI) ranks the second highest in ASEAN after Indonesia, particularly the restriction in professional, scientific, technical, and land transport services, and to a lesser extent, in financial services (Figure 36). Reducing STRI could make Thailand a more attractive destination for skilled foreign professionals, a critical factor in upgrading its GVC role. Long-term skill development will also require targeted education policies and science and technology (S&T) initiatives. Examples of successful services liberalization in ASEAN highlight how the combination of private sector initiative and government support can increase service output and exports (for example, Singapore: financial services; Malaysia: higher education; the Philippines: telecommunications-based services). Unlocking service trade contribution in selected sectors can increase the efficiency of production and size of export markets.
Furthermore, improvements in Thailand's regulatory environment could significantly attract FDI inflows. An OECD study found that reducing FDI restrictions by around 10 percent could raise bilateral FDI by an average of 2.1 percent. For Thailand, aligning FDI regulations to the standards of regional peers like Malaysia could boost foreign investment by approximately 10.8 percent, supporting its climb up the global value chain.
Conclusion
Thailand’s path to higher-value GVC participation lies in its capacity to integrate innovative services and attract global expertise. By embracing policies that promote service development, reduce FDI restrictions, and build domestic skills, Thailand can create a dynamic, innovation-driven economy better positioned in the global marketplace.
a) Share in manufactured exports is lower than peers. (% of total manufactured exports)
b) The gap remains large in Thailand. (% of total manufactured exports)
c) Asia takes a lion’s share of the global exports of tech-intensive E-mobility. (Exprts share of global battery (E-mobility) exports, by country, %, 2020)
Source:WB analysis
Note:a) and b) data: UN Comtrade, (1) Key Competitors include Vietnam, Malaysia, India and Mexico, (2) Frontier markets include South Korea and Singapore; The gap is calculated from the distance of high-tech exports share of Thailand compared with the average of comparators; The results are shown in the percentage of GDP; The negative gap implies the lower share of high-tech exports, relative to peers; The classification of high-tech intensity product groups is based on SITC code which follows the World Bank WDI calculation c) data: Trademap based on HScode, see Fazekas, Dóra, Cambridge Econometrics
Figure 54 Box 5 Services value-added in exports and service restrictiveness index
a) Services Value-Added in Manufacturing Exports. (% of Total Manufacturing Exports)
Source:WB analysis, data: OECD
b) Service Trade Restrictiveness Index (All Sector Average) (0 = Complete openness to trade and investment, 1 = Completely closed to foreign services providers)
Explaining Thailand’s Innovation Performance
Several complementary factors must be in place to enable innovation.
Innovation requires skilled labor to implement new processes and produce new products. The more sophisticated that production is, the more intensive use of skilled labor to complement lower-skilled labor can be. Maloney and Caicedo (2022) describe the important role of engineers in economic development by allowing production of increasingly complex products and technologies. Innovation requires that innovative projects and new innovative ventures be financed. Promising ideas need funding to scale, and many firms in developing countries lack access to finance. Finally, an enabling environment for innovation requires competitive markets that encourage innovation, entry of innovative and disruptive startups, regulations that do not discourage foreign direct investment (FDI) and promote transfer of knowledge, and an intellectual property framework that encourages the creation and use of knowledge.
Thailand Indonesia Malaysia Singapore Viet Nam
Skills, regulations and access to finance are important barriers for firms to innovate in Thailand.
i. Skills
Higher-level technical knowledge plays a significant role in innovation and productivity
Past analysis conducted by the World Bank has identified three main issues that are important constraints to further innovation among existing firms and to the entry and growth of new, innovative companies.
Developing labor force skills in science, technology, engineering, and mathematics spur innovation and productivity In Thailand, firms that spend more of their operating budget on R&D and have a larger share of skilled labor have significantly higher total factor productivity growth than those that spend less. Overall, human capital development in Thailand is around the level predicted for their level of development. Research output at the university level is relatively high (Figure 37 and Figure 56) and the percentage of university graduates in science and engineering in Thailand also ranks slightly above peers39
technical journal articles, 2019
Source: World Development Indicators, World Bank Group Source: SCImago
Note: H-index is a quality metric based on the citations of published papers; the formula is based on the number of papers that have been cited and how often, compared with those have not been cited
However, more in depth analysis suggests that the readiness of the labor force and researchers for more technology and innovation driven
The Global Innovation Index 2024 assessed Human Capital and Research as a weakness for Thailand, while an assessment of Frontier Technology Readiness also identifies skills and R&D as areas to be addressed (Figure 57). More specifically, the composition of the labor force is still tilted toward middle-tolow level skills (Figure 40), and the availability of several disruptive technology skills is lower than in more-advanced countries (Figure 59). Innovation requires significant skill levels, but most youth and adults in Thailand have low foundational literacy and digital skills (ASAT 2023). Consequently, employers
39 At 31.7 percent, it ranks 14th in the latest WIPO’s Global Innovation Index (out of 133 countries). However, it is worth noting that in tertiary enrollment the country ranks significantly lower, with only 49 percent enrollment, and ranking of 71 among the 133 economies surveyed.
Figure 55: Scientific and
(number of total articles)
Figure 56: H-Index, 2023 (H-Index)
activities may be a concern.
struggle to find skilled workers domestically and highlight a lack of critical thinking and soft skills among candidates, key for innovation. Past workforce policies restricting hiring of foreign workers exacerbated this scarcity of skilled labor (WEF 2019). Recent efforts to introduce reforms to attract skilled labor are welcome and should be reviewed carefully for possible scaling and expansion40 .
Figure 57: Human capital and research, 2024
Source: Global Innovation Index 2024
Source: ILOStat
Source: UNCTAD calculations, based on data retrieved from ITU, M-Lab, UNDP, ILO, Scopus, Patseer, World Bank, and UNCTAD.
40 Global Digital Talent Visa, as reported in Saffa. A. (2024). Thailand’s AI Strategy: Cultivating Talent and Supporting Start-ups. OpenGov.Asia. https://opengovasia.com/2024/09/03/thailands-ai-strategy-cultivating-talentand-supporting-start-ups/
Figure 58: Share of Employment According to Skill Level and Country, 2019 (% of labor force)
Figure 59: Penetration of Thailand’s Disruptive Technology Skills Relative to OECD Average (percentages)
Source: World Bank LinkedIn Data for Development
Figure 60: Indicators of Global Competitiveness and Frontier Technology Readiness Scores, 2021
Note: 1=perfect score.
Index Description: Index includes technological capacities related to physical investment, human capital and technological effort, and covers national capacities to use, adopt and adapt these technologies:
Use: This requires basic capacities, passive skills, and effort along with infrastructure, and some technological knowledge. This might involve, for example, following Artificial Intelligence (AI)-driven recommendation from an e-commerce website or using a chatbot.
Adopt: Active use for one’s own purposes requires more advanced capability levels. This could mean using AI to produce recommendations or run a chatbot for a business website
ii. Regulations
Regulations for firm entry and exit are less onerous in Thailand than in other peer upper middle-income countries.
Limited competition and an uneven playing field constrain the emergence of an innovative private sector.
Thailand’s quality of the regulatory frameworks for starting and winding down a business seems to be better than many of its peer countries41, but there is evidence that SME tax incentives stimulate firms to remain small (Banternghansa et al. 2021). While entry of new entrepreneurs may not be such a constraint, growth of their enterprises may be hampered by tax regulations.
Essential for innovation, competitive forces are notably feeble in Thailand and are restricted by distortive policies. Competitive pressures stimulate firms to innovate and upgrade their technology, inputs, management practices, and products. Thailand has one of the lowest scores on product market competition and regulatory quality indicators among peers (Figure 61 and Figure 62Figure 43). Despite recent improvements, it has notable regulatory gaps on promotion of competition (Figure 63Figure 44 and Figure 64).
Note: Score is based on the state of unfair competitive practices, price controls, discriminatory tariffs, excessive protections, and discriminatory taxes.
41 Policy Effectiveness Review of Science, Technology, and Innovation Policy in Thailand, World Bank (2024).
Figure 61: Product Market Score, 2019
Figure 62: Regulatory Quality Score, 2021
Source: WEF; WDI
Source: EIU; WDI
63: Market-Based Competition and Competition Law and Enforcement
Source: Country Private Sector Diagnostics, 2022
Note: For market-based competition, higher value = better competition-enabling environment. For anti-monopoly policy, higher value = stronger policy in police.
The 2017 Competition Act was implemented to address shortcomings of its predecessor and increase competitiveness
64: Extent of Market Dominance
Source: Authors’ elaboration based on data from the World Economic Forum's Global Competitiveness Report (GCR), World Economic Forum, 2018-2019.
Note: 1 = lowest dominance; 7 = highest dominance
It included reestablishing the Trade Competition Commission as an independent regulatory agency, setting merger-control thresholds, barring anticompetitive agreements, and limiting exemptions, although key challenges remain, including the need to clarify the legal treatment of state-owned enterprises, address price controls and other quasi-fiscal policy interventions, and encouraging reporting of cartel behavior. Enforcing the act will be critical for promoting domestic competition. The act addresses many key factors, such as governance of the competition agency, merger control thresholds, anticompetitive agreements, and exemptions. However, it remains to be implemented
Access to credit is key for innovation. Thailand has the highest score (among comparator countries) on the International Monetary Fund Financial Development Index, which assesses the depth, access, and efficiency of financial institutions (Figure 65
Figure
Figure
Figure 46). World Bank studies have shown that Thai firms are less likely to list access to credit as a major constraint42
Figure 65: International Monetary Fund Financial Development Index, 2021
Source: International Monetary Fund Financial Development Index Access to finance enables innovation, but Thai SMEs struggle to obtain credit.
Firms in Thailand are more likely than in most peer countries to introduce a process or product innovation upon accessing a line of credit or loan43 However, given the duality of the Thai private sector and the high levels of collateralization, MSMEs still face tighter credit constraints (World Bank 2022). Thai MSMEs have limited access to bank loans, are more likely to be rejected for a loan, and use more of their own resources to finance investment than regional peers (Figure 66).
42 Policy Effectiveness Review of Science, Technology, and Innovation Policy in Thailand, World Bank (2024).
43 Ibid.
This funding gap does not apply only to innovation among incumbents, but also to early-stage financing.
The amount of venture capital in Thailand is low (0.14 percent of GDP). There is a significant funding gap for early-stage and venture capital more generally. Expanded access to innovation financing can enable scaling up firms with new business models and technology. One explanation for this lack of morespecialized finance for innovation is related to existing restrictions on entry of financial services44 This gap in financing discourages the entry of firms, limits the growth of the ones that do enter markets, and ultimately leads to less dynamism in the economy
Addressing these constraints: a review of Government innovation policy and support programs
Innovation policy and programs can support firms to innovate and become more productive
Innovation policy and programs can address these key constraints previously identified that limit the extent to which firms innovate. Some examples include:
1. Direct financial support to offset risks of investing in new technology (grants and tax incentives)
2. Technical assistance/information, to help companies better understand the cost and benefits of investing in innovation and technology, and how to implement these types of projects.
3. Support to the enabling environment, which can address many issues ranging from regulations to incentives for technology adoption, training of skilled workforce that can lead and implement innovation and technology adoption projects, business environment type of regulations to ensure competition and the entry of new innovative firms, regulations that push academia to collaborate with industry on R&D programs, intellectual property regulations and implementation that can provide incentives for firms and individuals to innovate.
Implementing innovation policy is challenging and requires coordination
Innovation policy is complex and requires ongoing adaptive management to the local context (Andrews et al. 2013). Multiple ministries, line departments, and other authorities are responsible for the implementation of innovation policy, making it challenging to define a single “owner” of the policy and requiring
44 Policy Effectiveness Review of Science, Technology, and Innovation Policy in Thailand, World Bank (2024).
Figure 66: Access to Finance in Thailand and Selected Comparators, Percentage of Respondents
Figure 67: Size of Venture Capital Funding in Southeast Asia, US$ billion, 2019
Source: World Bank Enterprise Survey, 2016
Source: SEA venture capital landscape 2020, White Star Capital
amongst several ministries and agencies.
Thailand has taken steps to unify innovation policy planning and coordination.
complementarities between policies and institutions. For example, investments in innovation require other foundational policies in place, especially an enabling environment for investing in innovation that includes competition and reducing regulatory bottlenecks, policies to address the development of skills, programs to promote access to finance, as well as investments in enabling infrastructure. Responsibility for these policies and programs are usually dispersed in many ministries and agencies. In addition, once innovation policies have been agreed, they typically must be sustained for several years before results are achieved. Finally, innovation outcomes are often difficult to measure.
Acknowledging these challenges, the Thai government has taken steps to unify innovation policy planning and coordination under a national strategy and the National Higher Education, Science, Research and Innovation Policy Council (Policy Council).The 2019 reform established the Ministry of Higher Education, Science, Research, and Innovation (MHESI), which began serving as the top government agency in the SRI system, with oversight over agencies and research institutions involved in SRI and with NXPO now overseeing Thailand's STI system, coordinating numerous agencies and research institution. TSRI has the responsibilities of formulating strategic policies, coordinating with various stakeholders, and allocating funds for research and innovation initiatives, ensuring that resources are directed towards projects aligned with national priorities.
Nevertheless, implementation of this reform is still incomplete and faces challenges.
A Policy Effectiveness Review was conducted to help address these challenges.
Three key gaps in support areas were identified: deficient support for tech adoption and innovation, lack of early stage infrastructure support and gaps in risk financing
Implementing agencies often have different incentives than founding agencies and ministries, and these incentives can be difficult to align. As a result, there may be insufficient participation and commitment from key actors in the policy and planning process. In addition, pervasive asymmetry of information regarding the policy mix creates confusion in responsibilities and generates duplication of roles between principals and implementing agencies. Finally, the heterogeneous quality of implementation protocols has led to inconsistency in the application of the law and the 2019 reform at the subnational level. Challenges in human capital arising from incentive problems in managing staff and career path development lead to high turnover of personnel, understaffing of technical professionals, and lack of qualifications or knowledge to implement these programs.
To help address these challenges, TSRI requested that the World Bank review Thailand’s innovation policy. The first phase of this review focused on assessing the composition of innovation policies the policy mix. The review also looked at budget allocations, consistency of this allocation and programs objectives and the overall country goals for STI, as well as identifying initial gaps in coverage of innovation programs and instruments.
These include deficient support for the adoption of technologies and innovation by firms; under-support for early-stage innovative ventures; and to a lesser extent, a lack of support for the development of knowledge-intensive services. These are important gaps that partially help explain the weak performance of Thai firms in product and process innovation. The policy portfolio review also showed a lack of support to early-stage infrastructure (incubators and accelerators) and early-stage finance, which can explain the loss of business dynamism, the low density of digital firms and the diminished presence of disruptive startups. Finally, although the SRI strategy emphasizes the
Some rationalization of instruments and implementation units is merited.
Thailand needs to move from a supplyside driven innovation support to a more demand-driven approach.
importance of the creative sector and knowledge-intensive sectors, the allocation of budget reveals gaps in targeting efforts to these sectors.
The presence of many instruments and several implementing agencies involved in innovation policy also suggests that some rationalization is needed. Although analysis of redundancies found only a few overlaps across instruments, the existence of many implementing units (and 341 instruments in 2022) increases the costs of implementing innovation policies without clear advantages. A consolidation of implementation units could bring significant efficiency gains and impact, given the increased public management focus. These efficiency gains could also free up resources to increase more competitive hiring of staff and institutional learning.
Additional main conclusions from the analysis point to a need to move from a supply-side driven innovation support to a more demand-driven approach, with greater participation and leadership of private sector in R&D projects with universities and research centers. Several recommendations also point to the need to move to more evidence-based policies, which will require, among other things, more and better data, as well as the implementation of better targeting and monitor and evaluation systems.
Conclusion and Policy Recommendations
Increasing productivity through innovation: Thailand’s next challenge.
Thailand has come a long way in the past 50 years and has built a strong and well diversified economy. Its next challenge is to increase the productivity of its firms, especially SMEs, and allow for new ones to come in with new ideas. The focus should be on supporting SMEs to adopt technologies to make them more productive and resilient, while encouraging others to create new solutions (products, services or business models). These will be important to help solve the most pressing problems and improve the quality of life of Thais and take advantage of new business opportunities to generate more wealth and employment.
Support SME modernization and upgrading.
Leverage Thailand’s role in GVCs to increase innovation and productivity.
Modernizing and upgrading SMEs can mean many things, depending on the sector where these SMEs operate. However, two technologies in particular should be the focus of most if not all sectors: digital and climate technologies. Current programs should be reviewed to ensure that a strong focus is given to this upgrading. Expanding outreach of these programs will be important: every SME should know that these programs exist, what they support and how to apply for them. At the same time, managers and employees will need to increase their capacity to implement and manage these innovations.
Thailand has played an important role in GVCs, yet it has been unable to move up to more sophisticated, higher value-added and more innovative parts of GVCs. As countries move toward high-income status, innovation becomes the main determinant of GVC participation, and services play a key role. Services are becoming increasingly important to firm productivity due to its complementarity with manufacturing, criticality in the global value chain, and rising tradability given technological advances. Services trade restrictiveness is among the highest with respect to professional, scientific, and technical
Bring more and make the most out of FDI.
activities and land transport services and to a lesser extent also financial activities service. Regulations on professional services such as legal, engineering, and accounting, are particularly stringent in Thailand and need to be revised. Foreign lawyers cannot practice Thai law or appear in court, accountants must be Thai nationals to register as CPAs, and engineers and architects face stringent licensing requirements, limiting their participation in infrastructure projects
To fully leverage Thailand’s insertion into GVC, the country will need to continue to ease FDI restrictions, especially for the services sector. In addition, a more pro-active use of instruments that create linkages to global value chains and Foreign Direct Investment (FDI) should be pursued: Open innovation challenge instruments, and supplier linkage and development programs are examples of potential opportunities to fully leverage GVCs for innovation and productivity in Thailand.
Bring in new business models and products and services.
Thailand will need to see more new businesses created. The current level of growth entrepreneurship is low when compared to regional comparators. A concerted effort will need to be made to create the conditions for more support infrastructure, including incubators and accelerators. There is likely a need for public support for more incubation programs, within a framework that follows international best practices (professionally run, competitive selection of beneficiaries, time-bound, structured programs of incubation). But technical support will need to be complemented with financing. The notable gaps in financing will need to be reviewed, to ensure availability of financing to startups at various stages of development (ideation, prototyping, go to market, scaling up). This should include an evaluation of current regulations around risk financing, such as Venture Capital, given its relative low levels vis-à-vis regional competitors. Finally, successful entrepreneurs should be celebrated, to provide role models for the next wave of entrepreneurs.
From supply to demand driven R&D.
Improve R&D support instruments
Thailand will need to increase the impact of its spending in R&D, especially measured in terms of social and economic development impacts. A big change will be needed to move R&D from a supply driven to a demand driven effort. This means making research more connected to industry needs by promoting industry-academia research consortia projects that are led by the private sector, and not the other way around. Recent regulatory changes will certainly help to promote technology transfer from universities and research centers by clarifying the utilization of intellectual property derived from publicly funded research projects45. This review and upgrade of regulations and incentives that affect higher education institutions should be extended, to ensure that researchers and professors that would like to engage in commercialization and entrepreneurship efforts are not only allowed to but also incentivized to do so.
Government programs that support R&D need to be reassessed, to ensure that more SMEs are supported to introduce product or process innovation. Universities and research centers may play a role in this, but it will be important
45Thailand Research and Innovation Utilization Promotion Act B.E. 2564 (2021) and Regulations of the Office of the Prime Minister on Public-Private Joint Investment in Projects that Utilize Research and Innovation Results B.E. 2565 (2023).
Innovation requires a concerted effort.
to facilitate the interface between SMEs and these institutions, as neither of them is used to interacting with each other. Moreover R&D tax incentives need to be simplified, increasing their predictability and alignment with international best practices. Finally, improving Monitoring and Evaluation efforts to enhance effectiveness of these interventions is essential, to optimize resource allocation amongst competing programs. More and better data is required for this, as well as standardization of program procedures, among others.
Ensuring that government programs that directly promote innovation among SMEs and start-ups are well-targeted, designed, advertised and follow other international best practices as discussed above is the first step. However, for innovation to happen at scale, several other complementary factors will need to be prioritized.
More high-tech skills. The development of skills is one of them. Here Thailand needs to especially focus on developing more high-tech skills, including digital and creative skills. While broad system-wide efforts are needed, it will also be important to be specific and targeted, linking at least some of these initiatives to specific highgrowth sector needs, maintaining close coordination and communication with private sector to adjust and evolve the curriculum needed as technologies develop. And when needed, these initiatives must be complemented with targeted talent attraction to fill skills gaps that are already present and will continue to occur in the short to medium term.
Box 6: Samsung SW Academy for Youth (SSAFY) – the private sector contributing to upgrading skills in South Korea.
Launched in 2018 as part of Samsung Group’s corporate social responsibility program, Samsung SW Academy for Youth (SSAFY) aims to equip young software developers with workplace-ready skills, enhancing their employment prospects. The academy selects two cohorts of students each year and provides training at its five campuses in Korea. Over the course of one year, participants undergo 1,600 hours of intensive training, including daily sessions and collaborative projects among students. The training is free of charge, and each student receives a monthly stipend of KRW 1 million (~US$ 690).
To date, SSAFY has provided training opportunities to approximately 11,000 young individuals. Among the 8,000 graduates from the first 10 cohorts, approximately 84 percent have secured jobs at 1,700 companies, including Samsung Electronics, Coupang, LG Uplus, Hyundai Mobis and startups.
SSAFY has also partnered with other companies to train young software developers in specific sectors, helping to address software skills shortages. For instance, since 2023, Korea’s five major banks (Shinhan, KB Kookmin, Hana, Woori and NH NongHyup) have pledged a total of KRW 5 billion to SSAFY to collaborate on improving fintech software skills.
Source: World Bank interviews with SSAFY program managers.
Competition and trade. If economic sectors are uncompetitive and dominated by a few incumbents, the pressure to innovate decreases. Likewise, if the entry of new innovative startups is discouraged, healthy competition to innovate is suppressed. Therefore, the group of champions that is looking to increase innovation in Thailand will necessarily need to increase competition in some key markets, to create pressure to innovate and allow disruptors to come in. This needs to be directly connected
Coordination
to efforts at promoting innovative start-ups and SMEs in growth sectors. They are not separate efforts. Some specific recommendations include46:
- Reform opaque licensing criteria: Lack of clear and objective rules for granting licenses to foreign firms in automobile and life insurance creates uncertainty and discourages foreign participation in essential business services.
- Relax Foreign Ownership Restrictions: review foreign ownership limitations in various service industries to attract foreign investment, which can lead to increased competition and greater technology transfer and improved service quality. These include:
o Telecommunications: Foreign-owned companies can only provide services on a re-sale basis, restricting competition and technological advancements.
o Education and Healthcare: Foreign entities cannot own education and healthcare facilities, limiting investment and expertise in these critical sectors.
o Banking: Foreign ownership in “local banks” is restricted, preventing greater financial sector competition and innovation.
o Retail: A minimum capital requirement of 100 million baht is imposed on foreign subsidiaries, making market entry difficult.
Finally, it is not enough to have an SME upgrading program in place, if companies cannot procure the goods and services that can help them modernize, at reasonable and competitive costs. If the technology already exists in the world, there is no need to reinvent the wheel. Thailand should facilitate the acquisition and absorption of technology, as South Korea did so successfully during the 1970s and 1980s47 .
The final element of a concerted effort to promote innovation is the coordination. As it is clear from the different policies and factors that affect innovation that have been highlighted here, coordination of these efforts is key. Promotion of start-ups needs to be done in tandem to ensuring fair competition and entry to targeted growth sectors, while skills development will be essential to staff these growing and more technologically sophisticated enterprises. The left hand not only needs to know what the right hand is doing, they actually need to move together. And while essential, the need for this coordination is not restricted to the public sector. Frequent and open communication and coordination of actions is needed with the universities and research institutes and with the private sector. Thailand needs to take this challenge on as a country, not only as a government.
46 For more details on these recommendations, see World Bank. 2020. Thailand Manufacturing Firm Productivity Report. Bangkok: World Bank
47 Soh, Hoon Sahib, Youngsun Koh, and Anwar Aridi (eds.). 2023. Innovative Korea: Leveraging Innovation and Technology for Development. Washington, DC: World Bank.