Index Report 2025
Market cap & Industry sectors


The Application Programming Interface (API), is a web-based software application which allows clients to access our data in a controlled manner & integrate it using their own software packages & systems.
• Download real time SRP data directly to excel
• Receive market share on each asset class/payoff for each company of interest
• Monitor & increase your market share
• Carry out accurate trend analysis with comprenhensive product data spanning over 15 years in seconds
• Import data directly into in-house systems/platforms and interrogate the data and risk more effectively
• Combine data sets with other products and visualise it in the context of the larger business
Indexing remains a driver of activity and innovation as well as issuance and sales in the global structured products market.
In this report we look at the market dynamics and trends around the main types of indices based on SRP’s classification –Market Cap & Sector, ESG, Decrement & Thematic, and Strategy & Factor Indices.
The SRP Market cap/Industry sector is the first of four chapters comprising the SRP Index Report 2025 which other chapters to be released throughout the year.
The SRP Market cap/Industry sector Index Report aims to show the landscape and evolution of products linked to this kind of indices over the last two years providing insight on issuance and sales activity as well as league tables around these index categories in the structured products market.
The report also includes input and views from senior executives across the value chain as well a global overview of market activities and highlights from the main suppliers of Market cap & Industry sector indices to the structured products market, according to SRP data.
ll
Disclaimer: While SRP’s aim is to provide accurate and up-to-date information, the data provided is gathered from third parties. SRP does not take responsibility for the accuracy of the data and will not be held liable for any errors or omissions contained in the information provided. The information and data included on SRP’s market reports uses sources believed to be reliable. SRP assumes no liability or responsibility for the quality, content, accuracy or completeness of the information, text, graphics, links and any other items contained on this report.
Editorial: Amelie Labbé, Pablo Conde, Summer Wang, Marc Wolterink, Jocelyn Yang
Production: Paul Pancham
Marketing: Paul Chapman
Sales: Tom Fletcher
Front cover image: Bigc Studio AdobeStock
If you are interested in having a similar bespoke report produced for your organisation, please contact: Tom Fletcher E: tom.fletcher@derivia.com
Market cap indices under SRP’s classification follow market standards and include indices that provide exposure to the equity markets of a specific country or region and comprise securities fulfilling pre-defined market capitalisation requirements. The market cap sector comprises 108 indices featured in the structured products market over the last three years – since January 2022 - in ‘not-flow’ products.
The global market for equity index-linked structured products, including single indices and index baskets, showed a steady decline between 2022 and 2024.
In absolute terms, the market size decreased from approximately US$196 billion in 2022 to US$182 billion in 2024, reflecting a fall of seven percent over the period, according to SRP data (as of 30 January 2025).
The market share for equity index-linked products out of the total asset class mix also decreased significantly. Having captured 20% of the market in 2022 it stayed relatively stable in 2023 at 19% before dropping to 14% in 2024, suggesting a reduced demand for equity index-linked products in favour of single stock names and other asset classes.
Products linked to market cap indices, which held a 79% share from the equity index-linked universe in 2022, gradually dropped to 74% in 2024, with their sales volumes decreasing from US$154 billion to US$135 billion, indicating a significant fall.
The industry sector benchmark category initially grew from 3.3% in 2022 to 5.0% in 2023, before dropping slightly to 3.8% in 2024, while its sales volumes increased sharply from US$5.77 billion to US$8.92 billion in 2023 and remained stable in 2024.
Conversely, industry sector indices with decrement saw a notable decline, with market share falling from 3.6% in 2022 to just 2.3% in 2024, and its absolute value shrinking drastically from US$7 billion in 2022 to only US$4.2 billion in 2024.
These trends suggest a shift in investment preferences, with a reduction in market cap index-linked products and a steep decline in industry sector products with decrements, while industry sector benchmarks have shown resilience. The number of products linked to a single market cap index increased from 20,292 in 2022 to 21,473 in 2024. Meanwhile, the total sales volumes decreased from US$97 billion in 2022 to US$81 billion in 2024.
The average sales volume per product dropped from US$4.8m in 2022 to US$4.2m in 2024, indicating lower transaction sizes despite a relatively stable number of products. This suggests a market shift where more products were available in 2023, but overall demand weakened by 2024. Looking at sales by region, the distribution of sales volumes linked to single market cap indices has shifted significantly from 2022 to 2024.
The Americas strengthened its position as the dominant region using benchmarks to link structured products to, rising one percentage point between 2022 and 2023 (from 43% to 44%) before jumping to 51% in 2024. Europe, Middle East & Africa (Emea) also expanded its market share, growing from 22% in 2022 to 27% in both 2023 and 2024.
In contrast, Asia Pacific (Apac) experienced a notable decline in the use of benchmarks. The region saw usage fall from 35% in 2022 to 29% in 2023 and then to just 21% in 2024. This highlights a growing concentration of market cap index-linked products usage in the Americas and Emea, while Apac’s relative importance has decreased over time.
In terms of geographic exposure, indices tracking American companies maintained the largest share, remaining stable at 45% in 2022 and 2023 before increasing to 49% in 2024. Indices offering exposure to European companies grew on a relative basis from 21% in 2022 to 27% in 2024.
Meanwhile, exposure to Apac indices saw a significant decline, dropping from 34% in 2022 to just 22% in 2024.
World exposure and World ex-North America remained consistently low at one percent across the period analysed. This suggests a growing concentration of geographic exposure in the Americas and Emea, while Apac’s relevance has diminished.
S&P Dow Jones Indices remained the dominant player in the market cap index category, maintaining a stable share of around 40%, mostly on the back of sales invested in structures linked to its S&P 500 benchmark, and, to a lesser extent the S&P/TSX 60 Index and the S&P/ASX 200 Index.
China Securities Index (CSI), however, saw a sharp decline from 28% in 2022 to just 14% in 2024, indicating reduced demand for its indices. This was most notable in the Chinese market where sales for products linked to its CSI Smallcap 500 were down 55% between 2022 and 2024. Meanwhile, volumes for products tied to the CSI 1000 index fell from an estimated US$8.6 billion in 2023 to US$1.6 billion in 2024 – a decrease of more than 80% year-on-year (YoY) while sales for products on the CSI 300 index fell from US$4.5 billion in 2022 to a meagre 667m in 2024.
In contrast, STOXX experienced steady growth, increasing from 16% in 2022 to 23% in 2024, driven by solid demand for products linked to its flagship Eurostoxx 50 benchmark, not only in European markets such as Switzerland, Germany and Italy, but also in the US and South Korea.
FTSE Russell also gained traction, doubling its share from five percent in 2022-2023 to 10% in 2024 – boosted by the continued strong interest in products linked to the FTSE 100 in the UK and the Russell 2000 in the US.
The Korea Exchange (KRX) expanded from four percent to seven percent over the same period – an increase that was down almost exclusively to the performance of products linked to its Kospi 200 index in the local market. Nasdaq remained stable at two percent, while MSCI saw a modest increase from one percent to two percent. These trends highlight a growing preference for STOXX and FTSE Russell indices, alongside the sustained dominance of S&P Dow Jones.
The top five market cap indices collectively accounted for 86% of the market in 2024 (2023: 78%; 2022: 84%).
The S&P 500 remained the most dominant index, holding a stable share of 38% within the market cap category in 20222023 before slightly increasing to 39% in 2024.
In the US market alone, products linked to the S&P 500 on its own gathered sales of around US$31 billion in 2024, slightly down from US$32.5 billion and US$32.2 billion in 2022 and 2023, respectively. A further US$36 billion was collected from 11,250 products that included the S&P 500 as part of the underlying equity-index basket in 2024 – a significant increase from US$22 billion (from 8,500 products) and US$20 billion that was collected in the US market during 2023 and 2022, respectively.
Apart from the US market, the S&P 500 also had a strong presence in Switzerland (7,200 products in 2024) and South Korea (5,650), where it was mostly used in worst-of barrier reverse convertible/autocall products.
The Eurostoxx 50 experienced steady growth, rising from 16% in 2022 to 22% in 2024. The European benchmark achieved its highest sales in the US market, where sales spiked at
US$13.9 billion in 2024, up from US$8.3 billion in 2023 and US$7.5 billion in 2022. Within Europe, volumes were less pronounced with sales in the French market down 33% YoY: from US$8.5 billion in 2023 to US$5.7 billion in 2024.
In contrast, CSI Smallcap 500, which tracks the performance of 500 small-cap companies listed in China, saw a significant decline, dropping from 23% in 2022 to just 11% in 2024.
The Russell 2000 and Kospi 200 both gained traction, each expanding from 2-4% in 2022-2023 to 7.0% in 2024, reflecting growing interest in US small-cap and South Korean equities. The former accumulated a whopping US$52 billion from just under 16k products in the US market in 2024, most of which was invested in products linked to a worst of index basket (US$40 billion). By comparison, sales for Russell 2000-linked products reached US$29 billion in 2023 and US$24 billion in 2022.
The Kospi 200 was another index highly utilised in its domestic market, with all but 20 of the 6,100 products it was linked to in 2024 sold in the Korean market.
Despite the dominance of traditional market cap weighting, the evolution of indexing shows a shift towards new strategies that could change this dynamic.
There has been an expansion beyond traditional market cap weighted indices as indices that were originally conceived as benchmarks to represent markets don’t necessarily offer the optimal way to invest in markets.
Over time, there has been increased academic and realworld understanding of different ways to invest, as well as technological advances enabling alternatives to market cap weighting.

Managing director,
UK
Hilbert Investment Solutions
“Core options beyond market cap weighting, such as factor tilts like size, value, dividends, and quality, have strong academic and real-world evidence supporting their efficacy,” said Chris Taylor, managing director, UK, Hilbert Investment Solutions.
“Equal weighting is seen as a simple but important alternative and complement to market cap weighting. Clearly, the performance of both weighting methodologies can be cyclical, and there are therefore diversification benefits to including exposure to both in portfolios.”
Notably, there has also been a growing recognition of and interest in alternative index providers, offering innovative and cost-effective options, in addition to the dominant incumbent index providers, according to Taylor.
“Importantly, in respect of structured products, customisation of indices can optimise the payoff and outcome for the end investor, not just the underlying index itself,” he said, adding that “ensuring investment integrity and transparency is crucial when introducing new customised or alternative index strategies, to ensure they are developed for the right reasons, underpinned by the right research and presented properly and understood by advisers and investors.”
The key, according to Taylor, is providing a diverse set of index options to allow for effective portfolio construction
and diversification, rather than relying solely on and limited portfolios to only market cap weighted indices.
Chris Taylor: There are several merits and benefits underpinning use of equal weight indices. Market cap weighting can lead to increased concentration risk, as the largest stocks in the index become an ever-larger portion of the overall index, as a result of ‘momentum’ as share prices increase. Equal weighting avoids this concentration risk, providing more balanced exposure across the index constituents.
In fact, equal weighting provides perfect diversification at the stock level, as each stock in the index is weighted equally at each rebalancing. You cannot diversify a 500-stock index better than with equal weighting, where each stock has a 0.2% weight, or a 100-stock index better than 100 x 1% weights.
Equal weighting also provides an element of size and value factor tilts. When the index is rebalanced, outperforming stocks are sold back down to their equal weight, and underperforming stocks are bought back up to their equal weight, creating at least an element of a value tilt. Equal weighting also results in a tilt towards smaller companies in the index. In the FTSE 100, for example, when market cap weighted, the bottom 10 stocks in the index typically only account for c.2.5-3.5% of the overall index, but when equally weighted they account for 10% in total, exactly the same as the top 10 stocks.
Performance of market cap weighted, and equally weighted indices clearly differs in the short term and can be cyclical, with each outperforming / underperforming at different times. Recognising this inclusion of both market cap and equal weighting index strategies is an important option for effective portfolio construction, diversification and risk management.
Chris Taylor: The shift towards customisation has brought the debate about complexity back to the market with many industry practitioners noting that investors in structured products invest in the product and payoff, not just the underlying index. Customisation of the index can be used to improve the payoff and
outcome for the investor. This can usually be in respect of one or more of three fundamental aspects: increasing potential returns; making the conditions for generating positive returns more defensive; and providing more protection at maturity.
It’s crucial that the customisation and optimisation of underlying indices is based on and driven by robust investment research and transparency. Issuers and product providers must have the right intentions and motivations, not just focusing on headline rates. Importantly, regulations, including the Consumer Duty, impose a regulatory expectation in respect of consumer understanding, which is a particularly pertinent consideration when it comes to any new or non-mainstream offerings.
Collateral materials and explanations provided to professional advisors must be sufficient to give them a robust understanding of the proposition, so that they and their clients can make informed decisions. The consideration should be from a portfolio construction and diversification perspective, not just a standalone product perspective. How the customized index strategy fits into and complements the overall portfolio is an important factor.
Chris Taylor: The availability of custom indices will continue to expand, but it is critical that it is for the right reasons and
Resources
Industrial Goods & Services
Media Other
with the right approach. While there will be a plethora of custom index offerings, only a relatively small number will prove to be sufficiently credible, stand the test of time and develop a strong support base.
There is growing interest in alternative index providers. Notably, these new providers can offer both innovative options as well as more cost-effective alternatives. In the current low-return environment, saving costs at any part of the investment food chain is important and the ability of new index providers to offer cheaper licensing costs can feed through to improved terms for investors.
At FTSE Russell, Gerald Toledano, global head of equity and multi-asset, is looking at more overlay strategies using rolling futures indices as a parent instead of the equivalent cash index version.
These strategies include risk control, leveraged indices based on momentum/volatility signals and decrements. Our rolling futures offering includes FTSE 100 and FTSE MIB, as well as Russell 2000 and FTSE/JSE Top 40. The latter two were launched in 2024.
We are also looking to develop a multi-asset series in 2025, combining our flagships with their respective market treasury Futures. In the digital asset space, Eurex recently launched Futures on two of our flagship indices: FTSE Bitcoin Index and FTSE Ethereum Index. Options have also been launched using these futures as an underlying asset.
Gerald Toledano: Last year, we saw multiple overlay strategies applied to FTSE Russell flagships (FTSE 100, FTSE MIB, Russell 2000), sector indices derived from our Global Equity Index Series (GEIS) as well as expanding our single stock decrement index series offering and service –there are currently over 170 stocks across 11 markets.
The launch of our Russell 2000 Futures Indices in 2024 was well received.

Tim Edwards
Global head of index investment strategy
S&P Dow Jones Indices (S&P DJI)
S&PDJI continues to see great appetite for indices that are built upon the S&P 500, but that incorporate additional features such as high volatility targets, decrements, and/or intraday rebalancing, according to Tim Edwards, global head of index investment strategy at S&P Dow Jones Indices (S&P DJI)
The examples of recent index innovation for the structured product market include the S&P 500 Futures Defined Volatility Index Series and the S&P 500 Futures Edge Volatility Index Series, he said.
Tim Edwards: In Q1 2024, S&P DJI started calculating and administering the S&P 500 RavenPack AI Index, offered in both structured products and fixed index annuities, as a successor to the Credit Suisse RavenPack AI Index launched in 2017.
The index is systematically designed to measure exposure to sectors of the U.S. economy with stronger sentiment based on a news analytics algorithm powered by RavenPack. Working on an index like this has opened the doors to consider how other artificial intelligence (AI) data sets may be used to develop next generation solutions for the market.
Tim Edwards: More generally, we are having a range of conversations with third-parties on how the combination of our index data and their nuanced AI data may be able to create new, compelling solutions.
We’ve harnessed AI in the design of indices for almost a decade leveraging internal natural language processing and machine learning capabilities, but it’s a particularly exciting time right now.
For example, we recently expanded our lineup of Global Kensho indices to include the S&P Kensho Artificial Intelligence Enablers & Adopters Index, and the similar S&P Kensho Global Artificial Intelligence Enablers Screened Index (which adds sustainability criteria), measure the performance of companies at the forefront of artificial intelligence technology, infrastructure and services.
These indices were created and launched together with our investment bank partners in Europe, and these – as well as other examples such as the S&P Kensho Global Future Defence Index and the S&P Kensho Global Cyber Security Screened Index, demonstrate our ability to address emerging themes and reinforce our commitment to delivering innovative investment solutions that meet the evolving needs of the market.
At CITIC CLSA traditional market cap indices are losing traction as they are no longer enough to respond to investor needs.
Despite the dominance of market cap indices, the market has witnessed a significant shift to customised index baskets and strategies in recent years on the backdrop of frequent macroeconomic disruptions and geopolitical dynamics, according to Julie He, head of equity derivatives structuring at CITIC CLSA based in Hong Kong SAR.
“The potential for a prolonged high-interest-rate environment for the US dollar further complicates investment decisions, as it impacts both currency valuations and asset prices,” she said. “In such a multifaceted context, traditional market cap indices may no longer suffice to meet the diverse and evolving needs of investors.”
Julie He: While customised baskets and strategies tended to be considered sophisticated investment
tools targeted towards large institutional investors in the past, such popularity has seen a “notable rise” to a broader range of investors, ranging from highnet-worth individuals to family offices and smaller institutional players.
Compared to conventional large-cap indices, customised baskets and strategies offer a more agile and responsive approach to capture short-term and long-term market trends. This flexibility provides the potential for achieving excess returns that might not be attainable through conventional indices.
Julie He: As investors have become more sophisticated, there is an increasing demand for customised investment tools that allow for a nuanced expression of market views and insights.
Leveraging these bespoke strategies enables investors to engage more proactively in the investment process, taking advantage of opportunities to express their market outlook in a more targeted and precise manner.
From the sell-side perspective, the demand for traditional market cap and industry sector indices is increasingly complemented by a growing interest in customised strategies. This trend reflects a broader shift towards more sophisticated and flexible investment approaches that are better suited to navigating the complexities of today’s market environment.
The role of customised baskets and strategies likely to continue expanding, which will result in new opportunities for innovation and value creation in the structured products market.
Although market cap indices were never designed to be underlying for this type of investment product, they have maintained their appeal due to their liquidity and simplicity, which allows for competitive pricing and coupons, according to Stephane Mattatia, global head of thematic indexes and derivatives licensing, MSCI.
“Standard indexes are also used as a starting point to develop and showcase the performance of complex algorithms which can then be deployed via more sophisticated products,” he said.
“This is seen as an advantage, as the product mechanics can be easier to explain when starting from simple, wellunderstood indexes.”
Stephane Mattatia: The index landscape has remained dynamic and maintained its primary focus on market cap and sector indexes over the last two years.
Clients often prefer to offer coupons or returns on these well-known indexes, as it is easier to communicate and understand compared to more complex or customized indexes. The liquidity and simplicity of these indices allow for sharp pricing and quick implementation.
Market cap indices are also particularly valuable in quick-turnaround scenarios where clients need to provide a solution rapidly – as seen with autocalls which have driven sales of market cap indexes even higher.
However, there is a growing interest in adding overlays to traditional market cap indexes. We have seen in Europe with ESG, as investors seek to incorporate sustainability considerations into their portfolios, as well as risk control in the US annuities market.
Stephane Mattatia: There are regional differences when it comes to preferences around specific index overlays.
Europe has seen a rapid adoption of ESG overlays, and clients are quick to incorporate ESG considerations into their index exposures. In contrast, the US has been more cautious in embracing ESG overlays, with the regulator and investors requiring more detailed explanations and justifications.
Conversely, the US market has been more receptive to risk control overlays, which have evolved significantly over time, while Europe has been slower to adopt these more sophisticated strategies.
The US market’s familiarity with risk control overlays has allowed for more advanced iterations, while Europe has focused on more basic risk control approaches initially. These biases are largely driven by the historical development and maturity of the respective markets.
This dynamic will continue as investors in different markets become more accustomed to various index strategies and their underlying complexities. The pace of adoption of new index strategies is influenced by the level of market maturity and investor comfort with the specific index features.
For index providers it is important to understand regional nuances and tailor index solutions to meet the unique preferences and needs of investors in different markets.
UK-based distributor IDAD as most buyside providers prefer well-known benchmark indices - which are mostly market cap weighted, as they are recognisable by and understandable by clients, and they are widely quoted, but this does not mean there is no room for non-market cap exposures.
“There has always been some activity in non-market cap indices, but this is not always client-led,” said Bevan Goulden, professional & institutional solutions at IDAD.
“Risk control indices are typically used in the context of fund-linked products. We would be open to risk control on benchmark indices for the traditional capital-protected (i.e. zero + call) products but I don’t see this as a major or particularly likely development in our markets.
“Instead, this is often manufacturer-led and often combined with synthetic dividend/decrement features.”
Bevan Goulden: There is now increasing client-led demand for specific non-market cap indices in the US because of decreasing market breadth, for example the S&P 500 Equal Weighted (SPW) is being seen increasingly as a “mainstream” index and is widely quoted.
That said, the Dow Jones Industrial Average is not a market cap weight index either, so demand for non-market cap exposure is not a new thing.
For an index to be considered a true benchmark, it needs to be widely recognised and used outside of the specific structured product market where it is being applied. The UK market appears to have a stronger preference for familiar benchmarks over custom indexes.
In Asia, equity-linked structured products market remains predominantly a single stock structure in broader regional markets, particularly in Hong Kong and Singapore, but index exchange-traded fund (ETFs) have gained more market share over the course of years, according to Nicolas Rigois,
global head of capital market products and solutions at Standard Chartered Bank.
“Single stock [structure] is easier to construct and when it comes to indices where you need physical delivery, what matters is the availability of an ETF that can be delivered,” Rigois told SRP.
Under the backdrop of short-term commoditised products where price competition is key, the executive found regional or sectoral indices, which tend to be traditional indices in their ETF delivery format, are more attractive in the current environment compared to actively managed ETFs that were popular years back.
“I think we’re back to a relatively traditional use of [index] ETFs such as Invesco QQQ ETF (QQQ), Invesco China Technology ETF (CQQQ), and SPDR S&P 500 ETF Trust (SPY),” he said.
And this similar argument applies to weighing between traditionally market cap indices and customised indices. Given those indices are customised to the point of being exclusive to a single investment bank, there typically won’t be an ETF tracking such an index, which naturally limits customised index-linked products to a smaller portion of the business, Rigois said.
“The average tenor of the type of product that we typically deal with, is relatively short dated. The idea behind customising an index is to capture some alpha over the longer term and so it’s relatively less relevant to shortdated structures,” he said. “Our clients tend to act more on the basis of the market sentiment, where potentially those customisations are a little bit less relevant.”

Head of index sales Emea STOXX-ISS
Despite strong factors driving the appeal of market cap indexes the availability of new indexes tailored for structured products will eventually impact that dominance.
Looking at the data on the use of equity indices in the structured products market, Armelle Loeb-Darcagne, head of index sales Emea at STOXX-ISS believes benchmark indices like the Eurostoxx 50 or S&P 500 will continue to dominate in their respective areas of influence “like we saw in 2024”.
Loeb-Darcagne also points at liquidity, familiarity, and correlation to the benchmark as “factors that will continue to contribute to their appeal”.
However, the adoption of more tailored indices could impact that dominance as they potentially offer better optimisation for structured products.
“The adoption of these more sophisticated indices would require a higher level of sophistication among clients and distributors,” said Loeb-Darcagne.
“Education is very much needed, both at the end investor and distributor level, to help them understand and adopt bespoke solutions that could potentially offer more upside than the major benchmarks.”
Looking back at market dynamics and the use of underlyings in the structured products market, Timo Pfeiffer, chief markets officer, Solactive, notes that is no surprise that market cap indices continue to dominate, driven by factors like investor familiarity, liquidity, and ease of trading.
However, the question of whether this reliance on market cap indices is due to industry “laziness” remains as more tailored sector indices could offer better value.
“Efforts in the sector index space have focused on overlays around high volatility and high dividend yields to improve pricing and value for structured products, in particular for autocallable structures,” said Pfeiffer.
“The shift in interest rates has generally benefited the structured products industry over the last few years, making both market cap and sector indices more attractive due to improved pricing.”
Timo Pfeiffer: Despite the liquidity and ease of trading of these large market cap indices which make them a very appealing options for structured products, there are issues around concentration risk.
Diversification should be promoted across markets and regions, rather than just focusing on sectoral or thematic diversification. Product providers and investors continue to default to familiar market cap
benchmarks, but these indices were not necessarily designed to be the optimal underlying for structured products and other indices could potentially deliver better value for investors.
However, introducing more complex indices can also pose new challenges, particularly in terms of regulation and suitability for retail investors. The higher interest rate environment has made the pricing of structured products more favorable, regardless of whether the underlying is a market cap index or a sector-based index.
The current environment has ‘lifted the boat’ for the whole industry, benefiting several product types such as daily principal protection structures, rates-based payoffs, and standard discount certificates.
At the Royal Bank of Canada (RBC), clients prioritised returns and were more willing to accept shallower barrier protection levels as the S&P 500 continued its rally breaking new highs up until the US presidential election.
Into 2025, a number of private bank and wealth intermediaries have become cautious on the back of geopolitical tensions notably US tariffs.
“This is reflected in more defensive product structures, with deeper barrier levels and capital protection,” said Fabian DePrey, global head of multi asset structuring at RBC Capital Markets.
To optimise the underlier for the payoff, the structurer pointed to index features like decrement and adjustedreturn indices, across broad markets, sectors and even single stocks. In addition, the Canadian bank was among the first movers to use the S&P500 Futures Excess Return Index (SPXFP) via structured notes. The S&P Market Agility series is another reference assets that have gained traction.
“There’s a broad consensus that 2024 was dominated by US exceptionalism,” said DePrey. “More recently, we see more consideration towards domestic European exposures, and an increased role of non-US names for global thematics, sector leaders - particularly around AI, healthcare, defense.” There has been a trend towards global sectors compared to geographical focuses.
On the non-equity side, DePrey expects that the growth of credit-linked notes and short-term liquidity notes logged in 2024 to continue.
The geographic exposure to sectors has shifted toward Emea between 2022 and 2024.
Industry sector indices remain a popular choice in the structured products market and have become drivers of new sectorial investment trends. Sales gathered by products linked to industry sector indices have seen substantial growth between 2022 and 2023, with volumes increasing by 49% year-on-year (YoY) to reach US$17.8 billion. This surge was accompanied by a rise in the number of issued products, growing from 4,183 in 2022 to 5,327 in 2023, signalling strong investor demand.
Current SRP data shows a reversal of this trend in 2024, as sales volumes decreased by 25% to US$13.4 billion while product issuance fell to 4,866 for both single- and multi-index linked products.
For the benefit of our analysis, in this report we focus on products linked to single industry sector indices. In 2023
sales volumes from single index-linked products were up 44% YoY, reaching US$15.6 billion. However, since then sales plummeted by 45% to US$8.5 billion, based on data extracted at the end of 2024. Similarly, the issuance followed a comparable pattern, rising from 3,807 in 2022 to 4,233 in 2023 before declining to 2,280 in 2024.
Sales volumes raised by products linked to sector indices with a decrement initially saw higher growth in 2023, but also a sharper decline in 2024, causing its market share to drop. On the other hand, products linked to sector benchmarks showed more resilience with a smaller decrease in growth and a recovery in market share.
Sector indices with a decrement had a stronger market share in 2022 and 2023, before experiencing a decrease in 2024, while sector benchmarks gained market share in 2024.
Regarding the overall adoption of sector indices, the trends indicate that industry sector indices are predominantly driven by Europe, Middle East & Africa (Emea) and with a possible shift away from the Americas.
Emea shows the strongest adoption trend of sector indices, with a significant increase from US$ 4.7 billion in 2022 to US$8.7 billion in 2023, before declining to US$5.2 billion in 2024, based on data extracted at the end of 2024. Despite the drop, Emea remains a key region for sector indices.
The Americas initially had the highest adoption in 2022 (US$5 billion) and continued to grow in 2023 (US$6.4 billion). However, in 2024, the adoption dropped significantly to US$2.4 billion, indicating a potential shift from single industry sector indices.
The Asia Pacific (Apac) region has had a minimal exposure to industry sectors, with volumes remaining extremely low across all years, suggesting very limited exposure in this market.
Furthermore, the geographic exposure to sectors has shifted significantly toward the Emea, while America’s prominence has declined. The data suggests a growing preference for
European markets, a reduction in broader global exposure, and the complete disappearance of Apac-focused allocations in 2023 and 2024. Specifically, the European markets (Emea) have seen a steady increase in exposure, growing from 45% of the overall industry sector exposure in 2022 to 54% in 2023, and further to 64% in 2024. This indicates a rising focus on Emea sector allocations.
The North American markets, which had the highest exposure in 2022 (47%), have experienced a decline, dropping to 43% in 2023 and further down to 30% in 2024. The combined European and US market sector allocation has slowly grown, reaching 1.0% in 2023 and 3.0% in 2024, suggesting growing interest in combined market exposure.
The data shows that the Emea offering remains focused on Emea exposure, with little diversification. The Americas offering is almost entirely exposed to North American markets, showing a clear regional preference. Looking at the evolution of market share among industry sector index providers, trends indicate a consolidation of market leadership by STOXX, a decline in Solactive’s dominance, and emerging competition from smaller players in the index sponsor space.
Sales volumes of products linked to Industry sector indices by STOXX has shown steady growth, increasing its market share from 36% in 2022 to 45% in 2024, resulting in the highest overall average share of 41%. This indicates a strengthening position in the index provider ranking.
Indices by Solactive, the market leader in 2022 with 42%, have experienced a decline, falling to 29% in 2024, and an overall average shares of 38%.
S&P Dow Jones and Bloomberg have maintained relatively small market shares, with the former declining from 10% in 2022 to five percent in 2024 – averaging seven percent for the period. Bloomberg, however, saw a slight increase in 2024 (9.0%) compared to its previous levels (5-6%), maintaining an overall share of six percent. Sales volumes for Morningstar indices grew marginally from one percent in 2022 to three percent in the following years but stayed relatively small.
In terms of sector allocation, the trend points to a gradual reduction in exposure to the dominant financial services sector, and greater focus on utilities, consumer discretionary,
as well as combined exposure to various sectors (multisector). Additionally, the technology and telecommunications sectors are beginning to gain more relevance.
Although the financial services sector maintained the highest market share across all years, its share has gradually seen a decline from 69% in 2022 to 55% in 2024, bringing its overall share for the period to 65%. This suggests a diversification trend, with other sectors gaining more relevance.
Banks dominate the allocation, maintaining a consistently high share of 93%-97% between 2022 to 2024, resulting in an overall 96% share. Insurance represents a small but stable portion, ranging between three to seven percent, with a total share of just four percent. The data suggests that investment exposure remains concentrated in banking-related activities, with minimal shifts over time, indicating a steady and dominant role for banks within the financial services sector.
Volumes linked to the energy and utilities sectors have shown fluctuations but remained stable, nevertheless. Energy held around nine percent in 2022 and 2024 but dipped slightly in 2023, resulting in an average of eight percent.
Several sectors have maintained relatively small but steady growth. Consumer discretionary and basic materials, as well as multi-sector combinations all grew slightly over time, reaching six to seven percent in 2024, indicating a more diversified sector focus.
Overall, the consumer discretionary sector remains largely driven by luxury and automanufacturers sub-sectors. Luxury holds the largest share overall (58% out of the consumer discretionary), though it fluctuates: from 69% in 2022, dropping to 48% in 2023, before recovering to 63% in 2024.
Automanufacturers follow, accounting for 33% of the total, with a peak in 2023 (42%) but declining significantly in 2024 (22%). Broad consumer discretionary exposure has expanded to 14% in 2024, suggesting a growing diversification within the sector. Travel & Leisure remains marginal, contributing only between one and two percent over the period.
The most used multi-sector combinations include the banks-; energy-; and the automanufacturers sub-sector, with banks particularly dominant across multiple combinations. The most dominant combination used is bank/energy/
basic resources, which starts at 15% out of the multi-sector combinations in 2022; then rises to 45% in 2023 and drops to 17% in 2024 when it was replaced by the bank/energy/ consumer discretionary combination to 35% in 2024. Other recurring combinations include banks/auto/basic resources (with a total of seven percent for the period) and auto/ defense/semi-conductors (totaling five percent out of the multi-sector combinations).
Health care, technology and telecommunication services have remained minor allocations. Technology and telecom services saw small increases in 2024, while health care declined to just one percent that year, averaging only three percent overall.
Finally, real estate and infrastructure have minimal representation while staples remain absent, highlighting a lack of focus on these industries.
Financial services continue to be the dominant sector in both Emea and Americas but has experienced a declining share, particularly in the Americas, where it dropped significantly from 84% in 2022 to 62% in 2024. Meanwhile, in Emea it has remained more stable, fluctuating between 52%-59%.
Industry sector indices continue to be at the forefront in the structured products market as they provide tailored exposure and an investment narrative.

Timo Pfeiffer Chief markets officer Solactive
When looking at industry sector indexes, product providers are often interested in a combination of attractive pricing and exposure to specific sector or thematic trends, according to Timo Pfeiffer, chief markets officer, Solactive.
“That is why US semiconductor indices, which have been a successful sector index in the structured products market recently, combines pricing advantages with a market theme that is currently in high demand,” he said.
“The pricing aspect is important as features like higher volatility and higher dividend yields can make sector indices more attractive.”
In addition to the pricing, certain sectors or themes can have better characteristics that make them more appealing, such as the performance of banks, utilities, oil and gas, or mining sectors. Pfeiffer notes that it is important to balance the pricing advantages with the underlying market trends and themes to create a compelling narrative and value proposition for investors.
“There are also regional differences which may make high dividend stocks in sectors like banks and oil and gas for instance more popular in certain markets as we have seen in the Canadian market,” he said.
From a product development perspective, Pfeiffer also notes that artificial intelligence (AI) is now part of the toolbox to help identify and classify these evolving sectors and thematic opportunities more dynamically. Solactive developed their own artificial intelligence (AI) engine to create new indices which is used in over 95% of cases for actual index selection, particularly for thematic and sectorfocused indices.
“Our AI engine is used to go beyond the traditional sector boundaries, as many large companies operate across multiple sectors,” said Pfeiffer. “The AI-driven approach allows for more dynamic and granular classification of
stocks into relevant sub-sectors and themes, which is a significant improvement over traditional methods.”
AI engines will enable a faster and more responsive identification of evolving themes and sectors, which is particularly valuable for newer, emerging areas.
“This AI-powered indexing is being used for the development of a growing number of thematic indices a few dozen and counting, across various thematic and sectorfocused strategies.”
According to Pfeiffer, sector indices have a strong outlook, and they will continue to evolve as they go beyond the traditional sector classifications into more granular, thematic approaches.
“The industry is moving beyond the traditional sector boundaries, with a focus on sub-sectors and themes that may cut across multiple sectors, like regional banks in the US, rather than just the broader financial services or banking sectors or US consumer sectors, combining both consumer discretionary and staple stocks as a potential area of focus that could be driven by political and central bank-related factors,” said Pffeifer.
“This more granular, thematic approach to sectors and sub-sectors will continue to be an area of focus, as it allows for better targeting of specific market trends and opportunities.”
Looking ahead, Pffeifer noted, there is a potential shift towards a more fundamental macro-driven approach that considers factors like central bank policies, political activities, and overall market valuations, moving away from chasing the hottest tech trends.
“We expect a return to fundamentals and macro investing will be a key theme for indexing and structured products in the coming year. Index providers must be able to translate these macro trends and fundamental shifts into investment opportunities,” he said.

Fabian DePrey Global head of multi asset structuring RBC Capital Markets
“We are somewhat agnostic around sectors, as our role is to address a wide range of client needs including market access,” said DePrey. However, RBC has identified a number of custom and enhanced sector exposures across broad themes – healthcare, financials, semi-conductors and AI in North America.
“We are taking a look at non-sector exposures too, such as consumer-preference driven allocations, such a NextGen – which looks at the consumers of the future and evolving spending habits.”
As investors’ understanding of AI evolves, the issuer sees the new technology being “baked-in” to sector exposures, particularly around sector leaders. “We have delivered a number of direct exposures to AI-focused companies, such as semi-conductors and data-centres, as well as a number of thematics which looked at the concept of ‘AI Winners’ – a wider universe of companies which may benefit from the trend within sectors such as healthcare,” said DePrey.

Stephane Mattatia
Global head of thematic indexes and derivatives licensing MSCI
Looking at sector indexes, SRP data shows that their popularity and appeal remain as investors believe they are more intuitive and offered targeted exposure compared to broad market cap indexes.
“Sector indexes align well with economic cycles as investors can allocate and diversify to seek performance across various sectors,” said Stephane Mattatia, global head of thematic indexes and derivatives licensing, MSCI. “Certain thematic areas, such as electric vehicles and luxury, have become so well-established that they are now considered traditional sectors, rather than just themes.”
With the evolution of the traditional classification of sectors some thematic areas have gained enough recognition and adoption to be treated as distinct sectors in their own right.
“This shift towards more thematic sectors is driven by the rapid technological advancements and changing market dynamics that are shaping investor preferences, according to Mattattia.
“Sector indexes also provide diversification to investors seeking to move beyond the concentration risk inherent in broad market cap indexes which are dominated by a few mega-cap stocks,” he said.
“There is increased appetite for sector indexes as investors seek to express their views and convictions through more granular exposures, while also benefiting from the potential for sector rotation strategies.”
As the index landscape continues to evolve to accommodate these thematic shifts, sector indexes will play a more prominent role in meeting the changing needs and preferences of investors.
Mattattia points at sector rotation as an area of focus for MSCI as it seeks to respond to demand from investors looking to diversify beyond the concentration risk in broad market cap indexes.
“Sector rotation allows investors to maintain exposure to sectors they believe will outperform, while also having the flexibility to shift to other sectors as market conditions change,” he said. “New generation indices such as sector rotation indices require robust algorithms to ensure optimal performance.”
MSCI is integrating AI and machine learning tools into its index creation and optimisation processes while the company’s research team is working on leveraging AI to enhance its index offerings, including exploring the use of natural language processing, big data, and other AI-powered techniques.
“We see the integration of AI as a way to enhance traditional indexing methods, provide better insights for clients, and optimise index performance,” said Mattattia
“We are also exploring the application of AI in areas such as multi-asset rotation strategies, where the combination of AI-powered signals can help design more robust and diversified solutions across different asset classes, such as equities, fixed income, commodities, and others. We want to leverage our experience in sector rotation within the equity space,” he said.
Looking beyond the two-year period covering this report, Tim Edwards, global head of index investment strategy at S&P Dow Jones Indices (S&P DJI), noted that ever since the Charles Dow created his Transportation Average in 1884, sector and industry-focused indices have been an important part of how market participants assess risk and monitor trends.
“Sector indices are not new, but across a range of product types, including structured products, we’ve recently noticed an increased appetite for sector and industry-based trading and investing,” he said. “There are a range of factors that are likely important.”
Edwards points at the impact or anticipated impact of U.S. domestic and international policy.
“Tariffs are often designed with one industry or another in focus, and different industries naturally have different exposures to global supply chains, domestic versus international consumer demand, and so on,” he said.
In addition, metrics such as carbon emissions and other sustainability-related measures are often highly correlated to a firm’s industry. Factors like the rise of AI and the associated computing or data storage requirements as well as anticipated productivity or margin impacts on a range of firms “have seen distinguished impacts” ranging across the technology, real estate and energy and utilities sectors.
These examples show how the macro environment has recently proved to be more idiosyncratic than it was a few years ago, according to Edwards.
“Rather than just focusing on a single market dynamic like US interest rates resulting in a so-called ‘risk on, risk off’ environment, the range of geopolitical, fiscal and economic drivers of markets in the past two years have resulted in lower correlations in different industries – the recent performances of the technology and energy sectors offer one of the more salient examples.”
Edwards also believes that higher performance dispersion among US sectors and industries has created opportunities for both diversification and return-seeking at a more granular level, which have naturally seen expression in increased interest for sector and industry-based indices.
“As well as the potential for integrating AI approaches on large data sets, we’re also seeing greater potential for innovation in product types,” said Edwards.
In the listed space, volumes in futures contracts associated to S&P DJI’s select sector and industry indices have approximately quadrupled since mid-2020.
The existence of a range of liquid, listed vehicles such as futures and options with a range of maturities can help structured product issuers to reduce their costs in hedging and increase the range of payouts that are available.
“Strength in one part of an index-linked ecosystem can support innovation in another,” he added.
Another trend, partly in response to the strong performance of a few very large companies and their increasing weights in the market, is the introduction of alternatively weighted and, in particular, equally weighted indices which have been attracting quite a bit of interest from product providers recently.

Nicolas Rigois
Global head of capital market products and solutions
Standard Chartered Bank
In Asia, Standard Chartered Bank’s Nicolas Rigois said that among popular sector indices front, the Financial Select Sector SPDR Fund (XLF), the Technology Select Sector SPDR Fund (XLK), and the Energy Select Sector SPDR Fund (XLE) have seen good flows for products.
“For instance, instead of picking a specific US financial institution, some clients prefer to go with XLF and express a view on the sector, which protects them from idosyncratic risk,” he said.

Gerald Toledano
Global head of equity and multi-asset
FTSE Russell
Gerald Toledano, global head of equity and multi-asset, FTSE Russell, noted that over the last two years, there has been an increasing demand towards European and Eurozone high volatile and/or high yielding sectors including banks, oil & gas, basic resources, autos & parts.
“More recently, demand appears to be shifting towards
Transatlantic exposure (Russell US + FTSE Developed Europe) usually with regional weight constraints and fixed constituent numbers all with decrement overlays,” said Toledano.
“We are also looking into which sectors may be most positively affected by the recent US tariff threats, with initial focus on sectors with high domestic revenues.”
Toledano notes that the integration of AI in the index space could be useful to create security selection processes to achieve exposures that are not covered by traditional sector classifications. Natural language processing (NLP) is an example - FTSE Russell have developed their own series.
“With LSEG’s new partnership with Microsoft, we expect opportunities to continue developing AI driven security selection processes for our indices,” he said.
In the short term, Toledano expects to see traction of traditional sectors with varying exposures - Europe, Eurozone, Transatlantic.
Longer term the focus will be on developing the standard offering of risk control indices on FTSE Russell flagshipsRussell 2000, FTSE 100, FTSE MIB, both cash and rolling Futures indices.
“Given the recent news about US tariffs, we will be keeping an eye on US sectors with high domestic exposure and Global sectors with high US revenue exposure,” said Toledano. “We have started to utilise current revenue data used in the creation of our FTSE Russell Domestic and Global Exposure Index Series.
“We will also be looking at launching a range of next generation ‘structured product friendly’ versions of our current Sustainable Indices with more focus on liquidity, narrower universes and fixed number constituents.”

Bevan Goulden, professional & institutional solutions, IDAD, has seen sector indices and ETFs gaining in popularity among investors who look to get exposure to US markets.
“The US market has been heavily influenced by the growth and popularity of ETFs. This has led to a situation where ETFs, including sector-focused ETFs, are widely quoted as underlyings for structured products.”
In the US, there is significant demand from investors to access sector exposures through ETFs whereas in European markets apart from the Eurostoxx Banks - SX7E, sector indices or ETFs are less popular on the continent.
“Demand for UK sector indices is limited. We must take into account that the FTSE is only 100 stocks and the smaller constituents are not widely (if at all) traded for exotic options,” said Goulden.
“The UK market is more focused on familiar assets and traditional benchmark-based products, with less demand for specialised sector-focused or custom index-based structured products.”
Despite being widely adopted across markets, some jurisdictions have their own preferences as shown by the UK market where retail professional advisers and investors tend to be less interested in sector or thematic investing compared to institutional investors, according to Chris Taylor, managing director, UK, Hilbert Investment Solutions.
“While there may be intellectual interest in discussing sector and thematic ideas, the actual money tends to follow the long-standing mainstream benchmark indices in the UK market,” he said.
“In the active fund management world, there is room for both diversified portfolios and more concentrated, stock-picking strategies. However, the UK retail structured products world has shown less interest in these types of active, basket-based approaches.
“In the active fund management world, managers can change the stocks in their portfolios, whereas in structured products, this flexibility may be more limited.”
However, according to Taylor, this trend is also being altered as there has been a shift in the buy-side professional adviser community towards global underlyings, recognising that the UK only constitutes a small percentage of global GDP.
As the S&P500 continues to reach new heights, we look at how products linked to the most featured equity underlying in the structured products market fared during 2024.
S&P 500 Index (SPX) one-year performance
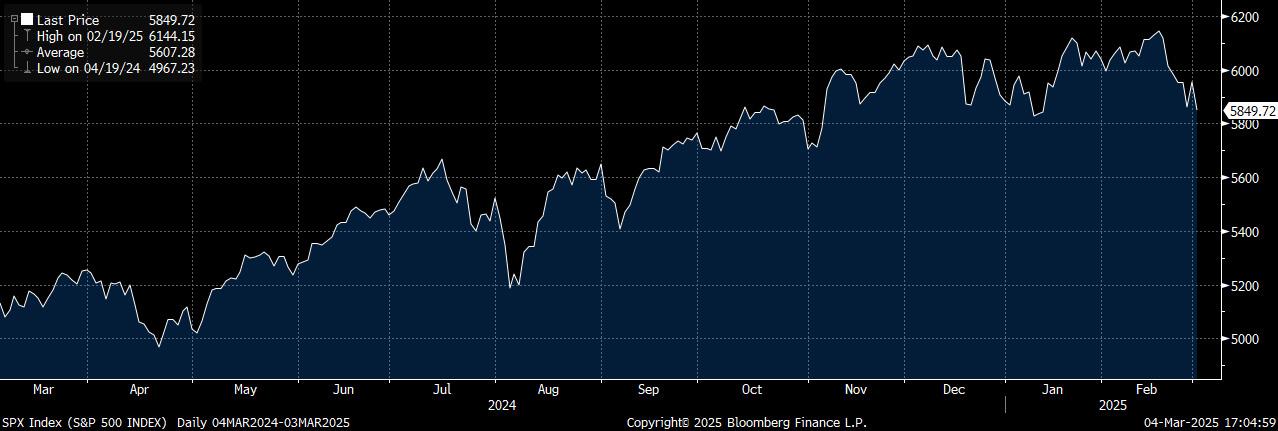
Source: Bloomberg, as of 3 March 2025
The S&P 500 index (SPX), which delivered significant value to direct investors in 2024 after achieving a 23.8% growth, was also the equity underlying with the highest issuance and sales attached to it in 2024. It was featured in over 37.5K products marketed across jurisdictions worth an estimated US$73 billion.
The US index was also a top performing underlying in the structured products market with 6,783 structured products maturing in 2024 across markets – the average investment duration of the maturing products was one-year and nine months.
Of the 6,783 structured products linked to the S&P 500 maturing in 2024 there were 3,340 with performance data reaching their expiration date in the US market which show that 2,063 maturities were capital-at-risk plans; 966 matured products offered up to 95% capital protection; 235 products offered full protection and 75 offered between 100.86% and 109% above the initial capital.
Capital-at-risk products delivered 7.73% average annualised return while soft-protected products delivered 9.8% averaged annualised return. The 235 fully protected products maturing in 2024 delivered 5.8% averaged
annualised return; while the 75 products offering more than 100% capital protection at maturity delivered 5.9% averaged annualised yield.
The best-performing payoff type for products linked to the S&P 500 maturing in 2024 was the leverage upside structure which delivered 15.1% average annualised return across 148 products.
Pure twin-win structures came second with 14.6% average annualised return across 51 products; and leverage upside with capped participation structures completed the top three ranking with 14.2% average annualised return.
Uncapped calls also delivered double digit returns at 12.8% average annualised return across 108 products; while capped participation products with leverage upside with 9.7% average annualised return across 307 products and capped participation/twin-win structures which delivered 9.7% average annualised return across 224 products, were also top performers.
Other top performing payoff types for products linked to
the S&P 500 maturing in 2024 include capped participation products with a 9.5% average annualised return across 254 products; digital structures with 8.2% average annualised return across 1,208 products; and reverse convertibles with 6.7% average annualised return across 52 products.
Barrier reverse convertible structures delivered 5.3% average annualised return across 293 products while traditional autocall structures delivered 4.2% averaged annualised return across 727 products.
The autocall/reverse convertible combination delivered 2.8% average annualised return across 187 products.
Of the total matured products with performance data there were 2,749 growth products which delivered 8.9% average
annualised return versus 4.6% average annualised return delivered by income type products.
The 57 growth and income products linked to the S&P 500 maturing in 2024 delivered 3.1% average annualised return.
Of the 3,340 products matured with performance data, 2,585 products were sold in the US market delivering 8.8% average annualised return; in Switzerland, the 313 linked solely to the S&P500 maturing in 2024 delivered 6.4% average annualised return; in South Korea the third market with the highest number of maturities linked to the S&P500 delivered 4.8% average annualised return across 327 products.
None of the 3,340 maturities linked to the S&P 500 index with performance data maturing in 2024 returned a loss. SPX-linked
The second most utilised equity underlying in the structured products market has kept the pace with its main competitor delivering value to investors in 2024.
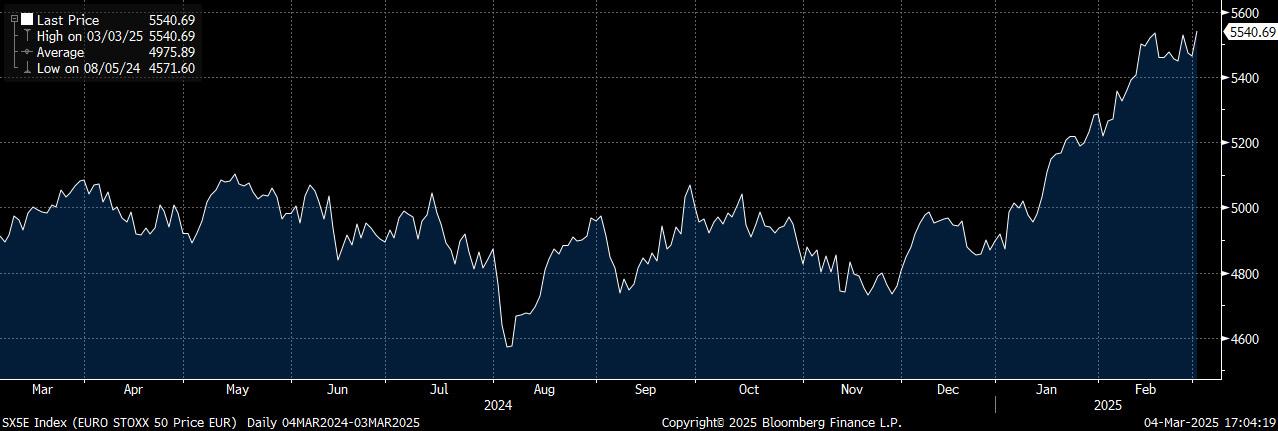
The Eurostoxx 50 index finished 2024 with a positive performance of 14.01% which was also reflected in the returns delivered by structured products linked to the European index in 2024.
The index appeared serve as the sole benchmark for 16.9K products worth an estimated US$36.4 billion sold across markets in 2024 while maturing products delivered well above current fixed income rates.
The European index as a sole underlying was behind 2,806 structured products expiring in 2024 across markets worth an estimated US$7.2 billion – the average investment duration of the maturing products was two-years and nine months.
Of the 2,806 structured products linked to the Eurostoxx 50 expiring in 2024 there were 1,056 products with performance data reaching their maturity date of which 715 matured across European markets with France (300) and Switzerland (276) leading the pack; and the US which also saw 336 products linked solely to the Eurostoxx 50 maturing during this period.
Products linked to the Eurostoxx 50 expiring in 2024 in France delivered 5.8% average annualised return; whereas those maturing in Switzerland delivered 5.5% average annualised return and investors in the US received 11.5% average annualised return. Additionally, products linked to the Eurostoxx 50 expiring in 2024 in the UK delivered 8.1% average annualised return.
Almost 80% of the maturities (835) with performance data were capital-at-risk products; 140 matured products offered between 10% and 97.5% capital protection; and 77 products guaranteed the initial capital. Three of the maturing products offered protection between 101% and 122.5% above the initial capital.
Capital-at-risk products delivered 7.04% average annualised return while soft-protected with 75% capital at risk delivered the highest averaged annualised return at 14.6%
Products with 80% capital at risk delivered followed closely at 14% and products with 90% capital at risk delivered 12% averaged annualised return.
Products with protection levels between 80% and 97.5% delivered 5.4% averaged annualised return; while the 77 products offering 100% capital protection at maturity delivered 5.9% averaged annualised yield.
Only four capital at risk products linked to the Eurostoxx 50 maturing in 2024 with performance data delivered no yield.
The best-performing payoff type for products linked to the Eurostoxx 50 with performance data maturing in 2024 was the Twin Win structure which delivered 20.8% average annualised return across just two products.
Leveraged upside with capped participation structures came second with 18.7% average annualised return across 33 products; digital with uncapped participation structures came next with 16.9% average annualised return across six products; twin wins with capped participation delivered 16.8% across three products; and digitals with uncapped participation completed the top five ranking with 12.% return across 27 products.
Other top performing payoff types for products linked to the
Eurostoxx 50 maturing in 2024 include digital products with a 10.1% average annualised return across 58 products; and reverse convertible autocall structures with 9.5% average annualised return across four products.
Traditional autocalls (213 products maturing) and reverse convertibles (36 products) delivered 7.7% average annualised return; while leverage upside structures delivered 7.2% average annualised return across 101 maturing products.
The worst performing payoff types on Eurostoxx 50-linked products maturing in 2024 were the autocall with capped participation which delivered 2.4% across eight products as well as capped participation structures which delivered 3.1% across 31 products and uncapped participation products which delivered 4% across 16 maturing products.
Of the total matured products with performance data there were 569 growth products which delivered 9.4% average annualised return versus 5.3% average annualised return delivered by 478 maturing income type products. There were only eight growth and income products linked to the Eurostoxx 50 maturing in 2024 with performance data which delivered 3.7% average annualised return.
SX5E-linked products: top performing payoff types in 2024
The index is the main market cap benchmark used solely as an underlying in the Korean structured products market in terms of AuM.
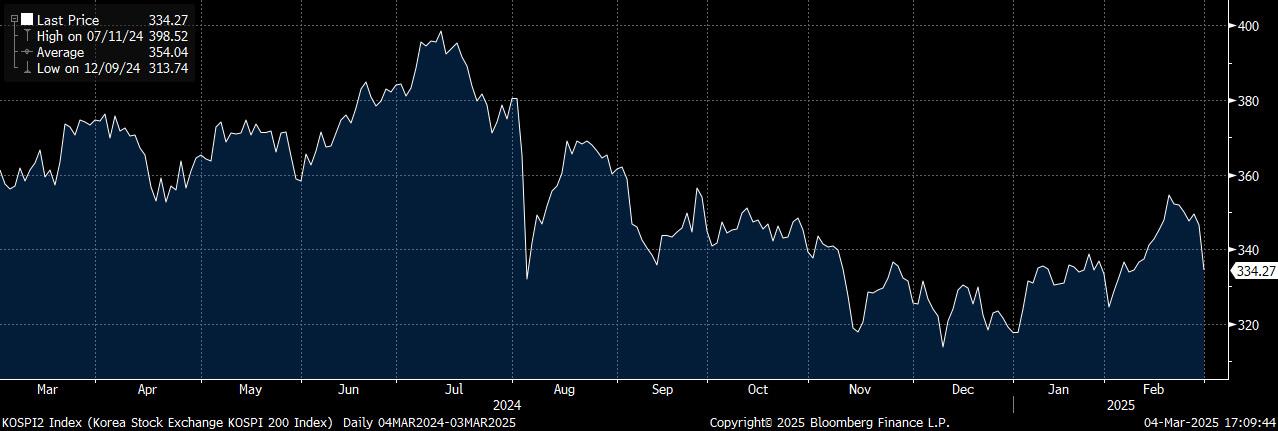
Source: Bloomberg, as of 3 March 2025
The Kospi 200 index (KS200) which ended 2024 with a negative performance of -2.61% provides another example of how the performance of structured products can differ from that of the underlying asset – in 2024 structured products linked to the Korean index with performance data show an average return of 4.3% on average.
The index appeared as the sole benchmark for 790 products worth an estimated US$4.5 billion maturing in South Korea in 2024 – the average investment duration of the maturing products was eight months.
Of the 791 structured products linked to the Kospi 200 expiring in 2024 there were 634 products with performance data all of which were sold in South Korea.
Products linked solely to the Kospi 200 expiring in 2024 delivered 4.3% average annualised return; almost 68% of the maturities (431 products) with performance data offered protection between 100.5% and 116% above the initial capital; while 16% of the maturities with performance data guaranteed the initial capital and 15% put the capital invested at risk.
Products offering more than the initial capital at maturity delivered 4.2% averaged annualised yield, while products
protecting 100% of the capital invested delivered 4.4% averaged annualised return. Capital-at-risk (CAR) products delivered the best performance at 4.8% average annualised return.
Only three capital-at-risk products linked to the Kospi 200 maturing in 2024 with performance data delivered no yield.
The best-performing payoff type for products linked to the Kospi 200 with performance data maturing in 2024 was the traditional autocall structure which delivered 5.1% average annualised return across 125 products.
Digital structures came second with 4.2% average annualised return across 394 products; and capital protected structures with knock-out came next with 3.5% average annualised return across 28 products.
Capital protected twin win structures with knock-out (seven products) at 3.31% and capped participation structures (eight products) at 3.14% average annualised return almost mirrored each other on the number of products maturing in 2024 as well as the final payout.
The best performing product linked to the Kospi 200 (DB Happy Plus ELS 2267) matured on the first observation date paying out 102.80% (8.54% pa.) capital return as the index level was above 95% of its strike level.
Equity-linked securities (ELS) delivered the best performance among Kospi 200-linked products with a 4.6% average annualised return across 98 products
whereas equity-linked bonds (ELBs) delivered 4.3% average annualised return across 536 products. Mirae Asset Securities delivered the highest value to its clients with a 5.1% average annualised return across 14 products followed by DB Financial Investment which returned 4.8% average annualised return across 20 products and Eugene Investment Securities which delivered 4.7% average annualised return across 43 products.