2 minute read
BMBI
BUILDERS MERCHANT BUILDING INDEX
SECOND BEST QUARTER ON RECORD BUT SIGNS OF A SLOWDOWN IN SIGHT
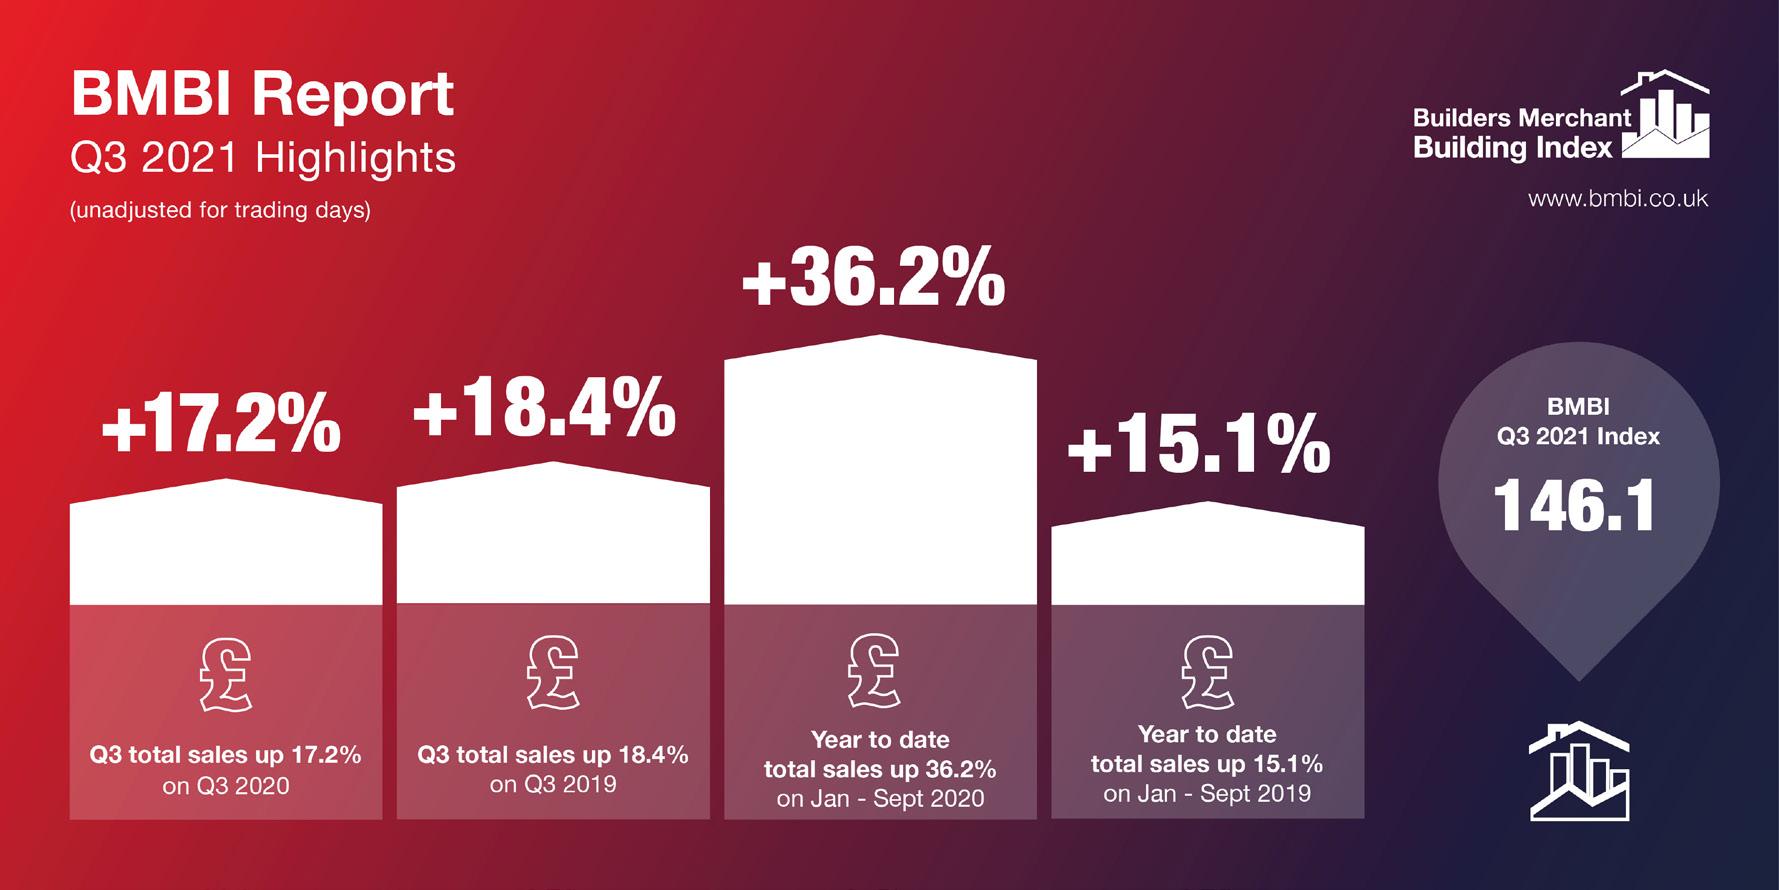
The latest figures from the Builders Merchants Building Index (BMBI), published in November, show a continuation of the strong growth seen throughout 2021, as Q3 recorded the secondhighest quarterly BMBI sales ever. However, there are signs of a slowdown as volume growth gives way to value growth, driven by price increases.
QUARTERLY SALES, YEAR-ON-YEAR
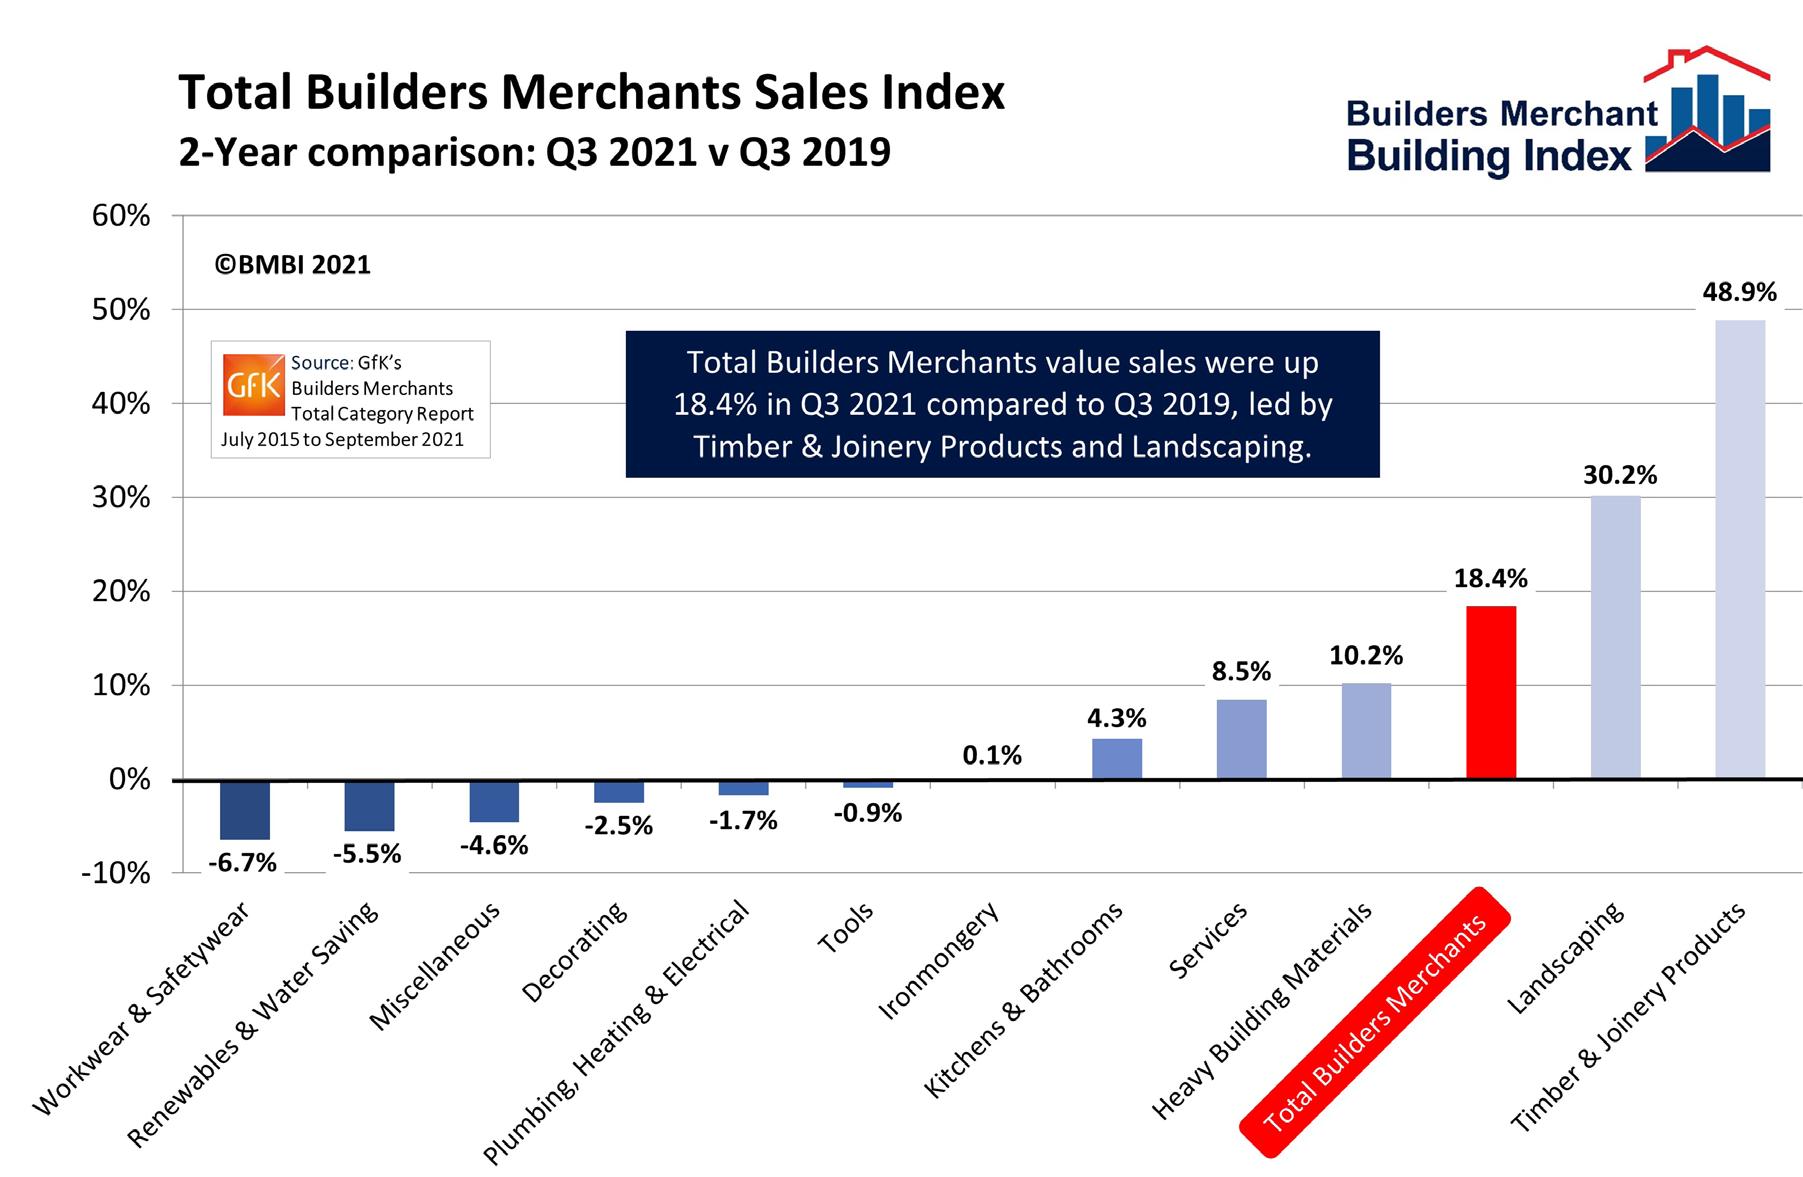
Total value sales in Q3 2021 were 17.2% higher than Q3 2020, with one less trading day this year. Eleven out of the 12 product categories sold more over the period. Timber & Joinery Products led the field (+43.9%) with its highest-ever quarterly BMBI sales, contributing significantly to overall growth. Excluding Timber, total merchant sales still grew by 9.6%. Like-forlike-sales increased by 19.1%. Comparing Q3 2021 with Q3 2019, a more normal pre-Covid year, overall value sales were up 18.4% with one less trading day this year. Six categories sold more, led by Timber & Joinery Products (+48.9%) and Landscaping (+30.2%). Like-for-like sales were up 20.2%.
QUARTER-ON-QUARTER
Total value sales were down 2.4% in Q3 2021 compared to Q2 2021, despite the three extra trading days in Q3. Five of the 12 product categories sold more in Q3. Kitchens & Bathrooms (+7.4%) and Timber & Joinery (+4.8%) performed best, while Landscaping was weakest (-22.5%). Like-for-like sales were 7.0% lower than in Q2.
SEPTEMBER SALES, YEAR-ON-YEAR
Total sales were up 14.9% in September 2021 compared to September 2020. Timber & Joinery Products (+38.7%) did best as it continues to outperform other categories. Total value sales in September 2021 were also 24.5% higher than the same month two years ago, with one more trading day this year.

SEPTEMBER SALES, MONTH-ON-MONTH
Total merchant sales in September were 6.2% higher than August, with one more trading day, contributing to Q3’s overall performance. All bar one category sold more.
YEAR-TO-DATE
Year-to-date sales for January to September 2021 are up by 36.2% in value against 2020. Compared to 2019, a more accurate benchmark, year-to-date growth is up by 15.1%.
INDEX
The Q3 BMBI index was 146.1, with nine of the 12 product categories exceeding 100. Timber & Joinery Products (191.9) and Landscaping (184.0) continue to outperform other categories by some margin.
GfK’s Builders Merchant Panel
GfK’s Merchant Panel includes national, multi-regional and regional merchants such as Buildbase, Jewson, Travis Perkins, EH Smith, Gibbs & Dandy, MKM and Bradfords. GfK’s Builders’ Merchant Point of Sale Tracking Data represents more than 80% of the value of the builders’ merchant market. GfK insights can trace product group performance and track relevant features. GfK can also produce robust like-for-like market comparability, tailored to the requirements of an individual business.
The Builders Merchant Building Index
The BMBI is published every month, in print and online. A full quarterly report is available every three months. The BMBI is a brand of the Builders Merchants Federation. Launched and produced by MRA Research, it uses sales-out data from GfK’s Builders Merchant Panel. BMBI includes a panel of leading industry Experts, who speak exclusively for their markets.
For the full report, Expert comments and Round Table Debates, visit www.bmbi.co.uk.


