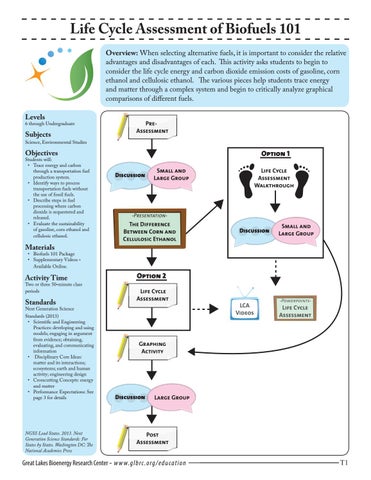
Life Cycle Assessment of Biofuels 101 Overview: When selecting alternative fuels, it is important to consider the relative advantages and disadvantages of each. This activity asks students to begin to consider the life cycle energy and carbon dioxide emission costs of gasoline, corn ethanol and cellulosic ethanol. The various pieces help students trace energy and matter through a complex system and begin to critically analyze graphical comparisons of different fuels. Levels
6 through Undergraduate
Subjects
PreAssessment
Science, Environmental Studies
Option 1
Objectives
Students will: • Trace energy and carbon through a transportation fuel production system. • Identify ways to process transportation fuels without the use of fossil fuels. • Describe steps in fuel processing where carbon dioxide is sequestered and released. • Evaluate the sustainability of gasoline, corn ethanol and cellulosic ethanol.
Materials
• Biofuels 101 Package • Supplementary Videos Available Online.
Activity Time
Two or three 50-minute class periods
Standards
Next Generation Science Standards (2013) • Scientific and Engineering Practices: developing and using models; engaging in argument from evidence; obtaining, evaluating, and communicating information • Disciplinary Core Ideas: matter and its interactions; ecosystems; earth and human activity; engineering design • Crosscutting Concepts: energy and matter • Performance Expectations: See page 3 for details
NGSS Lead States. 2013. Next Generation Science Standards: For States by States. Washington DC: The National Academies Press
Discussion
Small and Large Group
Life Cycle Assessment Walkthrough
-Presentation-
The Difference Between Corn and Cellulosic Ethanol
Discussion
Small and Large Group
Option 2 Life Cycle Assessment
LCA Videos
-Powerpoints-
Life Cycle Assessment
Graphing Activity
Discussion
Large Group
Post Assessment
Great Lakes Bioenergy Research Center - w w w.gl brc.org/educa tion
T1