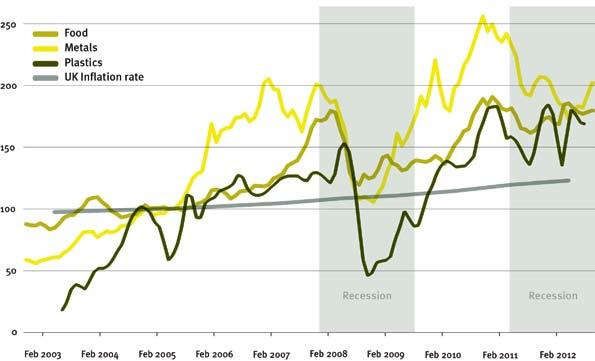
Environmental impact as a price driver
Increasing scarcity is not the only driver of material insecurity. A second major driver is the impact of environmental damage on a company’s reputation. This is more difficult to measure, but it still creates significant price and availability problems for businesses.
The most visible example is coal, which is perhaps the first pariah mineral. However, similar price problems arise for aluminium and palm oil, as the case studies opposite show.
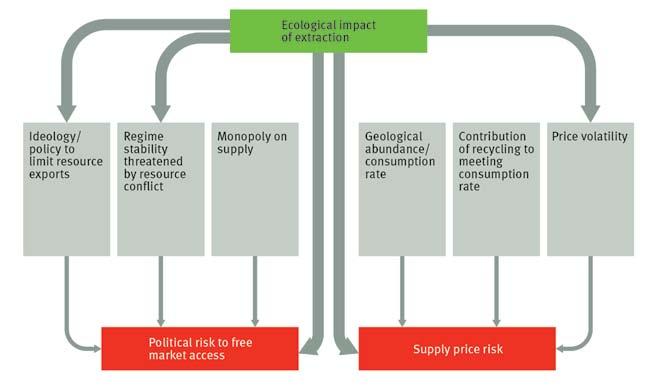
consumer concerns. These are most clearly expressed through legislation like REACH, European legislation requiring disclosure of chemicals used throughout the manufacturing chain; or like the Dodd-Frank Act, US legislation which requires companies using coltan (tantalum ore), cassiterite (tin ore), wolframite (tungsten ore) and gold to monitor their supply chains to ensure they are not fuelling environmentally damaging conflict in the Congo or neighbouring countries.17 This act has been followed by initiatives to extend these requirements to other OECD countries.18 It is part of a wider trend of regulatory oversight over supply chains, which has been driven by many resource conflicts, as outlined in the table below.
These price risks have gone hand in hand with increasing visibility of supply chains, which is beginning to catch up with the international extension of supply chains associated with globalisation. Unlike scarcity risks, these ‘impact’ risks depend on government, citizen, and
This trend is reinforced by legislation but, even in its absence, technology and growing wealth in the developing world are making international supply chains increasingly visible. In the developing world, E15 can buy a mobile phone with a camera and access to social networking:
Recent civil wars and internal unrest fuelled by natural resources19
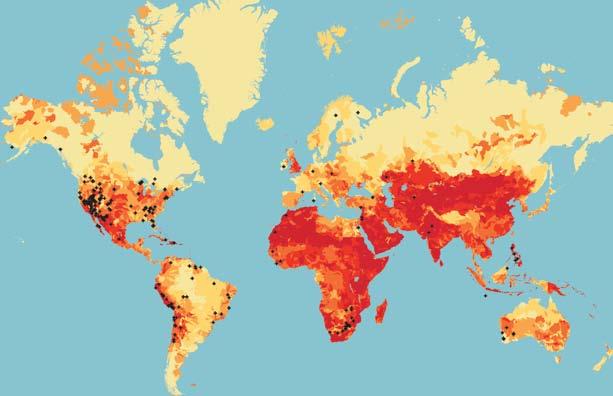
Country
Afghanistan
Duration Resources
1978-2001 Gems, timber, opium
Angola 1975-2002 Oil, diamonds
Burma
1949- Timber, tin, gems, opium
Cambodia 1984- Oil, gold, coca, timber, emeralds
Congo, Dem Rep. of 1996-1998, 1998-2003, 2003-2008
Copper, coltan, diamonds, gold, cobalt, timber, tin
Congo, Rep. of 1997- Oil
Côte d’Ivoire 2002-2007 Diamonds, cocoa, cotton
Indonesia – Aceh 1975-2006 Timber, natural gas
Indonesia – West Papua 1969- Copper, gold, timber
Liberia 1989-2003 Timber, diamonds, iron, palm oil, cocoa, coffee, rubber, gold
Nepal 1996-2007 Yarsa gumba (fungus)
PNG – Bougainville 1989-1998 Copper, gold
Peru 1980-1995 Coca
Senegal – Casamance 1982- Timber, cashew nuts
Sierra Leone
1991-2000 Diamonds, cocoa, coffee
Somalia 1991- Fish, charcoal
Sudan 1983-2005 Oil
12
Resource resilient UK
“Technology and growing wealth in the developing world are making international supply chains increasingly visible.”
cheap connections to global communications systems mean that that environmental damage hidden in supply chains is likely to become visible much more easily than in the past.
Conclusion
If exposure to availability and price volatility risk has become the new normal, what can companies and countries do to cope? Part of the
A risk premium on coal
Environmental risk has made new coal-fired power stations more expensive than new wind farms in Australia.
According to Bloomberg New Energy Finance: “lenders are unlikely to finance new coal without a substantial risk premium due to the reputational damage of emissions-intensive investments – if they are to finance coal at all.”20
This risk premium raises the price of new coal by nearly 60 per cent. This is in addition to carbon costs, and stands despite the scepticism of the Australian opposition to coal restrictions.
Land conflict stalls aluminium production
Bauxite, or aluminium ore, is abundant, but the ability to expand extraction is at risk from costly delays or project failure due to conflict with land users.
In the Indian state of Orissa, the mining company Vedanta has faced years of delays whilst it appeals against government and judicial decisions upholding the land use rights of indigenous groups. The court process revealed a strong disregard for existing land users and environmental regulations,
Palm oil’s reputational risks

Palm oil is neither scarce nor inefficient: it produces five times more oil per hectare than rapeseed. However, its production has caused deforestation, which releases large quantities of CO2 and destroys the habitat of orangutans.
These issues have created severe reputational risks for companies that use palm oil. Avoiding this risk means paying a third more for sustainable palm oil, which is a price many now pay.
New supply has also been constrained. Production at the Sime Darby palm oil company’s $3.1 billion Liberian plantation has been delayed by
answer lies in replacing increasingly insecure primary raw materials with secondary materials, parts and products. Doing so would mitigate some of the major risks that drive material insecurity. But the specifics of how circular systems mitigate risk need to be teased out to understand where circular approaches are best, and what’s preventing more circular approaches from happening.
which led directly to high profile divestments by institutional investors; downgrading by the credit rating agency Standard and Poor’s; and a call by UK MPs for the company’s legal violations to be investigated with a view to delisting the company from the London Stock Exchange.
Delays in Vedanta’s bauxite mine caused a $1 billion refinery to be closed; $1 billion in expansion investment to be frozen; and production in its $4.3 billion smelter to stall, potentially shutting it down.
communities protesting that they have been inadequately compensated by the Liberian government. The government’s deal with Sime Darby did not remove the counterparty risk which arises from environmental problems.
13 Building a business plan for the circular economy
0 50 100 Coal Wind Technology cost Risk premium $A/MWh
vs wind price in
the effect of risk
Coal
Australia:
© Rezac/Greenpeace
Resource resilient UK 14
2
How does the circular economy help?
Defining a circular economy
At its best, a circular economy restores old products, parts and materials back to their original use in a way that uses the least resources to deliver the same function. Usually, this means direct reuse. Where a product needs repair or reconditioning before it can be used again, remanufacturing preserves the most value. These are the tightest closed loops within a circular economy.
The next best thing is recycling, which can be closed or open loop. Closed loop recycling turns products into materials that can be used to create the products they were recovered from: examples include glass bottle to glass bottle or specialty alloy to specialty alloy recycling. In contrast, open loop recycling, or downcycling, creates material suitable only for lower value applications. For example, glass bottles can be used for construction aggregate and specialty alloys can be downcycled into bulk metals. This avoids the use of new, lower value materials.
Measuring risk
Rising environmental risks are not inevitable. Companies and countries can use circular approaches to avoid both scarcity related and environmental impact related risks. But because creating circular systems isn’t free, to justify investment companies need to understand the embedded environmental impacts which give rise to insecurity, and how circular systems can reduce them.
As a start, companies can measure the relevant impacts embedded in each tonne of raw material they use via a number of methodologies. The Task Force discussed these and concluded that their strengths and weaknesses depend on where they are applied. The most immediately useful indicator, called Environmentally
Weighted
Material Consumption (EMC), builds on materials use data already collected by many companies and impact factors used for lifecycle analysis.
15 Resource resilient UK
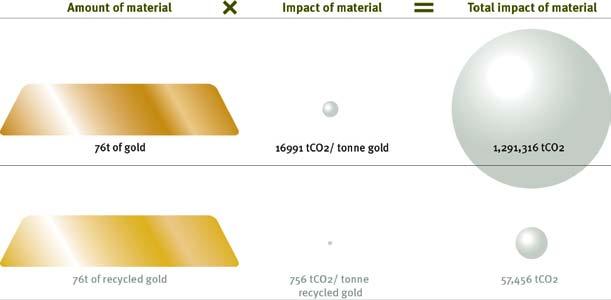
risk for gold using Environmentally Weighted Material Consumption (EMC)
Measuring
Deciding which impacts to measure reflects the risks outlined in section one:
Scarcity risks: measurement of embedded energy (and therefore CO2) and water.
Impact risks: measurement of land use and materials use.
EMC is a limited tool, but it usefully illuminates where standard analyses, which exclude environmental factors, hide risks. Over time, developing more sophisticated indicators will help companies to understand better how to maximise the benefits of circular systems.
Carbon risk: the case of aluminium
Risk analysis focused primarily on political risk sees copper, chromium and aluminium as having similar, relatively low levels of risk.
A more sophisticated analysis that incorporates an understanding of environmental drivers shows that aluminium is much more exposed to carbon risk than copper: each tonne of aluminium creates around 13 tonnes of CO 2 For base metals, this is a major issue. Refining and melting iron, steel and aluminium is responsible for ten per cent of world CO2 emissions.21 The higher exposure of aluminium, compared to copper, is visible when carbon risk is measured. Chromium production is even more carbon intensive. Similar patterns appear for carbon intensive plastics, like nylon.
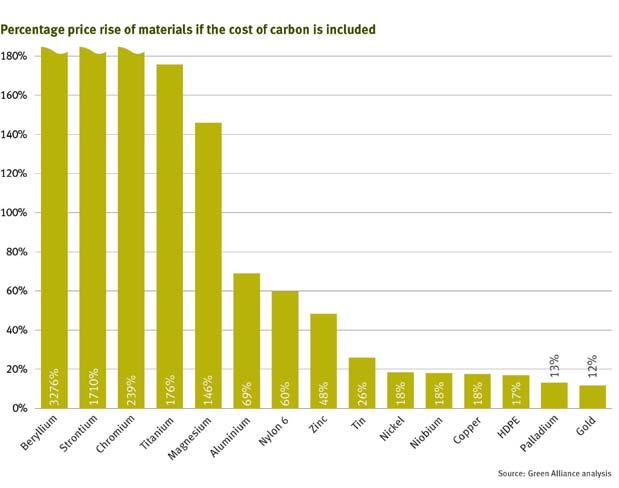
These insights translate into future price risks: if CO 2 were priced according to PUMA’s pioneering environmental profit and loss accounts, adding the cost of carbon to the market price of a tonne of primary aluminium would cause its combined price to rise by nearly 70 per cent. Chromium would rise by 239 per cent. Even nylon could rise by 60 per cent. By contrast, more reuse and recycling reduces these risks: recycled aluminium would only rise in price by seven per cent and reused aluminium would rise by less than one per cent.
This analysis of future price risk reveals embedded CO 2 as a strong indicator of material insecurity for aluminium, chromium, and other materials, enabling companies to see the benefit of using secondary materials.
“Adding the cost of carbon to the market price of a tonne of primary aluminium would cause its combined price to rise by nearly 70 per cent.”
Similar calculations could be made for the impact of rising coal, oil and gas prices on aluminium and steel; or of water demand on copper and bio-based plastics; or of land and material use risks on specialty metals. Doing so requires more work to gather data about water, land, and material use, and to standardise the methodologies which underpin these measurements. Nevertheless, by analysing the vulnerability of different materials to different scarcity or impact related risks, companies can quickly understand which risks matter and how a circular approach helps to address them.
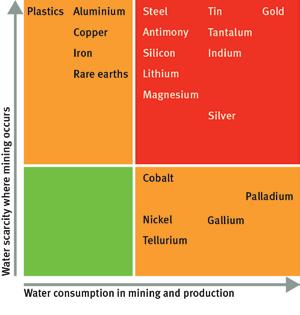
Areas of risk and materials affected by them22
Water Precious metals, PGMs, copper, zinc, indium
Energy/carbon Aluminium, titanium, magnesium, precious metals, PGMs
Total material requirement (eg local land impact) REEs, precious metals, indium, tellurium, gallium, tin, lithium
Acceptability (eg toxicity) Lead, chromium, arsenic, cadmium, mercury, some plastics
Resource resilient UK 16
Closing the loop already mitigates risk: indium recycling in Japan
Indium is a semi-precious metal whose oxide, when mixed with tin oxide, has the exceptional properties of being both transparent and electrically conductive, making it an integral component for touch screen and flat panel displays.
As demand for such displays has mushroomed in recent years, so too has demand for indium, with production trebling between 1996 and 2006. However, Indium is only produced as a by-product of zinc and lead production, so its supply is price inelastic: more zinc is not mined to produce more indium when indium prices are high.
To help protect against shortages of supply and associated price volatility, Japanese flat panel display manufacturers collect indium tin oxide wasted in the production process and send it to be recycled when supplies are low or prices high. This relies on a direct contract between the manufacturer and the recycler, so the recycler cannot sell the reclaimed indium to anyone else. This system acts as a physical hedge, smoothing out availability and moderating price spikes.
Recycling isn’t enough
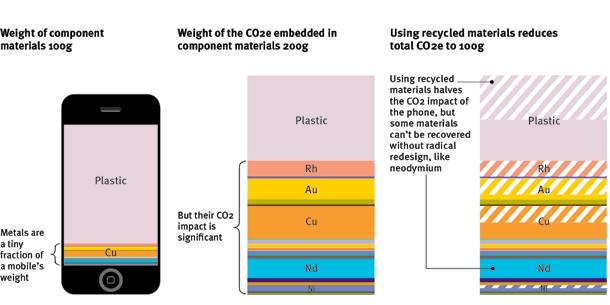
Substituting secondary materials for primary materials can reduce risk, but needs to be targeted to ensure the right materials are recycled. As shown below, in the case of a mobile phone, substituting five recycled materials for virgin ones halves its CO2 impact and would be an easy, first step towards more circular production.
However, recycling is limited. It can only tackle some of the environmental drivers of availability problems and price volatility. Some materials, like neodymium, are used so dispersively as to make recycling very difficult. For others, like steel and aluminium, rising demand means that even if these metals were fully recycled, total CO2 emissions from their production would still exceed 2050 carbon targets. This means recycling cannot fully address the fundamental environmental risks inherent in these bulk resources.
17 Resource resilient UK
Because reuse and remanufacturing generally use significantly less energy and water than recycling, these tighter resource loops are much less exposed to energy (CO2) and water risks. And, as they entirely avoid extraction and minimise processing they are also much less subject to reputational risks.
“A reused iPhone retains around 48 per cent of its original value, whereas its value as recyclate is just 0.24 per cent of its original value.”
Reuse captures more value
As outlined above, tighter resource loops provide the greatest mitigation of risk. They are also likely to provide the highest value recovery to businesses. This is because reuse and remanufacturing preserve much of the value created through manufacturing.
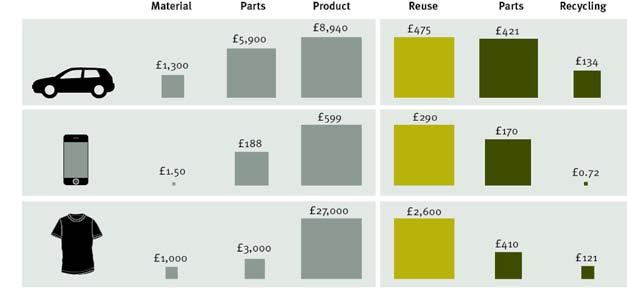
The illustration opposite shows the difference between the value of raw materials, components, and finished products for three common items: a car, a mobile phone and a tonne of textiles. The value of the finished product is inevitably many times greater than the raw materials or components in it.
At the point at which their first owner decides to discard them, these products show a similar pattern: their worth is much greater as products than as materials. The most striking example is perhaps an iPhone. A reused iPhone retains around 48 per cent of its original value, whereas its value as recyclate is just 0.24 per cent of its original value.
Resource resilient UK 18
Recycling a mobile phone only reduces some of the CO2 impact of component materials
Reuse is where the money is
Companies choose closed loops
The simple lesson that has emerged from the work of the Circular Economy Task Force is that companies already choose the tightest closed loops – reuse and remanufacturing – when they can control a suitable product or material system. This is because closed loop systems capture the most value, avoid the most risk and, where they
Closed loop case studies
Private control
Rolls Royce: ‘Revert’ programme IBM: ‘Global Asset Recovery Services’
are controlled by a single company, offset the need to hedge for the price volatility of new materials. They also avoid the (normally uninsured) risk that lack of availability of resources will constrain production. The most successful circular systems which involve more than one company replicate this system level control.
Public control
Individual Producer Responsibility for Japanese appliances and IT
How it works Rolls Royce’s ‘Revert’ programme recovers and reuses unserviceable engine parts and waste aerospace grade metal from machining. The system relies on long term service contracts with clients so Rolls Royce retains ownership and access to materials. This enables them to separate and remanufacture individual parts, and to keep aerospace grade superalloys separate prior to recycling so these materials and components maintain their highly engineered value.
IBM’s ‘Global Asset Recovery Services’ system takes back old IT equipment, to refurbish and reuse it in IBM’s own operations, prior to materials recovery. This makes for a faster responding, lower cost internal equipment supply system.
Japanese manufacturers of certain household and IT goods are legally responsible for, and benefit from, their end of life disposal and must recover a minimum proportion of materials for reuse or recycling. They are required to own both the manufacturing and recovery plants for their products. This has led to better design for disassembly and 74-89 per cent recovery of materials and components in new products, as compared to only 30-40 per cent in the UK.
Because products change ownership, consumers are required to pay fees (sometimes upfront) to return end of life products to manufacturers’ disassembly plants. These collection systems are standardised and easy to use.
Weaknesses
The infrastructure required to recover and recondition old engines or computers means manufacturers face high costs if they switch to new materials, parts or products.
The system relies on a shared view of resource risk between government and business for businesses to accept a very rigid and dirigiste system which limits business flexibility.
19 Resource resilient UK
Finished products are worth much more than the raw materials inside them
Value is lost by breaking products back down into components and materials
These case studies show that both private and public sector closed loops happen when:
• materials or products are sufficiently valuable;
• there is control over the whole product or material chain, enabling information about quality and quantity to be understood by designers and end-of-life handlers, which helps products and materials to flow efficiently back to manufacturers;
• materials or products are relatively easy to reuse, remanufacture, or recycle;
• the pace of product and material change is not too fast, so demand for future products or materials is well understood in advance;
• materials and products are kept concentrated and uncontaminated.
Open loop case studies
it works
Open loops
Where conditions for closed loops don’t hold, some circular opportunities still exist, but they are often dominated by downcycling and loss of value. This is because circular systems which involve many parties often provide a diffuse benefit: they increase supply, which should moderate the price volatility and availability risk caused by a tight relationship between supply and demand. However, because these benefits accrue to all users of a material stream, whether they are involved in the circular system or not, it may not make sense to invest in expensive equipment or processes to create closed loops. As such, these appear to happen only when the characteristics of materials or products make them easy to recover (commodity metals), or where recovery is mandated by legislation such as the End of Life Vehicles (EoLV) and Waste Electronic and Electrical Equipment (WEEE) directives.
Bulk and precious metal recycling is delivered through largely self-organising, liquid markets with a variety of companies collecting, sorting, concentrating and reprocessing both pre- and post-consumer metals.
EoLV and WEEE mandate collection systems to direct post-consumer products to re-use and recycling systems. The EoLV directive also requires vehicles to be 85 per cent reusable or recyclable by weight, which has influenced design for recyclability.
Weaknesses
There is very little recovery of specialty metals used in low concentrations, such as niobium, or metals used in multi-material components, such as tantalum.
Reuse and remanufacturing of metals is rare. High recovery rates only occur when metal collection is mandated.
Increased WEEE collection has led to increased bulk and precious metals recycling, but not specialty metals, like indium, or rare earth metals.
Neither WEEE nor EoLV has increased design for reuse or remanufacturing, and recovery rates of components are low.
Resource resilient UK 20
Private control Public control Metals EoLV and WEEE directives
How
21 Building a business plan for the circular economy
the economy
Why isn’t
already circular? 3
Both closed and open loop systems exist for metals and engineered products like IT and appliances. If closed loop systems are so attractive, why aren’t they more common, and why do companies and governments choose low value, recycling or downcycling dominated recovery options?
Value vs flexibility
One major insight uncovered in the discussions held with the Task Force is that there is a tradeoff between maximising the value of secondary products or materials and maximising business certainty over the market for these goods. Where companies are able to be certain of demand and supply of products for reuse, they seek the much greater value in reuse. Indeed, it is striking that all the closed loop case studies considered by the Task Force occur where companies can create certainty over supply and demand. In contrast, companies that are uncertain about demand or supply for high value products resort to capturing the much lower raw material value of products.
A good illustration of this trade-off can be seen in old mobile phones. Research from WRAP shows that, although around one fifth of all discarded waste electronics are reusable or easily repairable,23 the majority that make it into recovery facilities are shredded to recover their gold and other precious metals. Despite their low value relative to a reused or repaired mobile, gold and other precious metals have known value and are sellable in highly liquid markets. Gold selling makes for a more flexible business model than mobile phone selling: the large number of end uses for these metals guarantees demand. In contrast, the market for reused or remanufactured mobiles is more lucrative but much smaller and more volatile: last year’s mobile phone may have a high value or may be shunned by consumers, making a business dependent on such a market less resilient to changing demand. Even eBay’s successful reuse-based business model offloads the value/flexibility dilemma onto individuals, and benefits from existing postal and telecommunications infrastructure.
What prevents take up of circular opportunities?
The trade-off between higher value circularity and lower value flexibility exposes two types of barriers which prevent circular business models from becoming viable: those associated with markets and those associated with materials.
Market barriers
Market barriers prevent companies from capturing the benefits which can be gained through a more circular economy. Scaling the circular economy up means tackling the three biggest market barriers faced by businesses:
1. Mispriced risk: the assumption that, because material availability and cost have been unproblematic in the past, they won’t be in the future. Section 1 identifies why this is unlikely. Nevertheless, existing linear systems have sunk costs and economies of scale which reflect a low perception of material security risk.
2. Split incentives: The Task Force businesses have regularly highlighted how open loop systems create different incentives for different actors that limit both the engagement with, and benefits of, circular systems. For example, the benefits of redesigning a product to be more readily disassembled accrue to the company doing the disassembly and recovery, rather than the original manufacturer. Split incentives are difficult to remedy, but some are less intractable than it seems at first glance.
3. Inadequate recovery infrastructure: Ultimately, a circular economy involves physically reallocating or remaking old products to serve new demands. This requires infrastructure to recover and reprocess, along with effective means to communicate across the supply chain. However, existing infrastructure and information systems have been developed in conditions of both mispriced risk and split incentives which, whether real or perceived, have limited appropriate investment. Where existing
Resource resilient UK 22
infrastructure can be readily repurposed to work in a circular economy, such as smelters being used for both primary and secondary metals, or where existing logistic networks can turn into reverse logistics networks, infrastructure barriers to the circular
What hunting rabbits can tell us about reprocessing
One of the less well known scenarios in game theory derives from a story by Jean-Jacques Rousseau. In it, a group of hunters must each decide whether to hunt a stag together, or to hunt rabbits separately. The hunters would prefer to hunt the stag but know they can only succeed if they hunt together. In contrast, rabbit hunting produces less sustenance but requires no co-operation. If the hunters trust each other, it makes more sense to hunt the stag. Deciding not to co-operate, by hunting rabbits, is worse for each individual hunter and the group as a whole.
Seemingly split incentives limiting the circular economy are a lot like this analogy. This can be demonstrated using the example of bottle to bottle plastic reprocessing, where the level of cooperation between businesses in the supply chain influences the business outcome.
The bottle collector, reprocessor and manufacturer all need to co-operate to achieve effective recycling. Each wants to procure their raw material at low cost and sell at a high price to maximise profit, but total production costs must be below the price that consumers are willing to pay.
Supply chain with co-operation
economy may be overcome at low cost. As with End of Life Vehicle regulation, even where new infrastructure must be developed at high capital cost, it may be the tipping point, unlocking value that would otherwise be uneconomic to extract.
This describes ordinary supply chain tensions which businesses are used to resolving. But for the collector and manufacturer co-operation isn’t their only route to market: both can also choose to go it alone. The bottle collector can either export their bottles, or simply consign them to Energy from Waste even though this is likely to be less valuable. Similarly, the manufacturer can substitute virgin plastic for recycled, despite the lower processing cost of recycled plastic.24 Unfortunately, the reprocessor relies on feedstock from both the collector and demand from the manufacturer, making reprocessing doubly risky. This raises the cost of finance for reprocessing infrastructure and drives up expected returns, making the benefits of co-operation seem low.
As with the stag hunt analogy,the starting point of mistrust, as exists in the plastic reprocessing and other recovery markets, creates a vicious circle where a high risk of defection leads to high prices. This undermines incentives to co-operate.25
Supply chain without co-operation
23 Resource resilient UK
Collector ReprocessorManufacturer Collector ReprocessorManufacturer Supply price Consumer Sales price Supply price Sales price Supply price Sales price
Collector ReprocessorManufacturer Supply price Export EfW Virgin materials High risk High cost Consumer Sales price Supply price Sales price Supply price Sales price Collector ReprocessorManufacturer Supply price Consumer Sales price Supply price Sales price Supply price Sales price
Material barriers
The properties of materials and products create opportunities and barriers to effective circular systems. To understand better where circular systems can be viable without intervention, the Circular Economy Task Force tested the criteria found in existing closed loop systems against a series of case studies drawn from both Task Force members and external parties. Existing closed loops are exemplified by the case studies of Rolls Royce, IBM, and Japanese appliance and IT recovery.
The analysis of these case studies and insights from Task Force members confirmed how characteristics of materials or products can amplify or help overcome market barriers to circular use. These are summarised below.
The impact of material and product characteristics on circular use
Characteristic
Value:
products or materials with high value or high end-of-life harm justify investment in recovery
Control, collection and communication:
the ability to control or reliably collect a known quantity of materials or products enables circular models
Ease of recycling, remanufacturing and reuse: circular systems are more likely where the physical characteristics of products or materials make them easy to transform
Pace of change:
If product or material function changes too rapidly, investment in recovery may not occur. This is especially an issue where material substitution, technological development, or fashion changes demand rapidly
Concentration / contamination:
Where materials are dissipated or contaminated, recovery is either more expensive or impossible
Resource resilient UK 24
Circular use likely <–> Circular use unlikely
high medium low
owner two owners many owners
single
easy moderate difficult
slow medium fast
pure / concentrated moderate contaminated / dispersed
Product or material characteristics on the left side of the table show where barriers to circularity are low and businesses should be able to design and operate circular systems on their own. Where materials or products have characteristics that fall toward the right, interventions are necessary to enable circular systems to operate.
The characteristics of different products and materials, set into this table format, show us quickly where barriers arise.
Car leasing vs preconsumer metal recycling Car
Car leasing is effective because cars are valuable, have limited owners, making communication and collection easy, are readily reusable by a second owner, and because the pace of change in car development moves slowly. Similarly, even though the value of scrap metal is not high, the fact that it is very easy to recycle, concentrated, and has few owners means preconsumer recycling is common.
Pre consumer metal recycling
25 Resource resilient UK
leasing Circular use likely <–> Circular use unlikely Value high medium low Control, collection and communication single owner 2 owners many owners Ease of recycling, remanufacturing and reuse easy moderate difficult Pace of change slow medium fast Concentration / contamination pure / concentrated moderate contaminated / dispersed
Circular
<–> Circular use unlikely Value high medium low Control, collection and communication single owner 2 owners many owners Ease of recycling, remanufacturing and reuse easy moderate difficult Pace of change slow medium fast Concentration / contamination pure / concentrated moderate contaminated / dispersed
use likely
Mobile phones: reuse vs remanufacturing
Mobile phone reuse happened when information about the value of second-hand mobiles became available, and because collection costs are low, mobiles are easy to reuse and because their basic functionality has changed little over time. In contrast, remanufacturing is rare due to design choices and the pace of change in the internal circuitry of mobiles. To make remanufacturing feasible, intervention to make phones easier to disassemble is needed. But to address the
challenge of fast change in function, the design of products like mobile phones needs to be modularised, which would would mean making components which change less quickly (eg cameras and possibly screens) easy to separate and plug back into new models with upgraded processors and RAM. This would enable components which need to change quickly to be recovered for recycling, while retaining for reuse as much of the original product as possible.
Resource resilient UK 26
Mobile phone reuse Circular use likely <–> Circular use unlikely Value high medium low Control, collection and communication single owner 2 owners many owners Ease of recycling, remanufacturing and reuse easy moderate difficult Pace of change slow medium fast Concentration / contamination pure / concentrated moderate contaminated / dispersed Mobile remanufacturing Circular use likely <–> Circular use unlikely Value high medium low Control, collection and communication single owner 2 owners many owners Ease of recycling, remanufacturing and reuse easy moderate difficult Pace of change slow medium fast Concentration / contamination pure / concentrated moderate contaminated / dispersed
4
Conclusions: how to create a resource resilient UK
27 Building a business plan for the circular economy
From product design to system design
The circular economy makes good business sense. Section 3 showed the Task Force’s analysis of the biggest barriers to making it happen. As this analysis shows, circular systems are enabled by many factors. No single intervention on its own will create the tipping point for a circular economy. It is a systems problem that needs a systems solution.
“No single intervention on its own will create the tipping point for a circular economy. It is a systems problem that needs a systems solution.”
The best route will be found through collaboration and experimentation. But successful collaboration and experimentation will require businesses and government to act in a concerted fashion to help the economy become more circular. This may mean making tough choices which impose upfront costs: redesign isn’t free, new business models fail and new infrastructure requires investment before it pays dividends. Acting now to mitigate future resource price volatility and availability risks requires long term resolve, especially at times when these drivers temporarily recede.
The overarching conclusions from the Task Force’s investigation are that interventions, made by both business and government, must:
1. clarify exposure to risk
2. facilitate co-operation
3. enable system design by addressing market and material barriers
Key recommendations
1. Clarify exposure to risk
Change, in business and in government, occurs for one of three reasons: value, fear, or force. The huge value opportunity identified in the circular economy has driven interest in it, as has the fear that resource insecurity will force businesses to adapt or die. But fear is a poor motivator unless it is related to a specific risk.
To enable businesses, investors and the government to accurately value opportunities and risks, the Task Force recommends that:
Investors should require public disclosure of high impact risks. Just as the Carbon Disclosure Project and Carbon Tracker have exposed risks that will have an impact on future returns, other resource consumption should be disclosed on companies’ risk registers so investors can avoid flawed business models. Ultimately, risks will be sector and material use specific, but reporting on water use, land use and total material use is likely to be relevant across all sectors and would be a strong place to start. Work by investors and NGOs on this issue has already started but, as with the case of carbon reporting, legislation requiring reporting to ensure a level playing field may be required, and is being considered at EU level.26
To make reporting more meaningful and move beyond the industry average data which are likely to be required initially, businesses will need to trace materials back through their supply chains. To reduce the cost and confusion involved in this, much more work will need to be done to extend the traceability mechanisms used for materials like timber and palm oil to a wider range of materials, using a standard methodology. Creating the framework and rules for such a system requires collaboration across businesses, finance and government.
Resource resilient UK 28
The government should commission a study into the UK’s risk exposure to material insecurity, drawing on existing sector engagement through the industrial strategy process. Work is already underway to understand the risks that low availability or price volatility of technical metals pose for low carbon energy technologies,27 but this is not the only sector that is vulnerable. By working through the industrial strategy process (see below), the government can engage closely with an entire supply chain to understand both material flows and identify opportunities for circular approaches.
2. Broker co-operation
As has been emphasised in this report and elsewhere, a circular economy is necessarily more collaborative. This is because decisions made at one stage of a product’s value chain affect the potential for circularity at subsequent stages.
To enable processes that bring organisations from different stages of a value chain together to develop that understanding, the Task Force recommends that:
Industrial strategy should be used to broker collaboration within business sectors. The government’s industrial strategy has developed a mode of interaction suited to circular economy collaboration: it is a sector-wide forum developing a shared strategy to capture future business opportunities, in which both government and business have responsibilities. It has already highlighted circular economy opportunities in aerospace. These opportunities should be a focus for other sector strategies as well.
To ensure the process delivers resource security benefits, it needs to broker agreement over where limitations on material choices or design decisions should be used to enable reuse, remanufacturing and advanced recycling. This would help to deliver economies of scale through consistency in end of life processing systems, as happened with milk bottle design thanks to the dairy sector’s Dairy Road-map.28
Competition law should be clarified to reinforce exemptions for environmentally beneficial co-ordination. Task Force members and external contributors have pointed to the chilling effect that competition law is having on the collaboration needed to create circular systems. In fact, competition law does not proscribe such engagement, but because the law is open to wide interpretation and potential penalties for breaching it are so high, there is a culture of fear surrounding collaboration.
Because the application of competition law is determined by judicial precedent about the
29 Resource resilient UK
public benefits of competition, the government should also work with the European Commission to set out a policy statement clarifying that the intention of competition law is not to preclude circular economy collaboration.
Alongside this, the government could expand forums which de-risk collaboration, such as the WRAP-led Courtauld Commitment, via the industrial strategy process. These work by engaging legal advisers on how to collaborate while keeping within the law.
3. Enable system design by addressing market and material barriers
The following recommendations identify how far companies can go on their own, and what government can do to help them go further.
Business interventions
To overcome market barriers in the UK, companies have pursued two different approaches to align incentives in their supply chains:
Agree long term contracts: Closed Loop London, a reprocessor; Veolia, a waste management company; and M&S, a plastic packaging user signed long term contracts to overcome material and market barriers. These contracts guaranteed minimum levels of recyclable plastic bottle feedstock at specified quality (Veolia and Closed Loop London), and minimum levels of demand for the rPET (M&S and Closed Loop London).
Closed loop plastic bottle recycling: where intervention can make an impact
Closed loop plastics recycling provides a good example of the interventions that companies can make on their own. The process which led to the production of food-grade closed loop recycled plastics involved a series of interconnected interventions: it started with an R&D process led by Boots UK and WRAP to develop the technology needed to blend post-consumer recycled polymers with virgin material and adapt the BCM UK bottle blowing plant to be able to handle this new plastic stream.29 Once the technology had been developed, because there was no readily available recycled polymer feedstock, Boots UK had to find, develop and individually quality control a supply chain of clean recycled polymer to serve its need for recycled plastic. It managed to do so from a source outside the UK at significant cost and hassle. No UK source was available because of market barriers in the UK.
Resource resilient UK 30
Value high medium low Recycling targets and consumer demand increased the value of recycling Control, collection and communication single owner 2 owners many owners Collection targets helped concentrate bottles in local authority control; contracts or joint ventures address ownership issues between reprocessing and collection or manufacturing Ease of recycling, remanufacturing and reuse easy moderate difficult R&D to enable food-grade recycling undertaken by WRAP and Boots Pace of change slow medium fast Concentration / contamination pure / concentrated moderate contaminated / dispersed Quality assured by long term contracts or by owning both collection and reprocessing
Bottle recycling Circular use likely <–> Circular use unlikely Intervention to enable a circular system
Own more of the supply chain: To help insulate it from highly volatile plastic export markets, Viridor purchased a plastics recycling plant, based in Skelmersdale. It supplies this plant with the plastic bottles it collects and transforms them into higher value rPET and rHDPE. A similar joint venture between Ecoplastics and Coca Cola has aligned the incentives for reprocessor and manufacturer.
In both cases, the companies in question are trading the flexibility of export markets for collected plastic, or virgin materials for manufacturing, for higher value opportunities. They are using the newly aligned incentives created by this structure to tackle the material contamination and concentration barriers.
This was only possible due to public intervention to target recycling and require collection. The fact that all these companies are piggybacking on already existing logistics networks points to another approach that companies can use to become more circular.
Adapt existing collection systems: this is much cheaper and more efficient than developing a new system. At its best, repurposing collection systems can be the tipping point for effective circular loops. For example, the WEEE reprocessor Environcom has made simple changes to retailer and local authority collection systems for appliances, including simply taping refrigerator doors shut to prevent drawers from falling out and being damaged in transport. This and other small changes enabled a 17 per cent reuse rate, compared to an industry average of one per cent. Similarly, Sainsbury’s now makes money by avoiding landfill because they are able to use the same system that transports products to stores to collect recyclables from them.
Limits to business circularity
These opportunities are currently available to big companies in only limited circumstances. Long term contracts contrast strongly with the waste and manufacturing sectors’ historic preference for short term or spot price contracts and require all parties involved to have strong balance sheets to be credible. Taking control of a
supply chain is even more demanding: Coca Cola is the largest user of PET plastic in the world, enabling it to move markets on its own. Similarly, although Rolls Royce has developed a closed loop for aerospace grade alloys alone, it consumes 50 of the 80 tonnes of rhenium available globally each year, making the availability of this and similar metals critical to its competitive advantage.
The lesson which can be drawn from the work of the Task Force is that information and collaboration will help leading companies to be more circular where product and material characteristics permit, but this progress is likely to be incremental and slow.
Government interventions
Ensuring the UK develops the new business models, know-how, and infrastructure for the circular economy will require the government to help business actively. The benefits are enhanced business opportunities both in the UK and abroad, and lower exposure to material insecurity. The government has a choice about how to do this.
Option 1: strengthen individual producer responsibility
One option is to adopt a version of the Japanese approach: intervening to address market barriers via strong individual producer responsibility, leaving material and product characteristic problems to businesses to solve. But, as Japan has found, this is unlikely to be enough. It has solved the problems of producer responsibility by standardising and publicly funding collection infrastructure and by requiring recovery infrastructure to be jointly owned by manufacturers. Using industrial strategy to encourage this outcome could provide a means of addressing market barriers.
Option 2: intervene to improve design
The second option is to intervene directly at the design stage to make products easier to recycle, remanufacture and reuse; to encourage modularity so different components of products can evolve separately; and to prevent
31 Resource resilient UK
Government design interventions to make circular use possible
contamination and dispersion from being designed in. If markets are to help identify the best opportunities for circular businesses, there need to be very liquid markets for secondary parts, materials and products, which can only happen if these are easy to cycle.
The mechanism to make this possible already exists in the form of the EU’s Ecodesign directive. Its implementation could be significantly improved without new legislation, and work has already been done to develop methodologies to assess products’ suitability for circular use.
Product design should enable, rather than prevent, circular systems. Requiring products and materials to be manufactured so they are easier to reuse, remanufacture and recycle rewards innovation in design, which is a UK strength. It also creates the opportunity for businesses to develop new, circular business models without telling them how to do so, or even that they must. Better design could be rewarded through a ‘feebate’ system, also known as ‘bonus/malus’, which would financially penalise products within a particular product category that are less able to be circular, and use the income from this penalty to reward products that are more able to be circular.30
Creating a tipping point
These approaches to addressing market barriers and material barriers are not mutually exclusive.
For example, there is nothing to stop companies co-operating to develop private sector design standards. Many brands already mandate certain materials or design criteria from suppliers. Those that demand better recovery options will be ahead of the game.
The interventionist approach to resource security being pursued by the UK’s competitors in Europe, Asia, and the Americas, means that lack of action could put the UK at a comparative disadvantage.
Business does not have to wait to capture some of the benefits of a circular economy. Opportunities to work with supply chains and form joint ventures are available immediately and, for the larger brands, may immediately attract investment. Once confidence is established, it will spread. The investment community can help by the way it requires information and the way it prices finance.
The language of the circular economy is becoming mainstream and resource security anxieties are becoming widespread, yet examples of successful circular approaches are still few. It is hoped that this analysis, built on the real world experiences of Task Force members, will help to illuminate how business and government action together might create the tipping point that takes us towards a more circular economy.
Resource resilient UK 32
Circular use likely <–> Circular use unlikely Regulatory interventions to enable circular opportunities Value high medium low Let market actors decide Control, collection and communication single owner 2 owners many owners Let market actors decide Ease of recycling, remanufacturing and reuse easy moderate difficult repairability, recyclability, disassemblability Pace of change slow medium fast modularity Concentration / contamination pure / concentrated moderate contaminated / dispersed disassemblability, recyclability
Draft action plan for a resource resilient UK
33 Resource resilient UK
The Circular Economy Task Force has carried out a detailed exploration over the past year into the actions and activities that would lead to a more circular approach to resource use. A circular economy will be created out of many actions at different levels, some specific to particular types of business. In addition to the key recommendations, we describe here the further actions that the Task Force also recognised as important and helpful to reducing business risk and moving the UK towards greater resource security. The Task Force’s key recommendations, described in the previous section, are highlighted here in darker green.
1. Clarify exposure to risk:
Business led:
Work with supply chain to trace materials back to source, and register relevant risks on company risk registers. See page 28 for details. Understanding risks, by using Environmentally Weighted Material Consumption (EMC) for example, helps companies to understand which circular strategies cut their risks most. However, tracing supply chains is resource intensive, which may limit interest.
Make disassembly instructions and bill of materials data available. This information enables others to understand what materials are in products and how to recover them. This would be in line with the recommendations of the European Resource Efficiency Platform (EREP) on ‘product passports’. However, companies that have already started down this route have been those where the physical product is tangential to their primary business model. Examples include Google, which has made its Nexus 7 tablet repairable, and Facebook, which has adopted an open standard for its datacentres. Both companies make money from their software ecosystem, rather than their physical products.
Investor led:
Require disclosure by companies of high impact risks on water, land, and materials use in company reports to investors. See page 28 for details.
Price in benefits where secondary material use reduces exposure to price volatility, for instance by adjusting interest rates for capital expenditure.
Government brokered: Conduct a government led study into the exposure to material insecurity, starting with sectors identified by the industrial strategy as those most able to contribute to growth. See page 29 for details
Use the collaborative approach trialled in the recent industrial strategies to increase voluntary disclosure of bill of materials and disassembly instructions. Working across a sector or supply chain derisks information disclosure.
Government mandated:
Require Environmental Product Declarations (EPDs) based on a unified methodology, such as the Product Environmental Footprint (PEF), across the EU, if businesses don’t voluntarily disclose bill of materials data. The prevalence of EPDs in the construction sector shows this is possible, but agreeing a common methodology is time consuming, and data collection may be expensive. As such, this should only be used as a backstop.
Resource resilient UK 34
2. Broker co-operation
Business led:
Collaborate in relation to high profile risks eg Roundtable on Sustainable Palm Oil. Where companies are aware of a material risk but there is currently no lower risk circular source of the material, they can work with suppliers to develop such a source or increase aggregate demand for such a source by agreeing a future procurement commitment with like-minded companies. There is a danger, however, this will only be done by very large, highly motivated single companies or in response to high profile campaigns
Government brokered: Create sector specific road maps using the industrial strategy model for government and industry collaboration, piloted through the delivery phase of existing industrial strategies. See page 29 for details.
Government mandated:
Push the European Commission to clarify competition law to reinforce exemptions for environmentally beneficial co-ordination. See page 29 for details.
35 Resource resilient UK
3. Enabling system design
Intervening to enable a system to be designed means addressing the material and market barriers that prevent particular materials or products from being more circular. The recommendations in this section are organised according to how interventions by business, investors or government can address these barriers.
Value: products or materials with high value or high end-of-life harm justify investment in recovery
Business led:
Procure based on total cost of ownership (or pay more for circular products). Products that have been designed for reuse and ease of disassembly often last longer, are more easily repaired and have a higher end-of-life value. Procurement systems should take these lower lifetime costs into account when choosing between products.
Government brokered:
Develop quality standards for secondary materials to facilitate commoditisation, such as PAS 141. The lack of an agreed standard for different grades of recycled material reduces reprocessors’ willingness to pay higher prices for higher quality material as it has to be taken on trust. There is therefore little incentive to invest in improving the quality of recyclate. The government should work with industry in developing a set of agreed standards for secondary materials following a similar process as was used for the development of the PAS141 standard on reuse.
Government mandated:
Adapt producer responsibility schemes to reward users of recycled materials by reducing their obligated tonnage. To increase demand for recycled materials, manufacturers that use such materials should be rewarded with a reduction in the weight of material they are required to prove has been recycled/recovered.
Control, collection and communication: the ability to control or reliably collect a known quantity of materials or products enables circular models
Business led:
Contract for long term supply and demand of secondary materials. See page 30 for details
Own more of the supply chain eg Coca Cola and ECO plastics JV; Viridor remelt plant. See page 31 for details.
Piggyback reverse logistics on existing systems, preserving the ability of products to be reused or repaired. See page 31 for details.
Investor led:
Expand risk sharing finance schemes for reprocessing/remanufacturing infrastructure, using tools like public private partnerships or the Green Investment Bank. In speaking to the finance community, it emerged that the majority of waste infrastructure has been financed through municipal contracts. These contracts remove feedstock risk, leaving market risk for recyclate as
Resource resilient UK 36
the main risk for infrastructure investors. As part of wider measures to reduce the difficulty of reprocessing, the government should ensure that risk sharing finance is available to bring down the cost of borrowing.
Government brokered:
Expand risk-based enforcement of waste handling regulations to enable possible reverse loops, such as the Tesco TV take back scheme and the use of charity shops as WEEE handlers. Waste handling regulations have been developed to prevent irresponsible and environmentally damaging disposal of wastes, but should also facilitate companies trying to use existing logistics systems to get products into reprocessing systems.
Government mandated: Implement strict Individual Producer Responsibility. See page 31 for details.
Set collection and disassembly requirements for products containing critical materials. For bulky or industrial items containing critical materials, such as electric motors, a high collection requirement may be simple to implement. But because many critical materials are dispersed in small WEEE, requiring greater capture must be accompanied by measures to make collection infrastructure much easier to access. This could involve expanding take back requirements to cover store delivery and internet retailers.
Use landfill bans as the intervention of last resort for high volume, low value materials, such as textiles, food, and perhaps plastics. Landfill bans need to be accompanied by policies to ensure that materials are recovered, such as a requirement to sort, and be introduced with enough lead time to enable appropriate alternative infrastructure to be built.
Ease of recycling, remanufacturing and reuse: circular systems are more likely where the physical characteristics of products or materials make them easy to transform
Business led: Use standards for reuse and remanufacturing (such as PAS 141). To increase both business and consumer trust and demand for reused/remanufactured goods, companies should use certified processes that ensure their quality.
Government brokered:
Develop collection standards for reusability. Poor handling of end-of-life products can limit their reuse potential. People involved in end-of-life collection systems for appliances should be trained to ensure that the way they handle appliances maximises reuse potential. As with quality standards above, the government should work with industry to develop guidance on how to manage WEEE collections to maximise reusability.
Initiate dialogue to limit the use of materials, eg the Dairy Roadmap. This would be a brokered discussion following the same principles as those set out above on using industrial strategy type processes to increase the recyclability of materials on a sector by sector basis.
Set green public procurement rules specifying more circular products. Government buying standards should require minimum disassemblability and recyclability standards for products, and specify that a minimum proportion of products come from a reused/remanufactured source.
37 Resource resilient UK
Government mandated:
Require repairability, recyclability, disassemblability via ecodesign or incentives (bonus/ malus). See pages 31 and 32 for details.
Set minimum reuse/recycling targets, such as those set through End of Life Vehicles (EoLV) legislation. Minimum reuse/recycling targets achieve the same ends as ‘ability’ metrics but in a more prescriptive way.
Mandate quality sampling and reporting for recycled materials as part of the Materials Recovery Facility (MRF) Code of Practice. The MRF regulations should require MRF operators to sample the materials they send on to reprocessors and report on contamination rates. The sampling technique needs to be sufficiently robust to reassure reprocessors of quality and should be refined in the light of reprocessor feedback on quality if necessary.
Pace of change: If product or material function changes too rapidly, investment in recovery may not occur. This is especially an issue where material substitution, technological development, or fashion changes demand rapidly
Government mandated:
Require modularity via ecodesign or incentives (bonus/malus). See pages 31 and 32 for details.
Concentration / contamination: where materials are dissipated or contaminated, recovery is either more expensive or impossible
Government brokered:
Use local authority association collaboration to deliver infrastructure at the right scale. Waste collection and processing is currently based around the geography and scale of the local authorities responsible for delivering the services. The system should instead be organised around the scale best suited to high value recovery. Such an approach is likely to deliver more value to local authorities, but may require higher upfront investment or more uncertainty about costs. Local authority associations, such as the Local Government Association, Local Authority Recycling Advisory Committee and National Association of Waste Disposal Officers, can help to match the processing systems with the characteristics of the materials by brokering collaboration between neighbouring authorities on collections systems and disposal infrastructure. Such collaborations would be helped by an analysis of what infrastructure is best for treating a material at a particular scale.
Government mandated:
Require disassemblability, recyclability via ecodesign or incentives (bonus/malus).
See pages 31 and 32 for details.
Set disassemblability requirements for products containing critical materials.
Resource resilient UK 38
Endnotes
1 B Lee, F Preston, J Kooroshy, R Bailey and G Lahn, 2012, Resources futures, Chatham House, www.chathamhouse.org/ sites/default/files/public/Research/Energy,%20 Environment%20and%20Development/1212r_ resourcesfutures.pdf
2 Food, metals, and inflation rate data derived from IndexMundi data; plastics data from Plastics Information Europe.
3 International Energy Agency, 2012, World Energy Outlook 2012, www.iea.org/publications/freepublications/ publication/English.pdf
4 C P Fenton, J D Waxman, 2011, ‘Commodity Markets Outlook and Strategy’, JPMorgan Chase Bank NA, http://papers.ssrn. com/sol3/papers.cfm?abstract_id=1922759
5 N Beveridge, O Clint, B Brackett, S Gruber, L Wang, 2012, ‘Bernstein Energy: Era of cheap oil over as secular growth in upstream cost inflation underpins triple digit oil prices’, BernsteinResearch, http://xa.yimg.com/kq/ groups/18821650/766363617/name/Bernstein+Energy-+Era+ of+Cheap+Oil+Over+As+Secular+Growth+in++Upstream+Cost +Inflation+Underpins+Triple+Digit+Oil+Prices_87626.p
6 Data source: Bernstein Research
7 M Miranda and A Sauer with contributions by D Shinde, 2010, Mine the gap: connecting water risks and disclosure in the mining sector, World Resource Institute, http://pdf.wri. org/working_papers/mine_the_gap.pdf and Cochilco, 2009, ‘Consumption of water in the Chilean mining industry: actual situation and projections’
8 ACCA, Fauna & Flora International and KPMG, 2012, Is natural capital a material issue?, www.kpmg.com/UK/en/ IssuesAndInsights/ArticlesPublications/Documents/PDF/Tax/ natural-capital.pdf
9 Trucost Plc for the UNEP Finance Initiative and the UN Global Compact, 2010, ‘Universal Ownership – Why environmental externalities matter to institutional investors’, www.unepfi.org/fileadmin/documents/universal_ownership. pdf
10 Analysis by WRAP
11 Global Business Reports, 2012, ‘Mining in Chile – The engine that moves Chile forward’, Engineering & mining journal, www.gbreports.com/admin/reports/EMJ-Chile2012. pdf
12 M Miranda and A Sauer with contributions by D Shinde, 2010, ‘Mine the gap: connecting water risks and disclosure in the mining sector’, World Resource Institute, http://pdf.wri. org/working_papers/mine_the_gap.pdf and Cochilco, 2009, ‘Consumption of water in the Chilean mining industry: actual situation and projections.’
13 J Farchy, 2013, ‘Copper miners forecast years of surplus’, Financial Times, www.ft.com/cms/s/0/c48475f6-a1f6-11e28971-00144feabdc0.html#axzz2UhRbxkj6
14 C Sartain, 2011, ‘Sustainable copper production and technological innovation: managing the challenges of Andean mining,’ presentation to Austmine 2011, www.xstratacopper. com/EN/Publications/Presentations/Sustainable%20 copper%20production%20and%20technological%20 innovation,%20managing%20the%20challenges%20of%20 Andean%20mining.pdf
15 See G M Mudd, 2004, ‘One Australian perspective on sustainable mining: declining ore grades and increasing waste volumes’, Taylor & Francis Group, http://users.monash.edu. au/~gmudd/files/2004-TMW-SustainableMining.pdf and andT Norgate, S Jahanshahi, 2011, ‘Reducing the greenhouse gas footprint of primary metal production: where should the focus be?’, Minerals engineering v 24 (14), www.deepdyve.com/lp/ elsevier/reducing-the-greenhouse-gas-footprint-of-primarymetal-production-ZMnuM0Fm6b?&signup-confirm=freemium
16 Source: K Halada, 2011, Global environmental issues: urban mining and element strategy, National Institute for Materials Science
17 For further information about section 1502 of the Dodd-Frank Act, which deals with conflict minerals, see Ernst & Young, 2012, ‘Conflict minerals – What you need to know about the new disclosure and reporting requirements and how Ernst & Young can help’, www.ey.com/Publication/vwLUAssets/ Conflict_minerals/$FILE/Conflict_Minerals_US.pdf
18 H Hawksley, 2012, ‘US law’s positive impact on Africa – Dodd-Frank Act deters US firms from using conflict minerals in supply chains’, YaleGlobal, http://yaleglobal.yale.edu/ content/us-law-positive-impact-africa
19 UNEP, 2009, From conflict to peacebuilding – the role of natural Resources and the environment, www.unep.org/pdf/ pcdmb_policy_01.pdf
20 See BNEF, ‘Renewable energy now cheaper than new fossil fuels in Australia’, http://about.bnef.com/press-releases/ renewable-energy-now-cheaper-than-new-fossil-fuels-inaustralia/
21 www.lcmp.eng.cam.ac.uk/wp-content/uploads/ allwood-and-cullen-r09-davos.pdf J M Allwood, J M Cullen, 2009, ‘Steel, aluminium and carbon: alternative strategies for meeting the 2050 carbon emission targets’, www.lcmp.eng. cam.ac.uk/wp-content/uploads/allwood-and-cullen-r09davos.pdf
22 The table draws on lifecycle analysis data to begin to identify which risks apply to different groups of materials. Because LCA data is sometimes incomplete and has significant margins of error, these groupings are provisional.
23 L Goodwin, 2012, ‘Sustainability Live’, www.wrap.org.uk/ sites/files/wrap/Liz%20Goodwin%20Sustainability%20 Live%20speech%20May%202012.pdf
24 The Task Force received evidence that the collection, sorting, shredding, washing, remelting and pelletising of food grade HDPE and PET should be approximately 30% cheaper than virgin PET and HDPE, though the level of contamination in these feedstocks may affect the price.
25 See for example K Clark, S Kay and M Sefton, 1997, ‘When are Nash equilibria self-enforcing? An experimental analysis’, http://128.118.178.162/eps/exp/papers/9707/9707001.pdf and M Büyükboyacı, 2012, ‘Risk Attitudes and the Stag-Hunt Game’, http://hss.caltech.edu/~muruvvet/staghunt.pdf and K Madani, 2010, ‘Game theory and water resources’, Journal of Hydrology 381, p. 225–238, www.heesa.cece.ucf.edu/ Kaveh/8.pdf
26 See, for example, the call from the European Resource Efficiency Platform, 2013, ‘Action for a resource efficient Europe’, http://ec.europa.eu/environment/resource_ efficiency/documents/action_for_a_resource_efficient_ europe_170613.pdf
39 Resource resilient UK
27 Via forthcoming work undertaken by the Energy Research Partnership, ‘The potential impact of resource constraints on UK energy innovation and system development to 2050 –Minerals: policy summary’.
28 The Dairy Roadmap sets a framework for the dairy industry to collaborate to reduce its environmental impact. Part of this process has been agreeing to standardise materials used in milk bottles, and increase their recyclability by limiting the additives used in the bottles.
29 For further information, see WRAP’s description of this case study, www.wrap.org.uk/sites/files/wrap/Using%20 recycled%20content%20in%20plastic%20packaging%20 the%20benefits.pdf
30 In the context of WEEE or other product groups with producer responsibility schemes, this approach would involve the Environment Agency applying an increase or decrease to the amount of WEEE that producers were required to recycle, based on how well their products performed in tests of their circular abilities e.g. disassamblability, recyclability, modularity etc. For companies that had the greatest circular abilities, a reduction of, say, up to 20 per cent of their obligated tonnage could be applied. Companies that produce products that are difficult to recover would see their obligated tonnage increased by up to 20 per cent. A fuller explanation of how this might work in the case of WEEE can be found in section 9.5 of IPR Working Group, 2012, ‘Waste Electrical and Electronic Equipment (WEEE) Regulations: Individual Producer Responsibility (IPR) in a UK context’, www.gov.uk/government/ uploads/system/uploads/attachment_data/file/34569/121007-waste-electrical-and-electronic-weee-regulationsindividual-producer-ipr-responsibility.pdf
For product categories without any producer responsibility requirements, such as textiles, the approach could be implemented through a self-financing charge/discount on the sale price, as happens for vehicles in France based on their CO2 emissions. The precise policy design would need to ensure regular updates to the charge or discount to ensure it remained self-financing. The scheme would also need to avoid the fate of the Carbon Reduction Commitment, which began as a cost neutral, revenue-recycling mechanism, but was reformed to become an undifferentiated tax.
40 Resource resilient UK
41 Resource resilient UK
Green Alliance
36 Buckingham Palace Road
London SW1W 0RE
T 020 7233 7433
ga@green-alliance.org.uk
www.green-alliance.org.uk
blog: greenallianceblog.org.uk
twitter: @GreenAllianceUK
The Green Alliance Trust
Registered charity no. 1045395
Company limited by guarantee (England and Wales) no. 3037633
Registered at the above address