
8 minute read
4. Namie and Okuma exclusion zone survey results


4
Namie and Okuma exclusion zone survey results
The global standard for radiation exposure is set by the International Commission for Radiation Protection (ICRP). The maximum recommended exposure for the general public was one milliSievert per year (mSv/y), and this was applied by the Japanese government until 2012. However, as result of the contamination of Fukushima prefecture by the nuclear disaster, these levels were exceeded. As part of its strategy to lift evacuation orders, the Japanese government in April 2012 increased the maximum recommended annual exposure to twenty (20) mSv/y. 1
Before the March 2011 Fukushima Daiichi nuclear disaster, the average radiation levels in Fukushima prefecture were 0.04 μSv/h. In March 2012, the Japanese government set a long-term decontamination target of 0.23 μSv/h, which they calculate (if attained) would lead to a maximum annual exposure of 1 mSv. However, as this survey report and earlier Greenpeace Japan surveys have shown, in many areas of Fukushima, in particular in Iitate, Namie, and Okuma, the levels far exceed 0.23 μSv/h. The government, nine years after the start of the disaster and after 2.8 trillion yen assigned to its decontamination program, has still failed to provide any timeframe for when it thinks it will reach the 0.23 μSv/h target. As our 2018 report detailed, in some cases it will be well into the 22nd century and beyond when levels in some areas will reach 0.23 μSv/h, which remains nearly six (6) times higher than background levels pre-March 2011.
Namie exclusion zone House of Ms. Kanno
The home of Ms. Kanno is located in Shimo-Tsushima in the district of Namie, 30 km west-northwest of the Fukushima Daiichi nuclear plant. It was subjected to significant radiation contamination resulting from the March 2011 nuclear accident. The government selected Ms. Kanno’s house for demonstrating its decontamination techniques and her home was subjected to considerable effort during December 2011 and February 2012. Greenpeace conducted its first radiation survey at the home of Ms. Kanno in September 2017, with a follow up survey in October 2018. In October 2019, we returned to Ms. Kanno’s home with a focus on the immediate area around the house, as well as on the family’s farmland and forest.
Overall, the weighted average recorded in October 2019 was 0.9 μSv/h for the seven zones measured, compared with 1.3 μSv/h for the four zones measured in 2018 (Table 1). Maximum levels in October 2019 were 2.2 μSv/h compared with 5.9 μSv/h in 2018, and 5.8 μSv/h in 2017.
There are significant variations that cannot be explained either by radioactive decay or by further official decontamination. Overall, the four zones for which we have data from 2018 and 2019, show a reduction of 31% on the average levels in a year, which is significant, compared with a zero reduction between 2017 and 2018. One plausible explanation for this contrast may be the absence of major rainfall comparable with Typhoon Hagibis, which struck Japan in October 2019, during the year preceding our 2018 survey. An explanation for the significant reduction in both the average and maximum levels for all zones can be found in zone 9, the path to the rice field. Here the average radiation measurement declined from 1.6 μSv/h in 2018 to 1.1 μSv/h in 2019, and the maximum declined from 5.9 μSv/h to 2.1 μSv/h in the respective years. The question is: why this reduction in this zone? Greenpeace Japan’s analysis indicates that the lower radiation levels measured in 2019 very possibly could be the result of the very high rainfall experienced during Typhoon Hagibis.
Annual radiation dose rates for 30% of the areas measured at Ms. Kanno’s house (Table 2) could lead to an exposure between 5-10 mSv/y based on Japanese government methodology and between 8-17 mSv/y based on sustained exposure over one full year. 2 The International Commission on Radiological Protection (ICRP) recommendation for the public sets the maximum additional recommended dose at 1 mSv/y. 3 100% of the 3,722 measuring points exceeded the government’s current long-term radiation target level of 0.23 μSv/h. In zone 1, which is in the immediate vicinity of the house (within 5-10 meters) and where workers had conducted decontamination, radiation levels were on average 0.5 μSv/h in 2019, compared to 0.6 μSv/h in 2018.
Diagram1: Schematic of Ms. Kanno’s house in Shimo-Tsushima, Namie exclusion zone, Fukushima prefecture, showing the designated Zones for the Greenpeace radiation survey team.
Rice field North
6
9
Path to rice field North
Around house
< = 2 and > =1.5μSv/h < 1.5 and > =1 μSv/h < 1 and > = 0.5μSv/h
Gray areas are zones not measured in 2019
9
5
Forest behind house
1
2
Farmland
4
Garden and farmland
Road
3
8
Rice field, South
7
Around warehouse and path
The house itself is surrounded on three sides by forest which has grown extensively since 2011. The survey results in zone 5 (see Table 1), a forest area just behind the house, reveal the limited impact of decontamination as well as variations in radiation levels for which there are no obvious explanations. The average of the radiation levels measured in zone 5 were 1.5 μSv/h, with peak levels of 2.2 μSv/h in 2019 (compared with 2.0 μSv/h and 2.4 μSv/h in 2018 respectively). The 25% reduction in the average level in zone 5 cannot be explained either by radiation decay or decontamination. The possibility of a heavy rainfall effect due to Typhoon Hagibis requires further analysis by Greenpeace and other scientific bodies.
Table 1 : Breakdown of doserate in all Zones at Ms. Kanno house (walking on- and off-road, height 1m), 2017 - 2019.
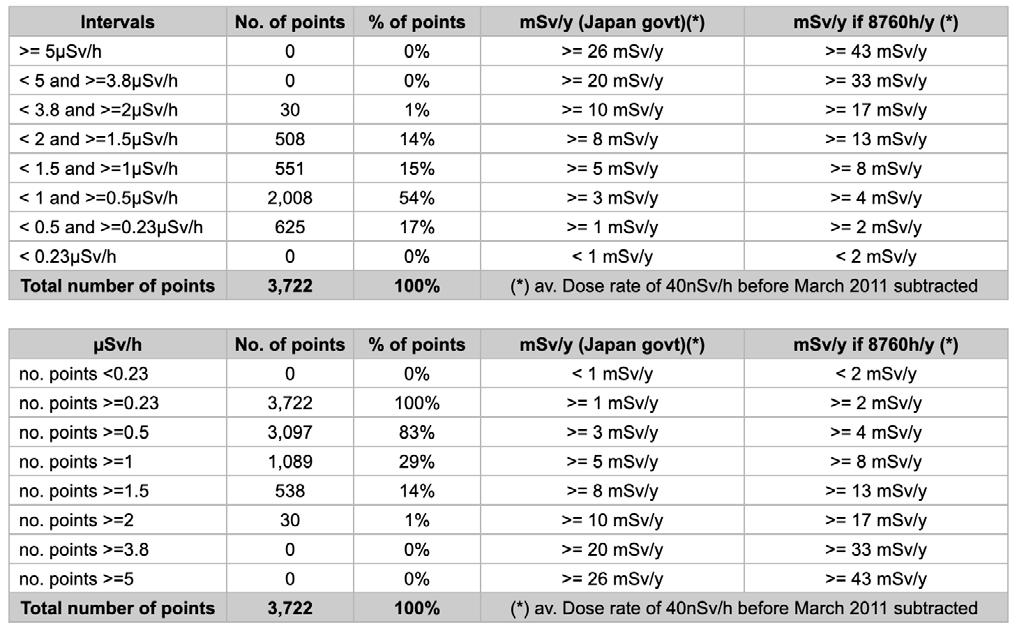
Table 2 : Radiation in all Zones at Ms. Kanno’s house (walking on- and off-road, height 1m), October 24, 2019.
House Z
Located 25 km northwest of the Fukushima Daiichi plant, the survey of House Z in October 2019 revealed, as in earlier years, very high levels of contamination, including hotspots. Greenpeace Japan did not conduct a survey at House Z in 2018, so this was our first return to this site since 2017. The overall average for all zones shows a decline from 3.3 μSv/h in 2017 to 2.4 μSv/h in 2019, with a similar decline from the maximum in 2017 of 8.2 μSv/h to 6.8 μSv/h in 2019. The average levels in zone 2 of House Z, which is in front of the house, were 3.0 μSv/h; with a maximum level of 6.1 μSv/h. 6% of annual radiation dose rates in Zone 2 would be in excess of 20 mSv/y (based on Japanese governmental methodology), and 33 mSv/y based on sustained exposure over one full year. For 70% of the whole area around House Z, the dose rates were in excess of 10 mSv/y (based on Japanese governmental methodology), and 17 mSv/y based on sustained exposure over one full year.
In zone 5, around a warehouse of House Z, the average 2019 readings were 2.5 μSv/h compared with 3.4 μSv/h in 2017, with a 2019 maximum level of 6.8 μSv/h compared with 8.2 μSv/h in 2017.
In zone 6, along Route 114, an average of 2.1 μSv/h was measured in 2019 compared with 2.71 μSv/h in 2017, and a 2019 maximum level of 5.3 μSv/h compared with 7.3 μSv/h in 2017. It should be noted that this is a higher maximum reading than the road scanning conducted both by the Japanese government and by Greenpeace Japan, due to the fact that this is based on a walking scan at an altitude closer to ground.

Table 3 : Breakdown of doserate in all Zones at House Z (walking on- and off-road, height 1m), 2017 and 2019.
Walking scan in Namie exclusion zone. Novermber 1, 2019


Table 4 : Radiation in all Zones at House Z (walking on- and off-road, height 1m), November 1, 2019.
Okuma exclusion zone
The Japanese government has opened a small area of Okuma following decontamination, but much of the area remains within the exclusion zone.
A citizen of Okuma requested that Greenpeace survey their family home, which lies in the exclusion zone of Okuma at a distance of 7.5 km from Fukushima Daiichi. This is our first review at this location, with the intention of returning in 2020. The average dose rate for the 3,263 points at House X was measured at 1.1 μSv/h with a maximum of 4.2 μSv/h. 56% of points were over 1 μSv/h and 100% of the 3,263 points measured were above the government decontamination target of 0.23 μSv/h. These were not the highest levels of contamination measured in Okuma.
Within meters of the new Ono train station, which was under construction during the time of our 2019 measurements in Okuma, we found radiation hotspots of 6 µSv/h at 1 m and 41 µSv/h at 10 cm. In the newly opened area of Okuma, near the new town hall and within a few hundred meters of the planned route for the Olympic torch, we measured radiation hotspots of 1.5 µSv/h at 1 m and 2.5 µSv/h at 10 cm in the small forest.
Dose rate (µSv/h)
< 0.1
< 0.25and > =0.1
< 0.5and > =0.25
< 0.75and > =0.5
< 1 and > =0.75
< 2and > =1
< 5and > =2
< 10and > =5
< 50and > =10

Map data © 2020 Image © 2020, Maxar Technologies
Image 1: Aerial image of hotspots in Okuma, near Ono station (November 2, 2019) Made from Google Maps
Table 5 : Breakdown of doserate in all Zones in Okuma (walking on- and off-road, height 1m), 2019.


Table 6 : Radiation in all Zones in Okuma (walking on- and off-road, height 1m), November 2, 2019.


