8 minute read
5. Lifted evacuation areas - Namie and Iitate
5
Lifted evacuation areas - Namie and Iitate
On 31 March 2017, the Japanese government lifted the evacuation orders for areas in Namie Town and Iitate Village, which lie north and northwest of the Fukushima Daiichi nuclear plant, and are not in the “Difficult to Return” zone. In March 2011, the populations of Iitate and Namie districts were 6,509 and 21,434 respectively. 4 As of 31 January 2020, the population of Namie was 1189 (compared with 896 in 2019), and the population of Iitate, as of 1 January 2020, was 1,392 (compared with 1,003 as of 1 February 2019).
Greenpeace Japan conducted radiation surveys in Namie and Iitate in 2011; we resumed survey work in Iitate in 2015 and have revisited each year subsequently. In September 2017, Greenpeace Japan extended its survey to the central area of Namie Town where the majority of the population formerly lived. As with the results of our surveys in Iitate conducted in 2015, 2016, and 2017, we found that as of October 2019 radiation levels in the area of Namie where the evacuation order has been lifted are still significantly higher than the government’s current long-term target level of 0.23 μSv/h.
As confirmed in our survey of these open areas, radiation exposure for people returning to Namie and Iitate would, in some cases, be well in excess of the recommended maximum of 1 mSv/y. The Japanese government maintains that exposure up to 20 mSv/y is acceptable in these lifted evacuation order areas. This is despite clear scientific evidence of the cancer risks from low dose radiation exposure in the 1-5 mSv/y range, which the Japanese government continues to disregard. 5
Namie Town
The town of Namie lies 10 km north-northwest of the Fukushima Daiichi nuclear plant, and has clearly undergone extensive decontamination between 2014 and 2017. However, in areas surveyed by Greenpeace Japan in 2019, this decontamination has clearly failed to reduce radiation levels to the government’s current long-term target of 0.23 μSv/h.
The Takase river, which flows through Namie, acts as a crossing point between the publicly open area and “Difficult to Return” zone of Namie.
Takase river
At the Takase river, near the hamlet of Tawatsuda, we extended our survey further than in previous years. This is in an area of Namie where the evacuation order was lifted in March 2017. Radiation levels in this area are consistently above the Japanese government’s 0.23 μSv/h long-term target. Along the river bank and road where we measured 5,581 data points, levels averaged 0.8 μSv/h with maximum of 1.7 μSv/h, with 99% exceeding the government’s long term decontamination target. These average levels are twenty (20) times higher than the pre-2011 background level of 0.04 μSv/h.
For Zone 1 of the Takase river survey (the path along the river), levels in 2019 matched those of 2018, with an average of 0.7 μSv/h and maximum of 1.5 μSv/h. It was not possible to accurately measure zone 2 as in 2018, due to deforestation work underway. Instead, we proceeded to measure along a slope by the bank of the river. Measurements along the river showed higher levels than on the higher roadway above, and there were indications of hotspots due to possible recontamination. The Takase river, like all the rivers of Fukushima, experienced major flooding in October 2019, leading to a major flux of radioactivity moving through the waters of Fukushima Prefecture. It is worth noting that directly upstream from this area lies one of the most contaminated areas in the Namie exclusion zone, Obori Village. The Takase river passes directly through Obori Village.
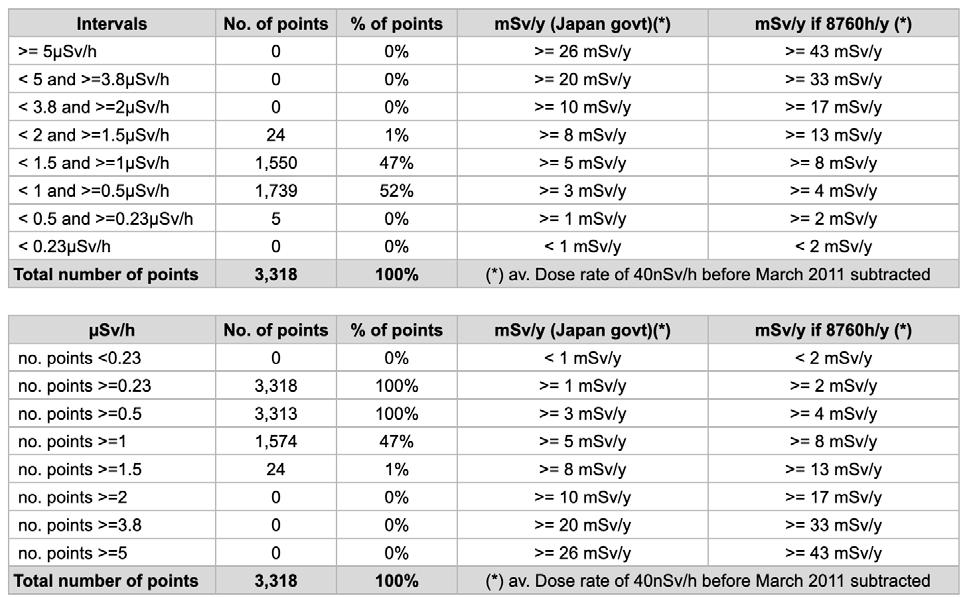
In 47% of the area along the river bank slope, in the publicly accessible area of Namie Town surveyed in October 2019, radiation levels would give an annual radiation dose between 5-8 mSv/year (based on the revised Japanese government methodology) and between 8-13 mSv based on full exposure over one year.
Survey along Takase river, Fukushima prefecture. October 24, 2019

Table 7 : Breakdown of doserate in all Zones in Takase river (walking on- and off-road, height 1m), 2019.

Table 8 : Radiation in all Zones in Takase river (walking on- and off-road, height 1m), October 29, 2019.
Namie kindergarten and school
Greenpeace Japan first surveyed a kindergarten and school in Namie in 2017 when we investigated radiation levels, including in a small forested area adjacent to the school.
In our October 2019 survey the average radiation level in the forested area adjacent to the school, was 1.6 μSv/h, compared to 1.8 μSv/h in 2018; and with a maximum of 2.3 μSv/h compared to 2.9 μSv/h in 2018. These radiation levels remain much too high or any area that has been declared open for human settlement, let alone a place where children are likely to gather.
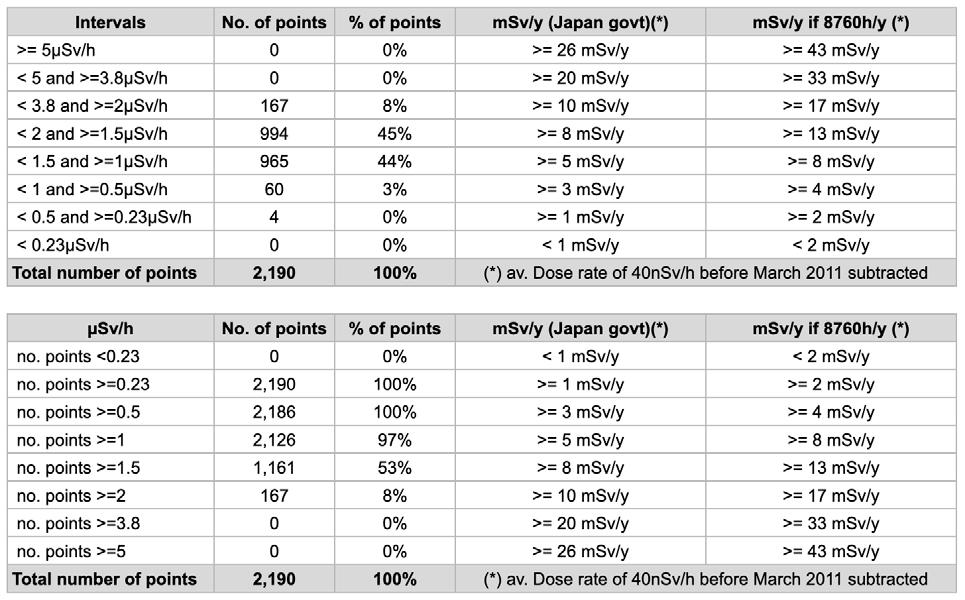
In 45% of the recently surveyed area around the school, the annual dose would be between 8-10 mSv based on the Japanese government methodology and between 13-17 mSv based on sustained exposure over a full year. For 8% of the forested area, the annual dose would be between 10-20 mSv based on the Japanese government methodology and between 17-33 mSv based on sustained exposure over a full year. 100% of the 2,190 points measured in 2019 exceeded the Japanese government’s long-term decontamination target of 0.23 μSv/h.

Table 9 : Breakdown of doserate in Namie school (walking on- and off-road, height 1m), 2019.

Table 10: Radiation in Namie school (walking on- and off-road, height 1m), October 29, 2019.
Mr. Anzai’s house in Iitate village
Since 2015, Greenpeace Japan has been conducting radiation surveys at the house of Mr. Toru Anzai, which is located in the south-east of Iitate, 35 km from the Fukushima Daiichi nuclear power plant. Mr. Anzai was evacuated from his home on 24 June 2011. Mr. Anzai’s house and the surrounding area were subjected to extensive decontamination by the authorities during the 2014- 2015 period. This involved scraping away a layer of more than 5 cm of topsoil, which was then removed from the site and stored as radioactive waste. In some cases, the surface was covered with uncontaminated soil. The survey results from Mr. Anzai’s house in 2015-2019 are shown in Tables 11 and 12.
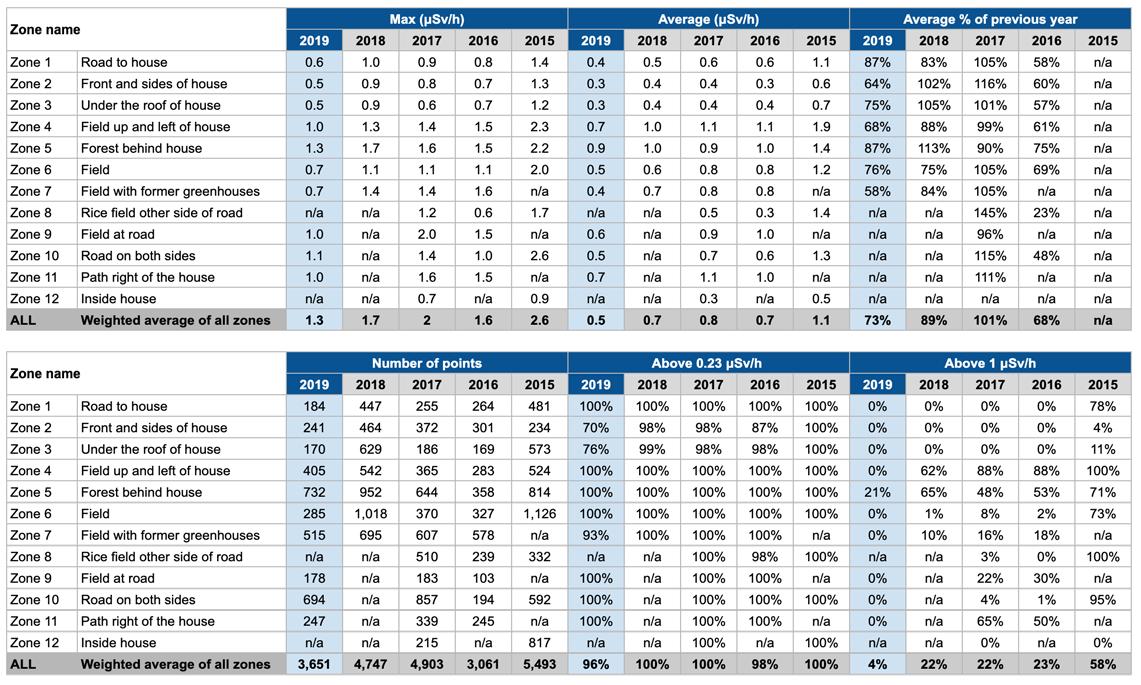
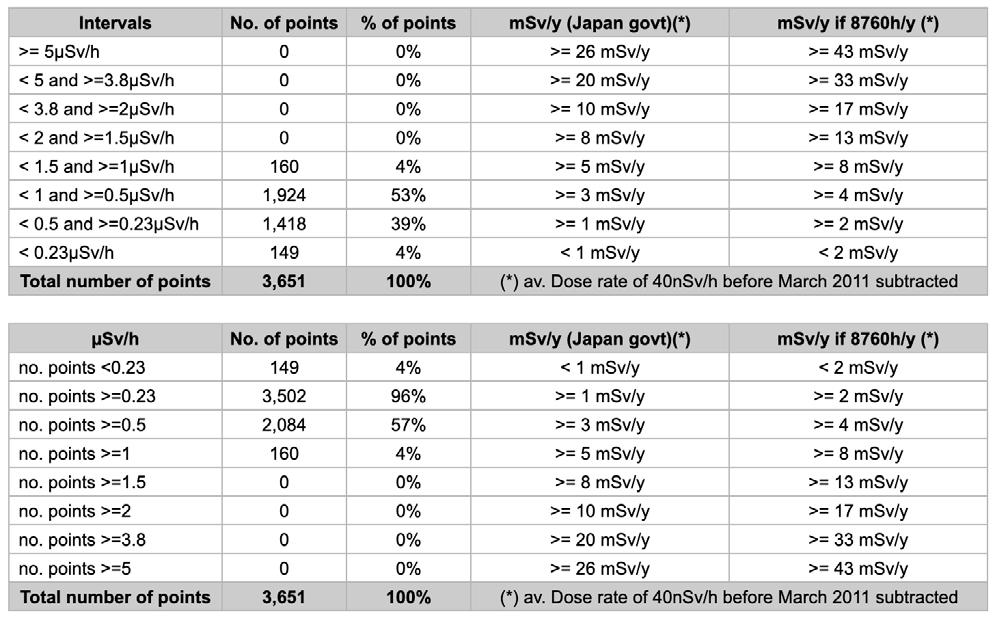
Readings at Mr. Anzai’s house were taken at a total of 3,651 measurement points in October 2019. When conducting the survey in October 2015, decontamination work was still in progress, which led us to conclude in 2016 that the measured decrease was a combined effect of further decontamination, decay, and erosion.
In October 2019, while there has been a noticeable decline in the overall average radiation level for all zones, 100% of all measurements in seven of the ten zones still exceeded the government target of 0.23 μSv/h. In 2018,
the average was 0.7 μSv/h whereas the level measured in 2019 was 0.5 μSv/h, a 29% reduction. For the maximum levels of radiation observed, there was an even wider variation with levels measured at 1.3 μSv/h in 2019 compared with 1.7 μSv/h in 2018, a 24% decline. Levels recorded in 2016 and 2017, after the completion of decontamination in 2015, had mostly remained stable. The decline in radiation levels cannot be explained by radioactive decay alone, and indicates a weathering effect perhaps due to the heavy rainfall of Typhoon Hagibis.
In earlier years we noted that decontamination efforts had been much less effective in zone 5. A similar problem was experienced by houses in Iitate which are also located in close proximity to hillside forests, where decontamination is not possible. As is standard practice throughout the contaminated regions, an area up to 20 meters from Mr. Anzai’s house into the forest has been ‘decontaminated’. In 2019, we measured the levels in Zone 5 at an average of 0.9 μSv/h and a maximum of 1.3 μSv/h compared to 1.0 μSv/h and 1.7 μSv/h, respectively, in 2018. The radiation levels on the steep slopes close to houses are crucial as they have a direct impact on the radiation levels inside houses. We can also expect that radioactivity from the non-decontaminated forest might re-contaminate the already decontaminated area below and closer to houses. In the case of Mr. Anzai, his house was demolished in 2018 and there are currently no plans to rebuild at this location.
The most noticeable variation in levels between 2018 and 2019 were in zone 4 and zone 7, both are agricultural fields that were subjected to decontamination in 2015. Average radiation levels in 2019 were 68% and 58% of the previous year (see Table 11). This cannot be explained by radioactive decay alone, and suggests resuspension and weather related effects resulting from heavy rainfall. These significant changes are particularly evident when examined across the five year period for which we have data. Our return to Mr. Anzai’s land in October 2020, in the absence of further heavy rainfall, will provide us a means to confirm the cause of these significant variations in dose rates.
For 57% of the area at Mr. Anzai’s land, dose rates would be in excess of 3 mSv/y based on Japanese government methodology, and 4 mSv/y based on sustained exposure over one full year. For 4% of the area, radiation exposure would be in excess of 5 μSv/y based on Japanese government methodology, and 8 mSv/y based on sustained exposure over one full year.
Diagram2: Schematic of Mr. Anzai’s house in Iitate, showing the designated Zones for the Greenpeace radiation survey team.
Inside house
Forest behind house
Under the roof of house
< 1.5 and > = 1 μSv/h < 1 and > = 0.5μSv/h < 0.5 and > = 0.23μSv/h
Field up and left of house
4 5
11
12 3 2
Path right of the house
Gray areas are zones not measured in 2019
Front and sides of house
Field with former greenhouse Field
1
9 7
6
10
Road on both sides
Rice field other side of road
8
Road to house

Table 11: Breakdown of doserate in all Zones in Mr. Anzai’s house (walking on- and off-road, height 1m), 2015 - 2019.

Table 12: Radiation in all Zones in Mr. Anzai’s house (walking on- and off-road, height 1m), October 28, 2019.


