1 minute read
introduction
Additional References
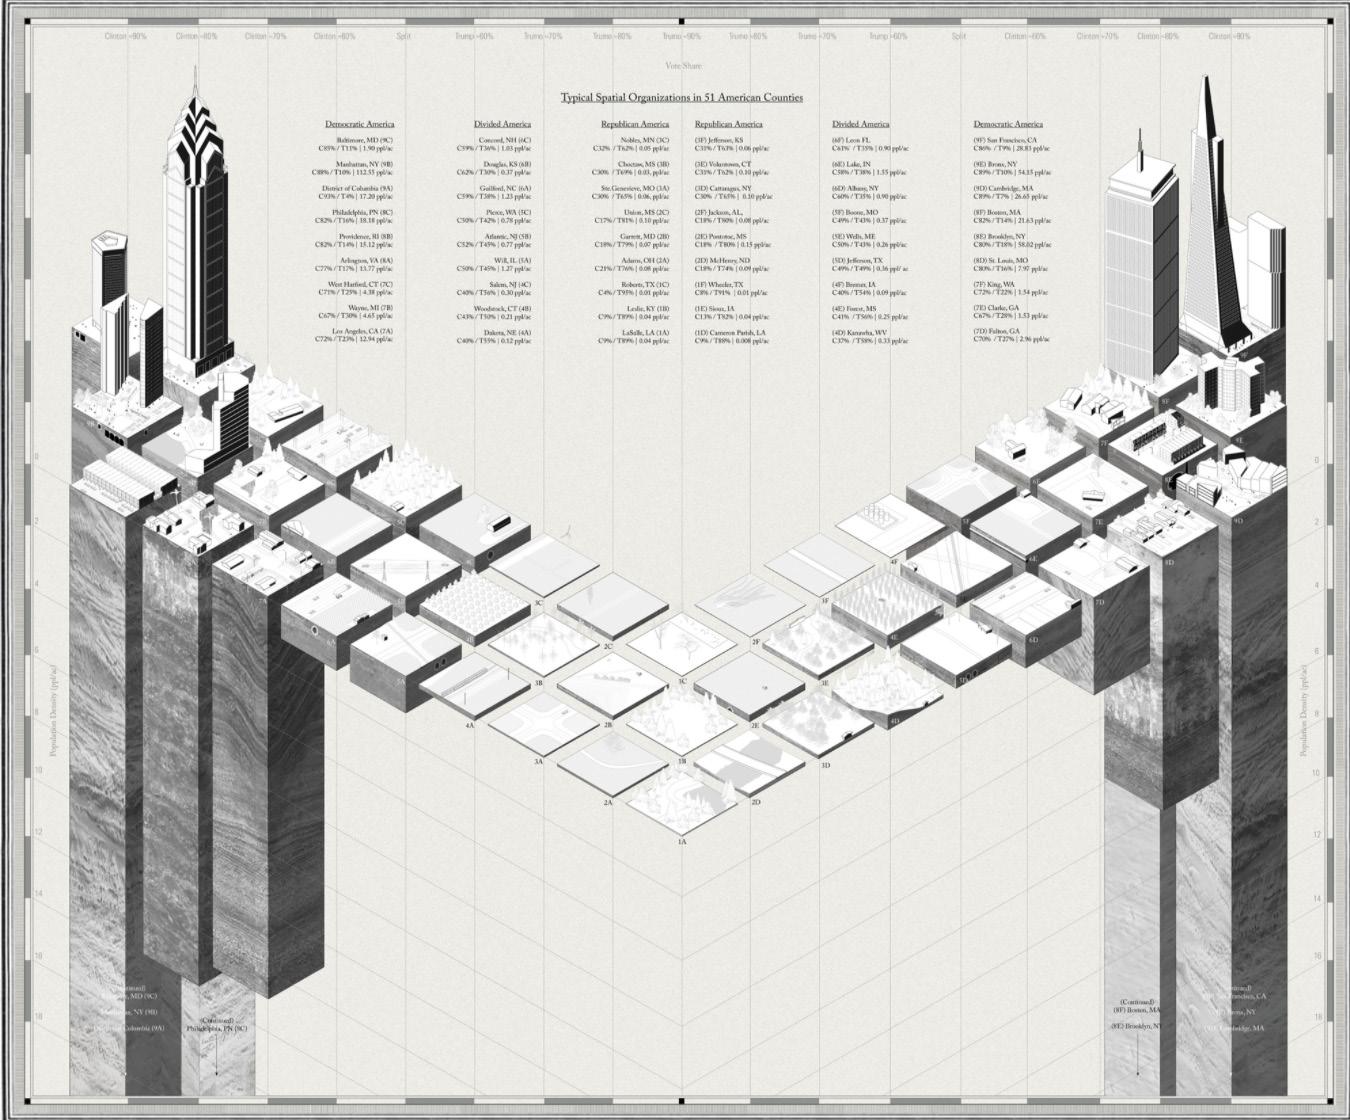
‘Typical spatial organizations in 51 American counties, with counties that voted heavily for Trump in the center and counties that voted heavily for Clinton on the left and right of the chart. Population density is represented on the vertical axis’ In Places Journal by Open Workshop
Advertisement

This part of the workshop will use the cities/towns of where you are currently located, in conjunction with reimagining historical case studies to define the city as a set of multiple ecologies that have specific material flows, cycles, and metabolic states. In turn, these assemblages indicate how human and non-human actors inhabit the city.
Today’s instruction aims to construct code for your urban assemblage. The workflow aims to demonstrate the processes for the production of Axo drawings demonstrating assemblage variation. The altering and reconfiguring the assemblage according to increased density, sunlight etc.
This document captures: • setting up density variable as a factor for change and difference for an assemblage

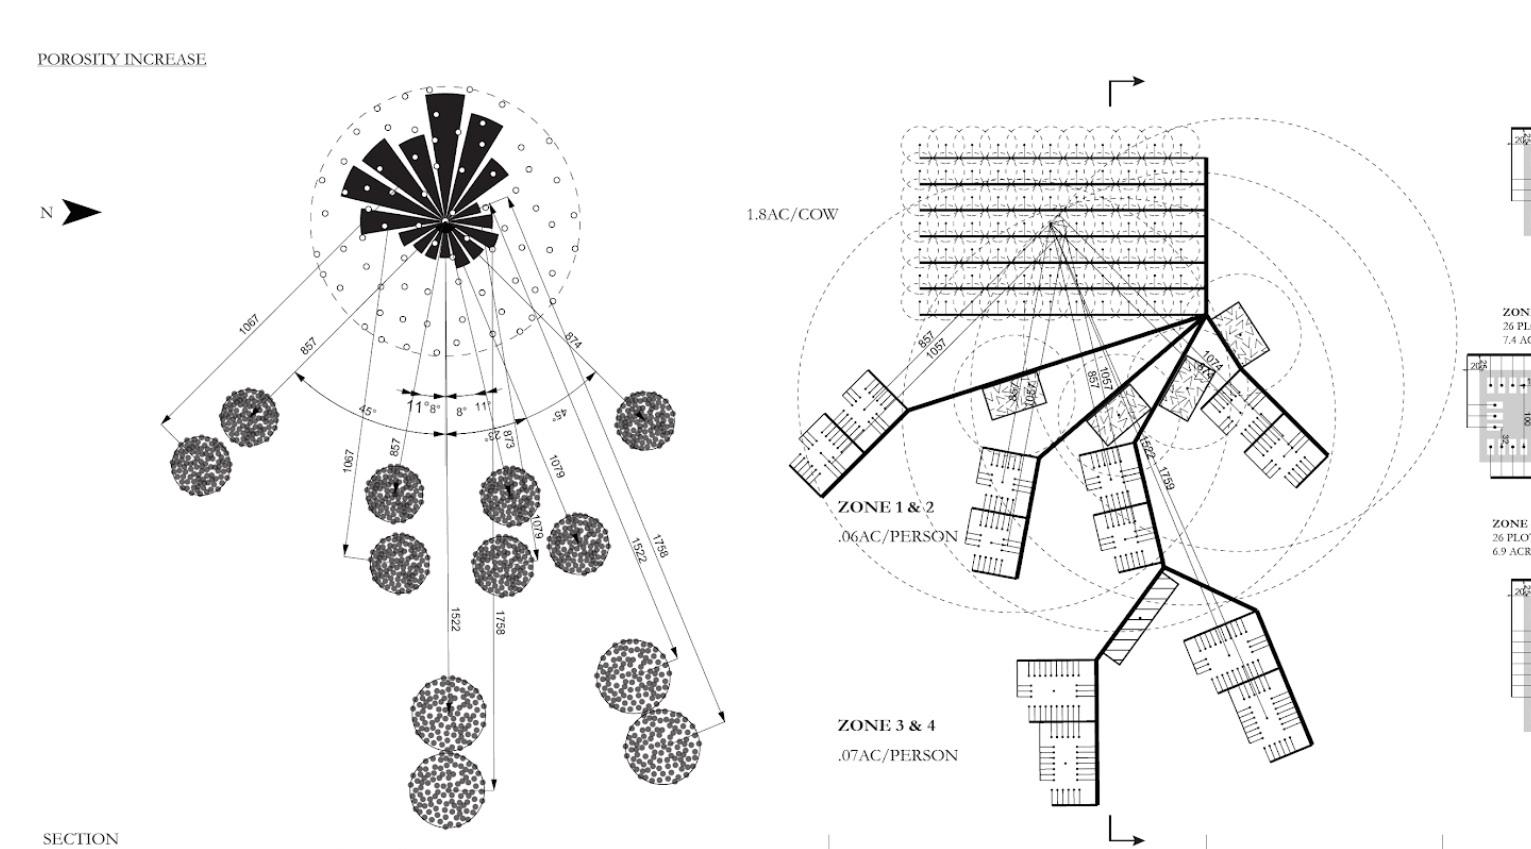
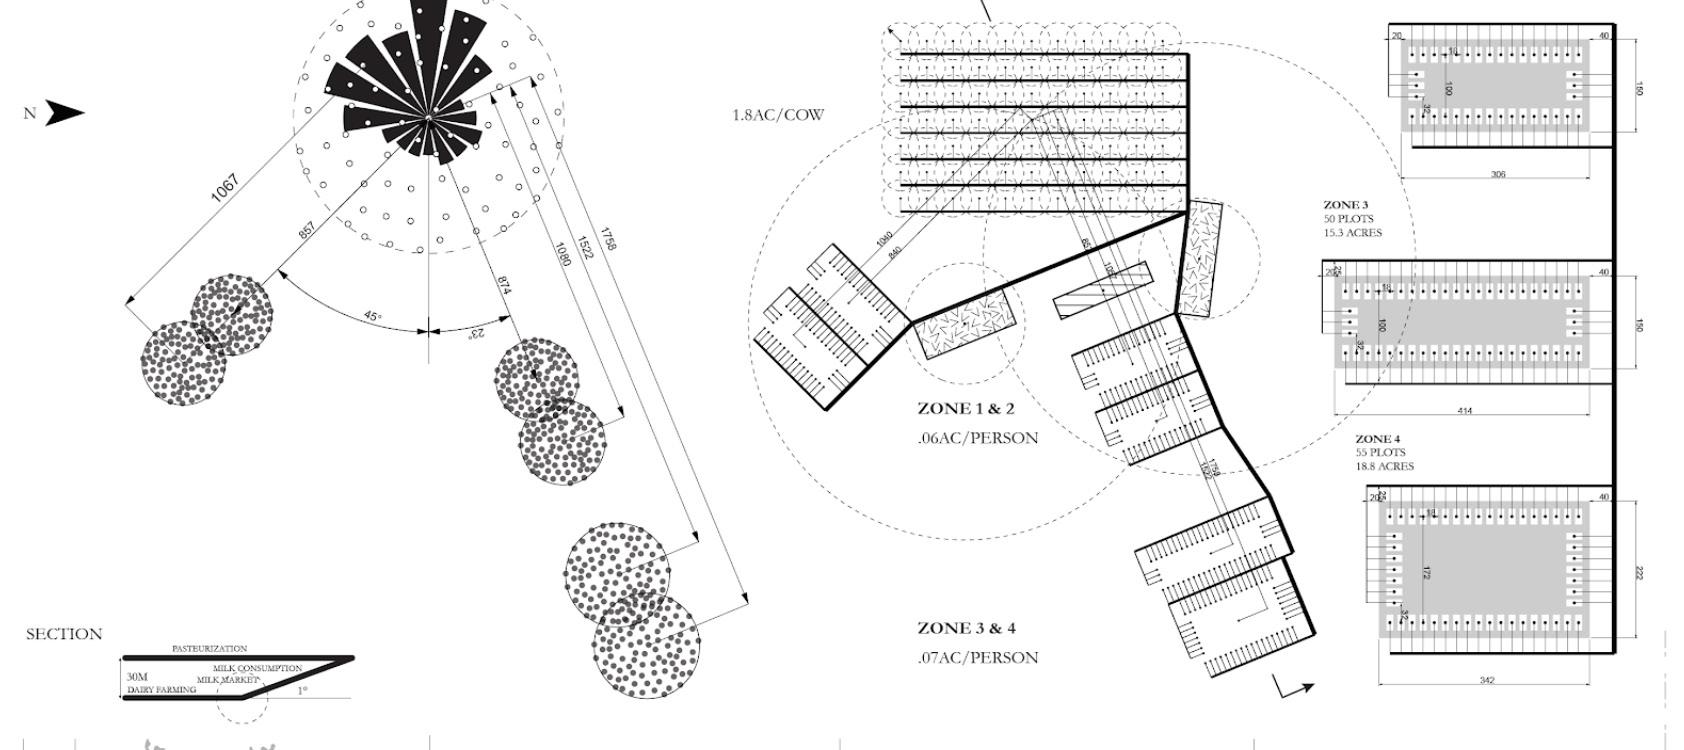
Broadacre City Density Variations by Alysoun Wright


