YEAR END 20 24
Now more than ever, the significance of home has an elevated place in our lives, especially during times of devastation. Our hearts go out to the individuals, families and communities impacted by the wildfires south of us in the Palisades area. We are beyond grateful to the brave first responders who continue to put their lives on the line every day.
Santa Barbara has had an influx of families from the devastated area relocating here— mostly trying to find rentals to meet their immediate housing needs. There are over 60 new children enrolled in Cold Spring School and 50 in Montecito Union from families impacted by the Palisades and surrounding fires. Right now, people are broken and just trying to sort through their options. Every family has unique needs. While not all have the ability or resources to purchase another home immediately, there are many fire victims reaching out looking to make a permanent move to our area. With this new level of demand, it could be an ideal time to consider listing your home to maximize any equity you may have in your property. Please reach out for a confidential conversation to explore how this could impact your home sale and for a personalized strategy based on your specific situation.We can discuss our exclusive Compass programs to ensure your property gets maximum exposure from qualified buyers.
National headlines report that the housing market has not been this slow in 30 years. High interest rates and low inventory created record prices making home ownership out of reach for many Americans. Our area is uniquely resilient and enjoys continued demand from people wanting to live in our beautiful coastal community.
CAN
. . Thinking about selling your home, but still on the fence? Is there an aspirational price at which, if offered from a real buyer, you would consider selling? Reach out to discuss!
While inventory constraints have been a defining factor in shaping the South Santa Barbara County real estate market in 2024, we saw an increase of 24% in total sales volume and 12% increase in the number of transactions (see charts to follow) during the past year. Moving forward, insurance will continue to be an issue and this will be a deciding factor in the total equation of each transaction. Insurance rates are a fluid issue and we partner with top insurance brokers who can best advise on your options. The availability of high-end homes remained limited, with demand continuing to outpace supply. This scarcity has led to heightened competition for turnkey and move-in ready properties, particularly those offering modern amenities and prime locations. We can implement several programs exclusive to Compass to bring you the best and highest price on your home while protecting your privacy and limiting disruption to your lifestyle.
In this highly competitive market—experience matters. We offer extensive market knowledge, world-class marketing and concierge level professional service with complete confidentiality to our clients. Our proven track record of success includes skills necessary to put complicated deals together and negotiate the price and terms that will get your home sold for a premium price and your offer accepted on your replacement property—even amongst multiple offers.
Looking for professional + creative results-oriented representation—reach out for a confidential conversation and strategic marketing plan. Let’s Talk!
“We are delighted and honored to be recognized as one of the TOP AGENTS in the Montecito area on Los Angeles Magazine’s 2025 All Stars list. It would be our pleasure to include you and your family as one of our valued clients and hopefully new friends ! Please reach out for a confidential conversation about your real estate goals
- Randy Haden and Molly Haden
With tens of thousands of real estate agents working in Los Angeles and surrounding communities, choosing the right one can be a daunting task. Buying a home shouldn’t be as stressful as driving a car without brakes, which is why we commissioned Professional Research Services to contact residential real estate companies—big and small—in the region and collect the names of its top performing agents within a 12-month period.

Now a home purchase of this significance no longer needs to be a gamble. Peace of mind is the least we can offer. Making your house a home is up to you!

Single Family Homes + Condominiums
+12% change over YTD 2023
1233
TOTAL 2024 SALES
+16% change over 2023
894
AVERAGE SALES PRICE
+10% increase over 2023
$3,509,152
MEDIAN SALES PRICE
+3% increase over 2023
$2,172,130
TOTAL 2024 SALES
+2% change over 2023
339
AVERAGE SALES PRICE
+3% change over 2023
$1,271,485
MEDIAN SALES PRICE
+3% change over 2023
$995,000

Single Family Homes + Condominiums
+26% change over 2023
97
TOTAL SALES
+37% change over 2023
70
AVERAGE SALES PRICE
+10% increase over 2023
$2,911,939
MEDIAN SALES PRICE
+7% increase over 2023
$2,025,000
TOTAL AVERAGE DAY ON MARKET
55 SOLD TO ORIGINAL LIST PRICE
90%
TOTAL SALES
+4% change over 2023
27
AVERAGE SALES PRICE
-4% change over 2023
$1,060,656
MEDIAN SALES PRICE
+7% change over 2023
$895,000
TOTAL AVERAGE DAY ON MARKET
25 SOLD TO ORIGINAL LIST PRICE
100%
$2,893,929
$1,794,000
2 Year Month over Month Comparison
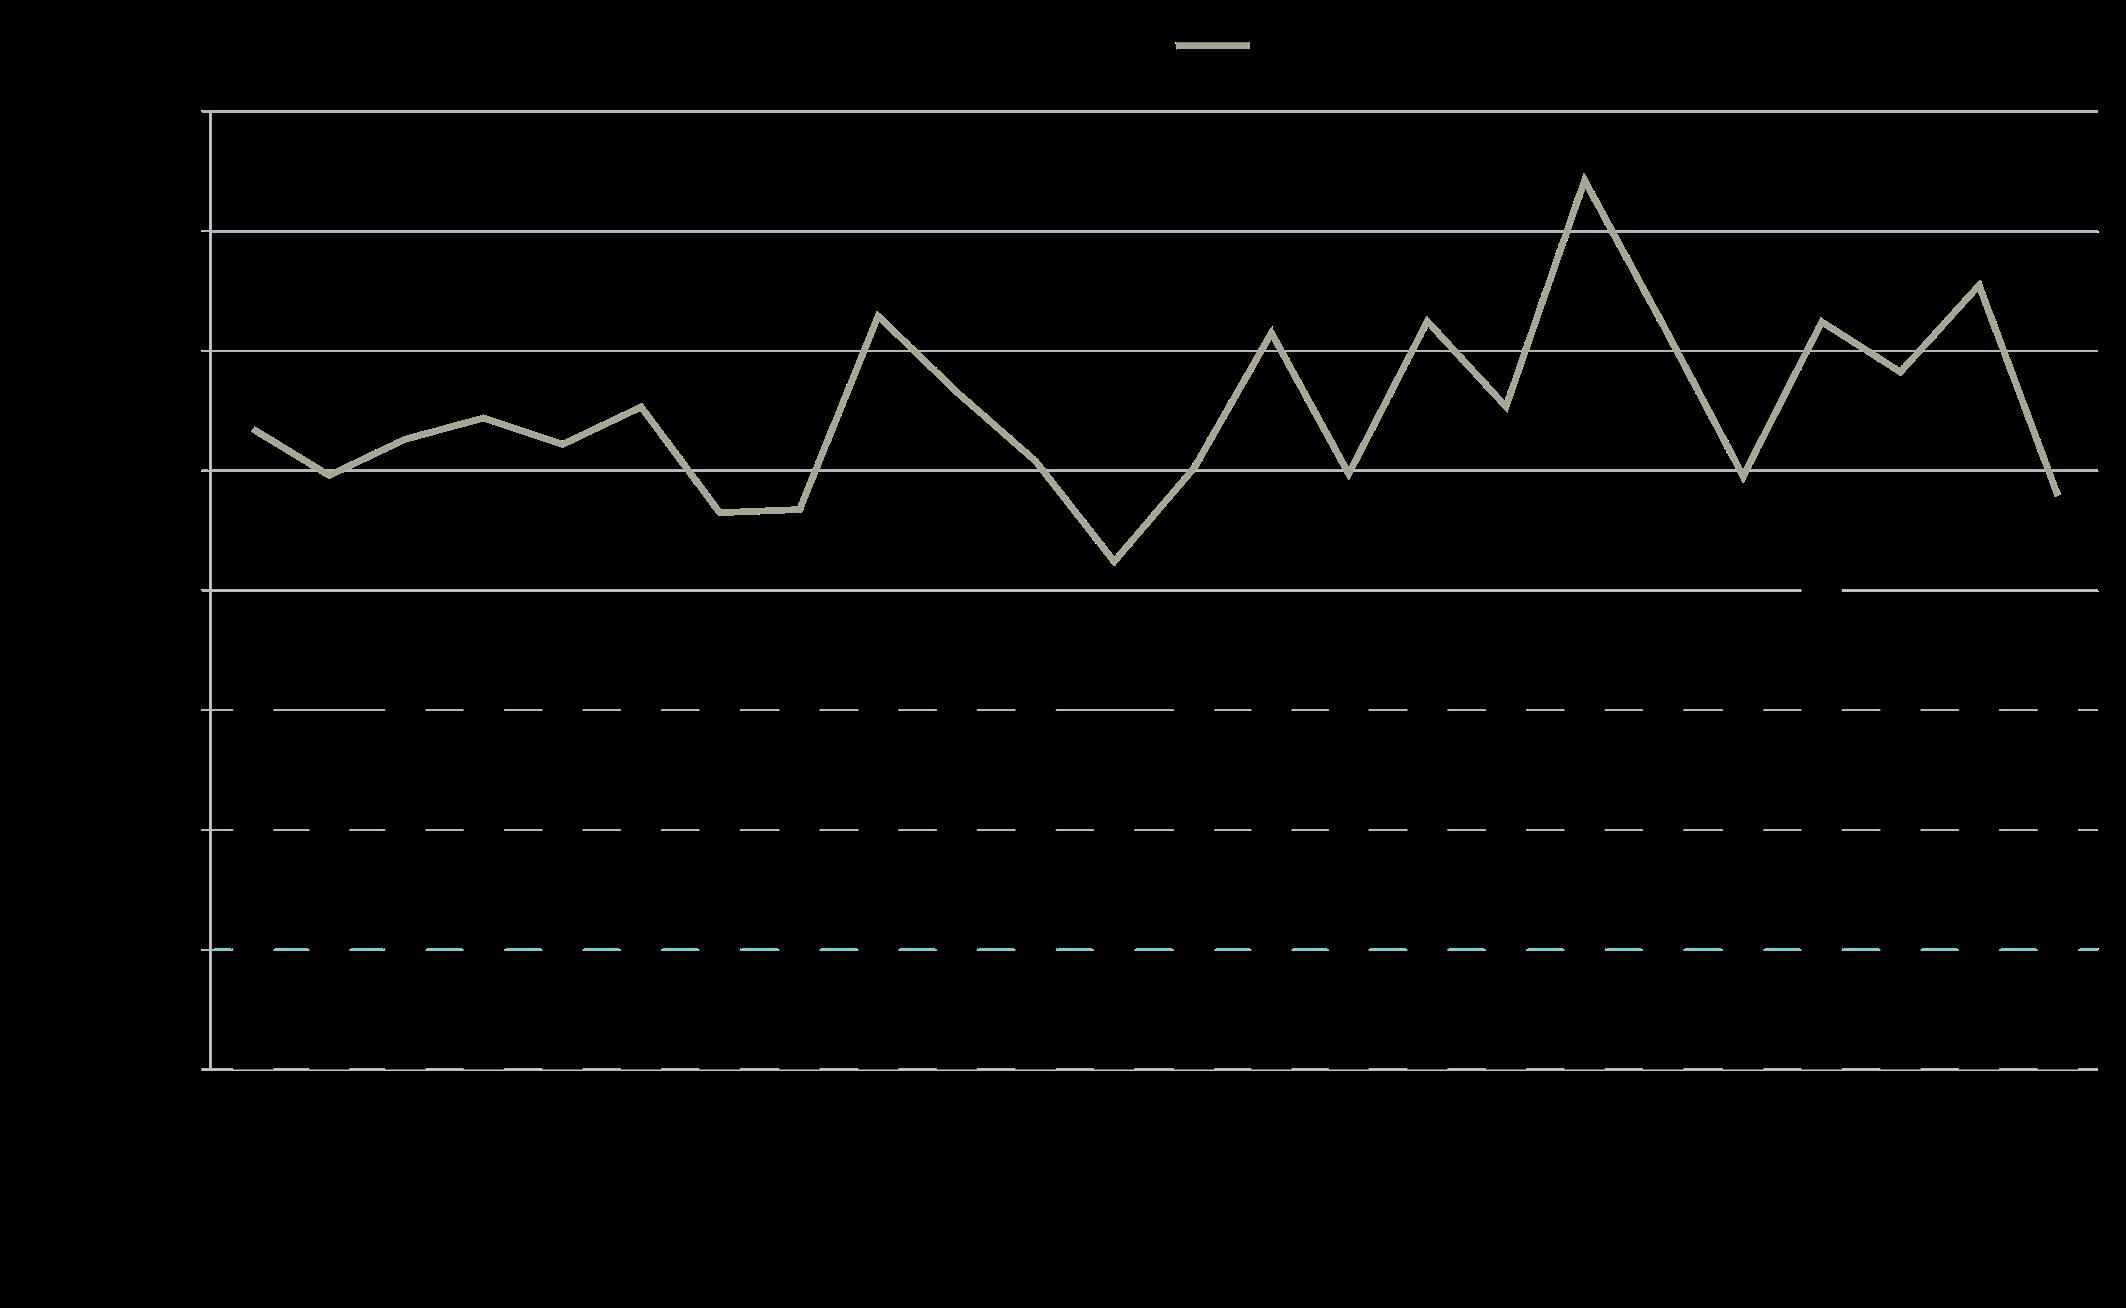
$2,396,633
$1,715,650
- south -
- homes | estates | puds (excludes condos) -
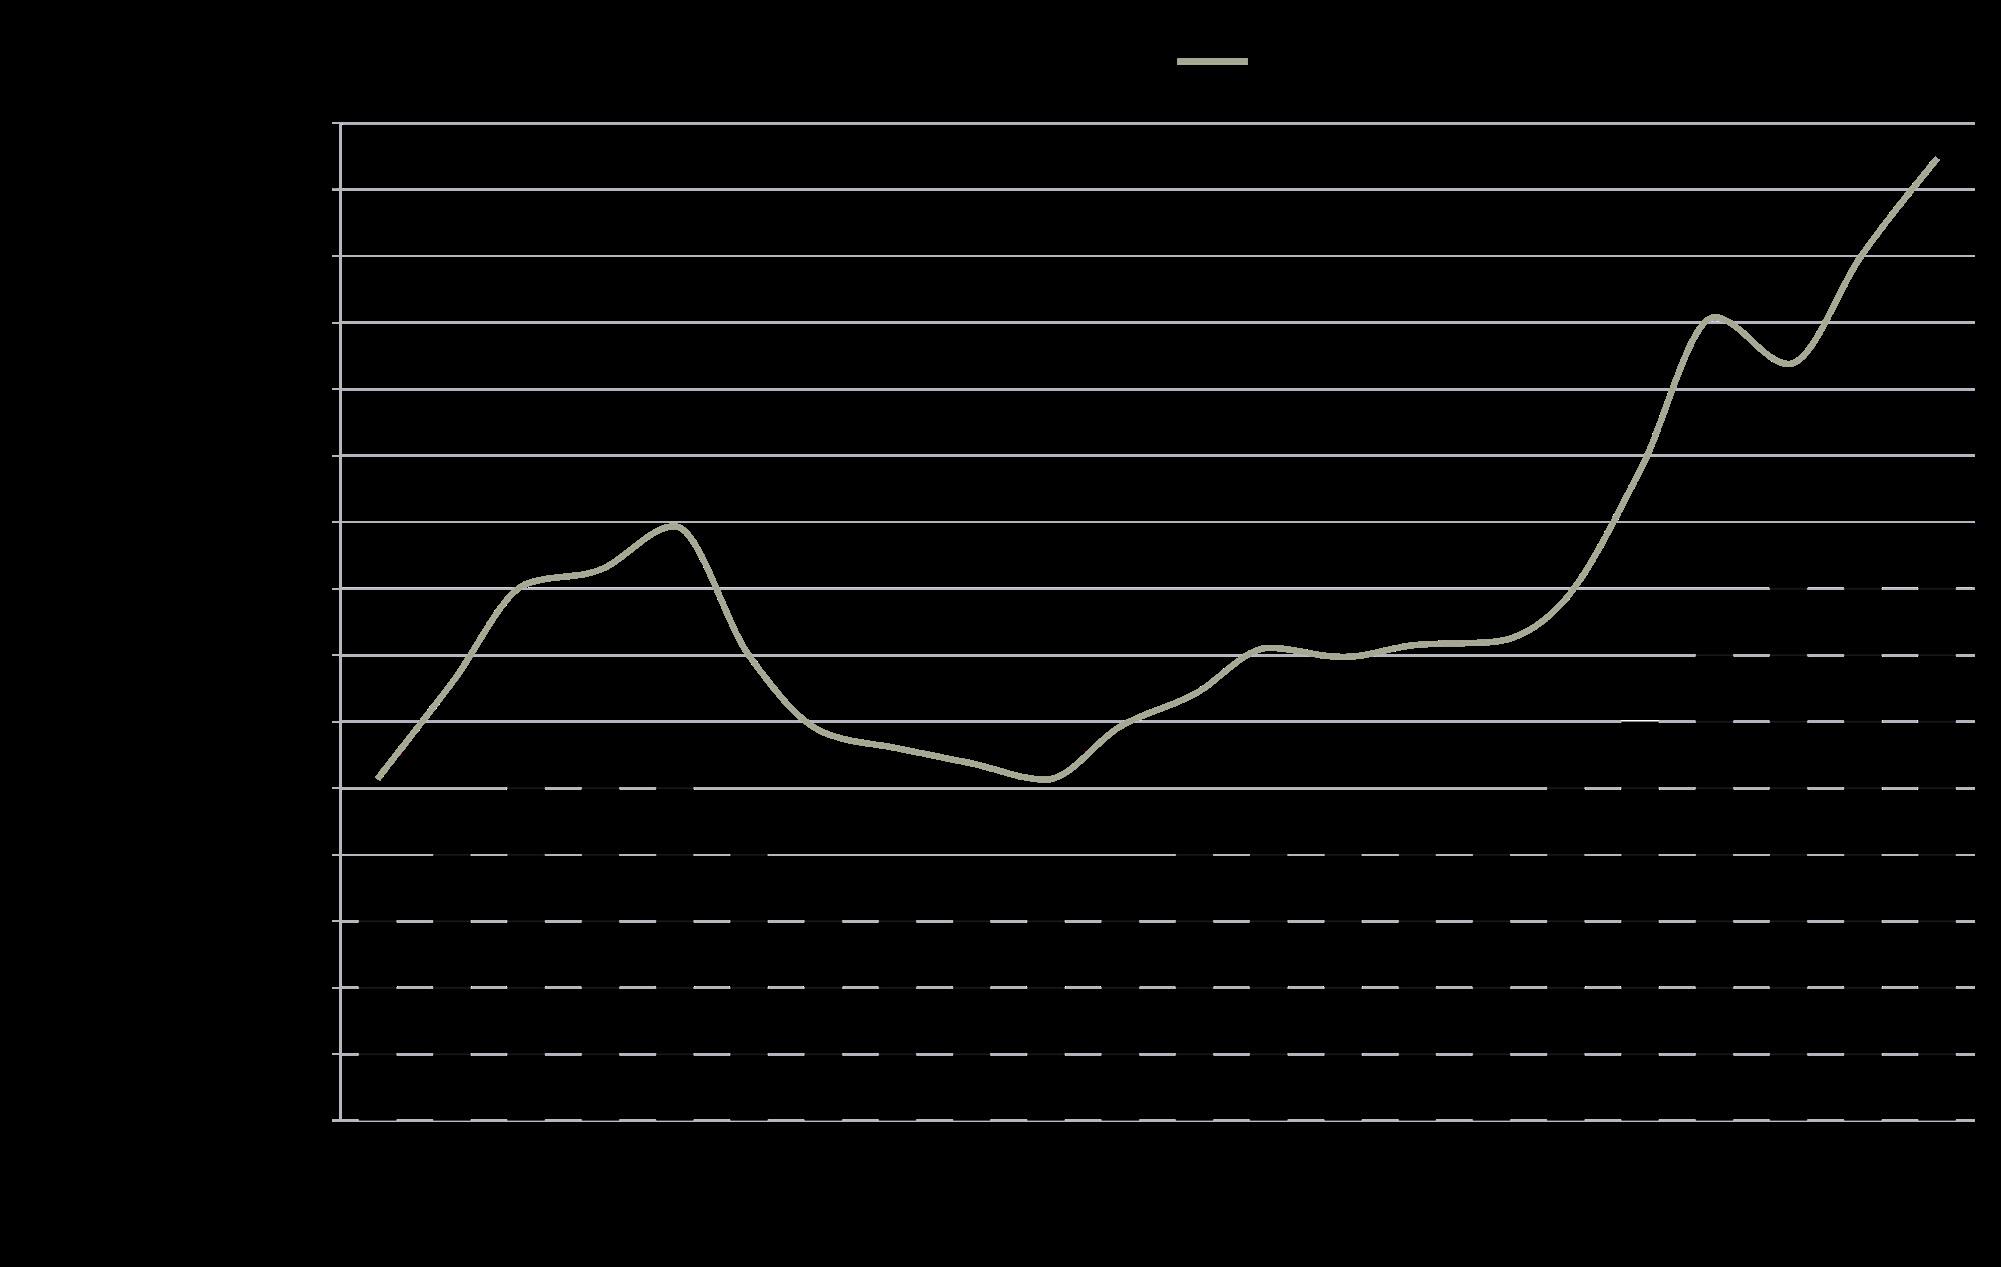
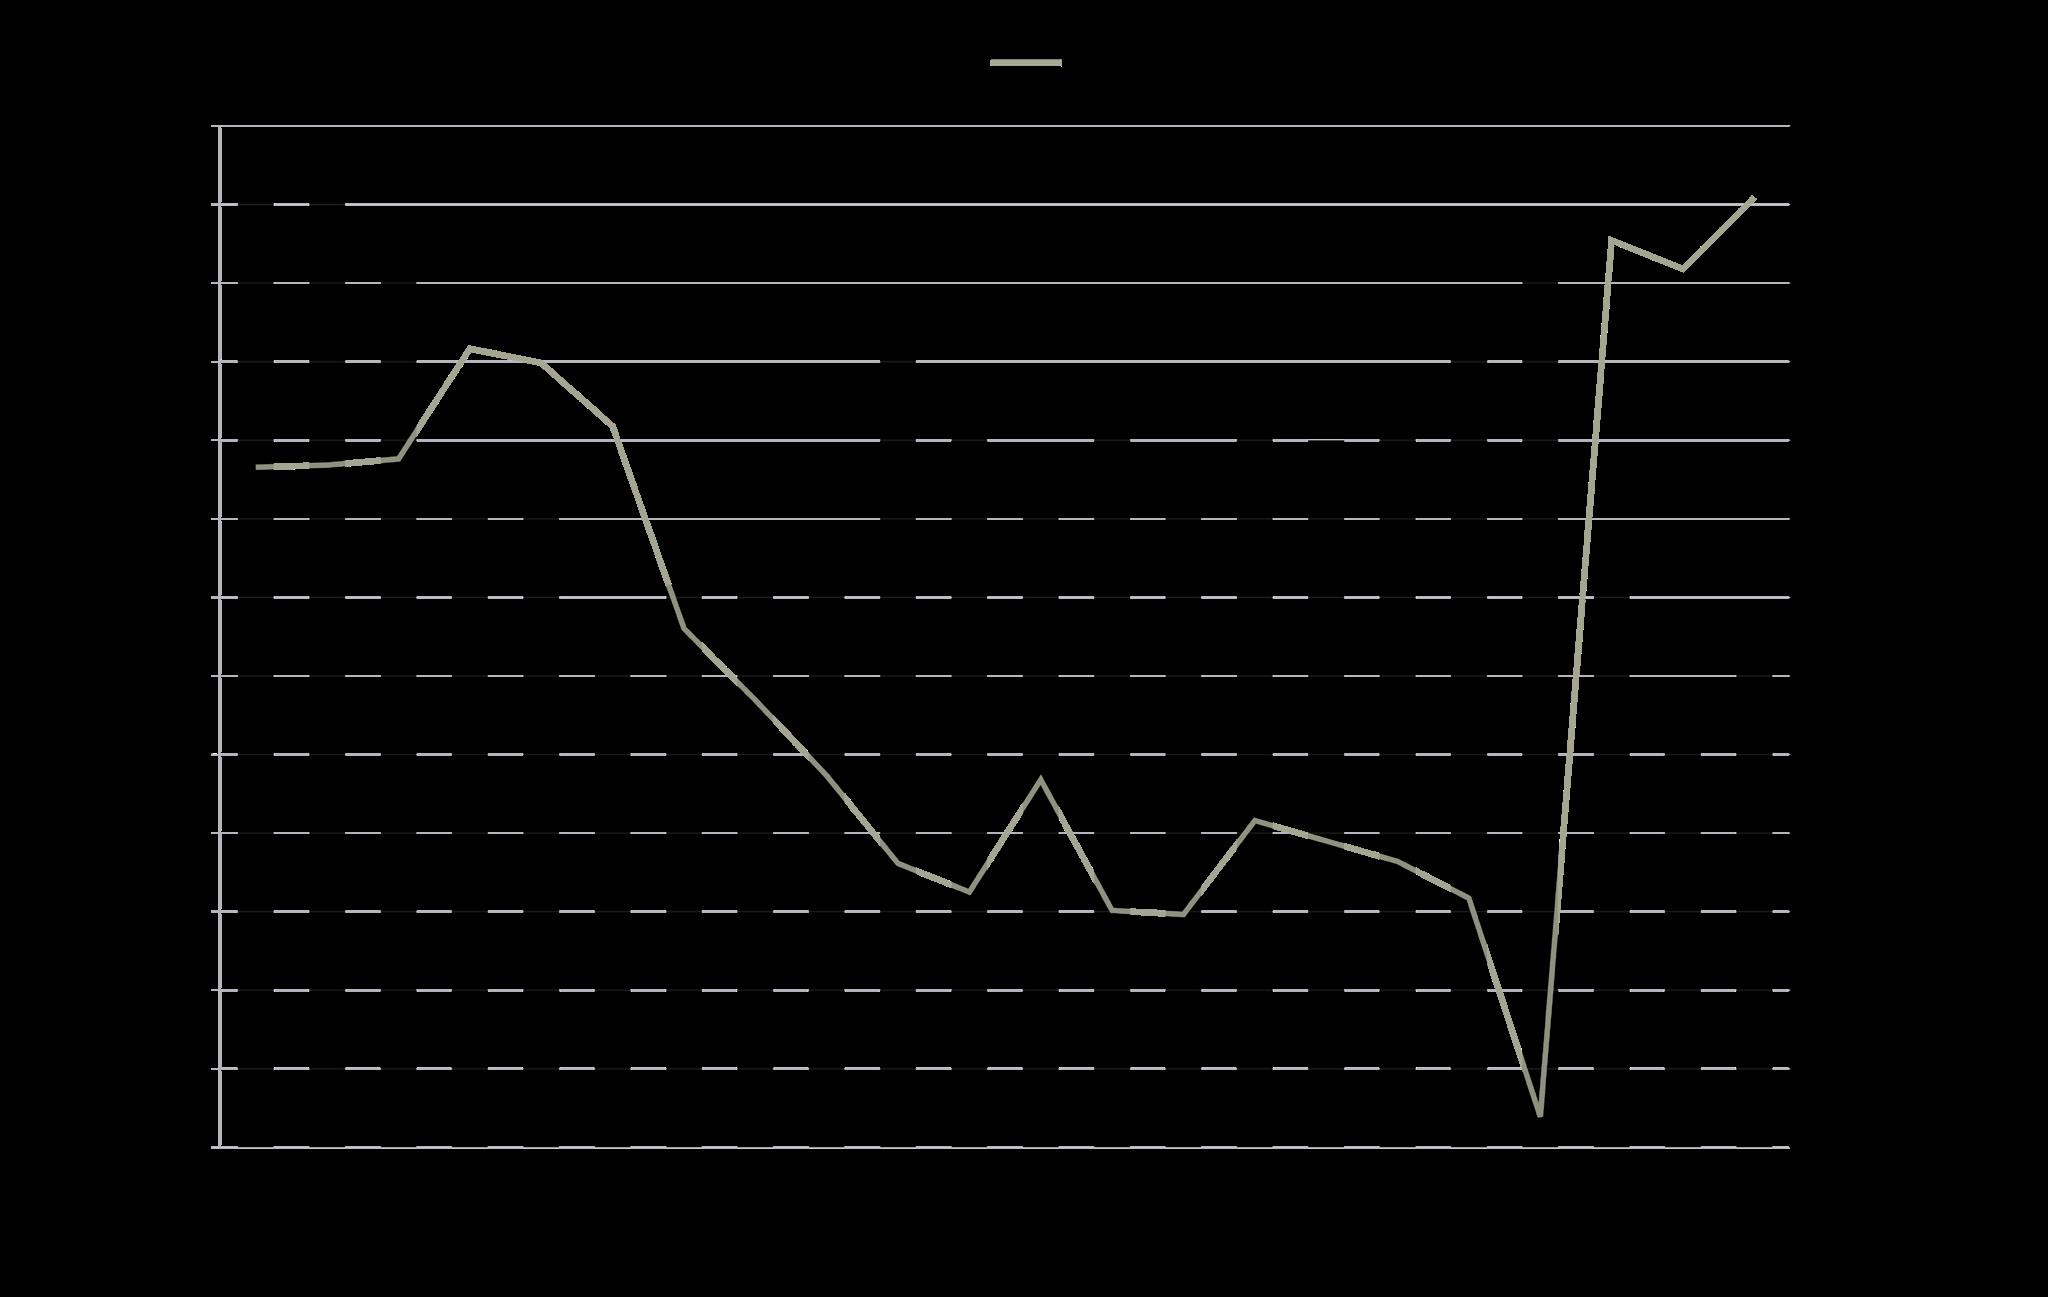
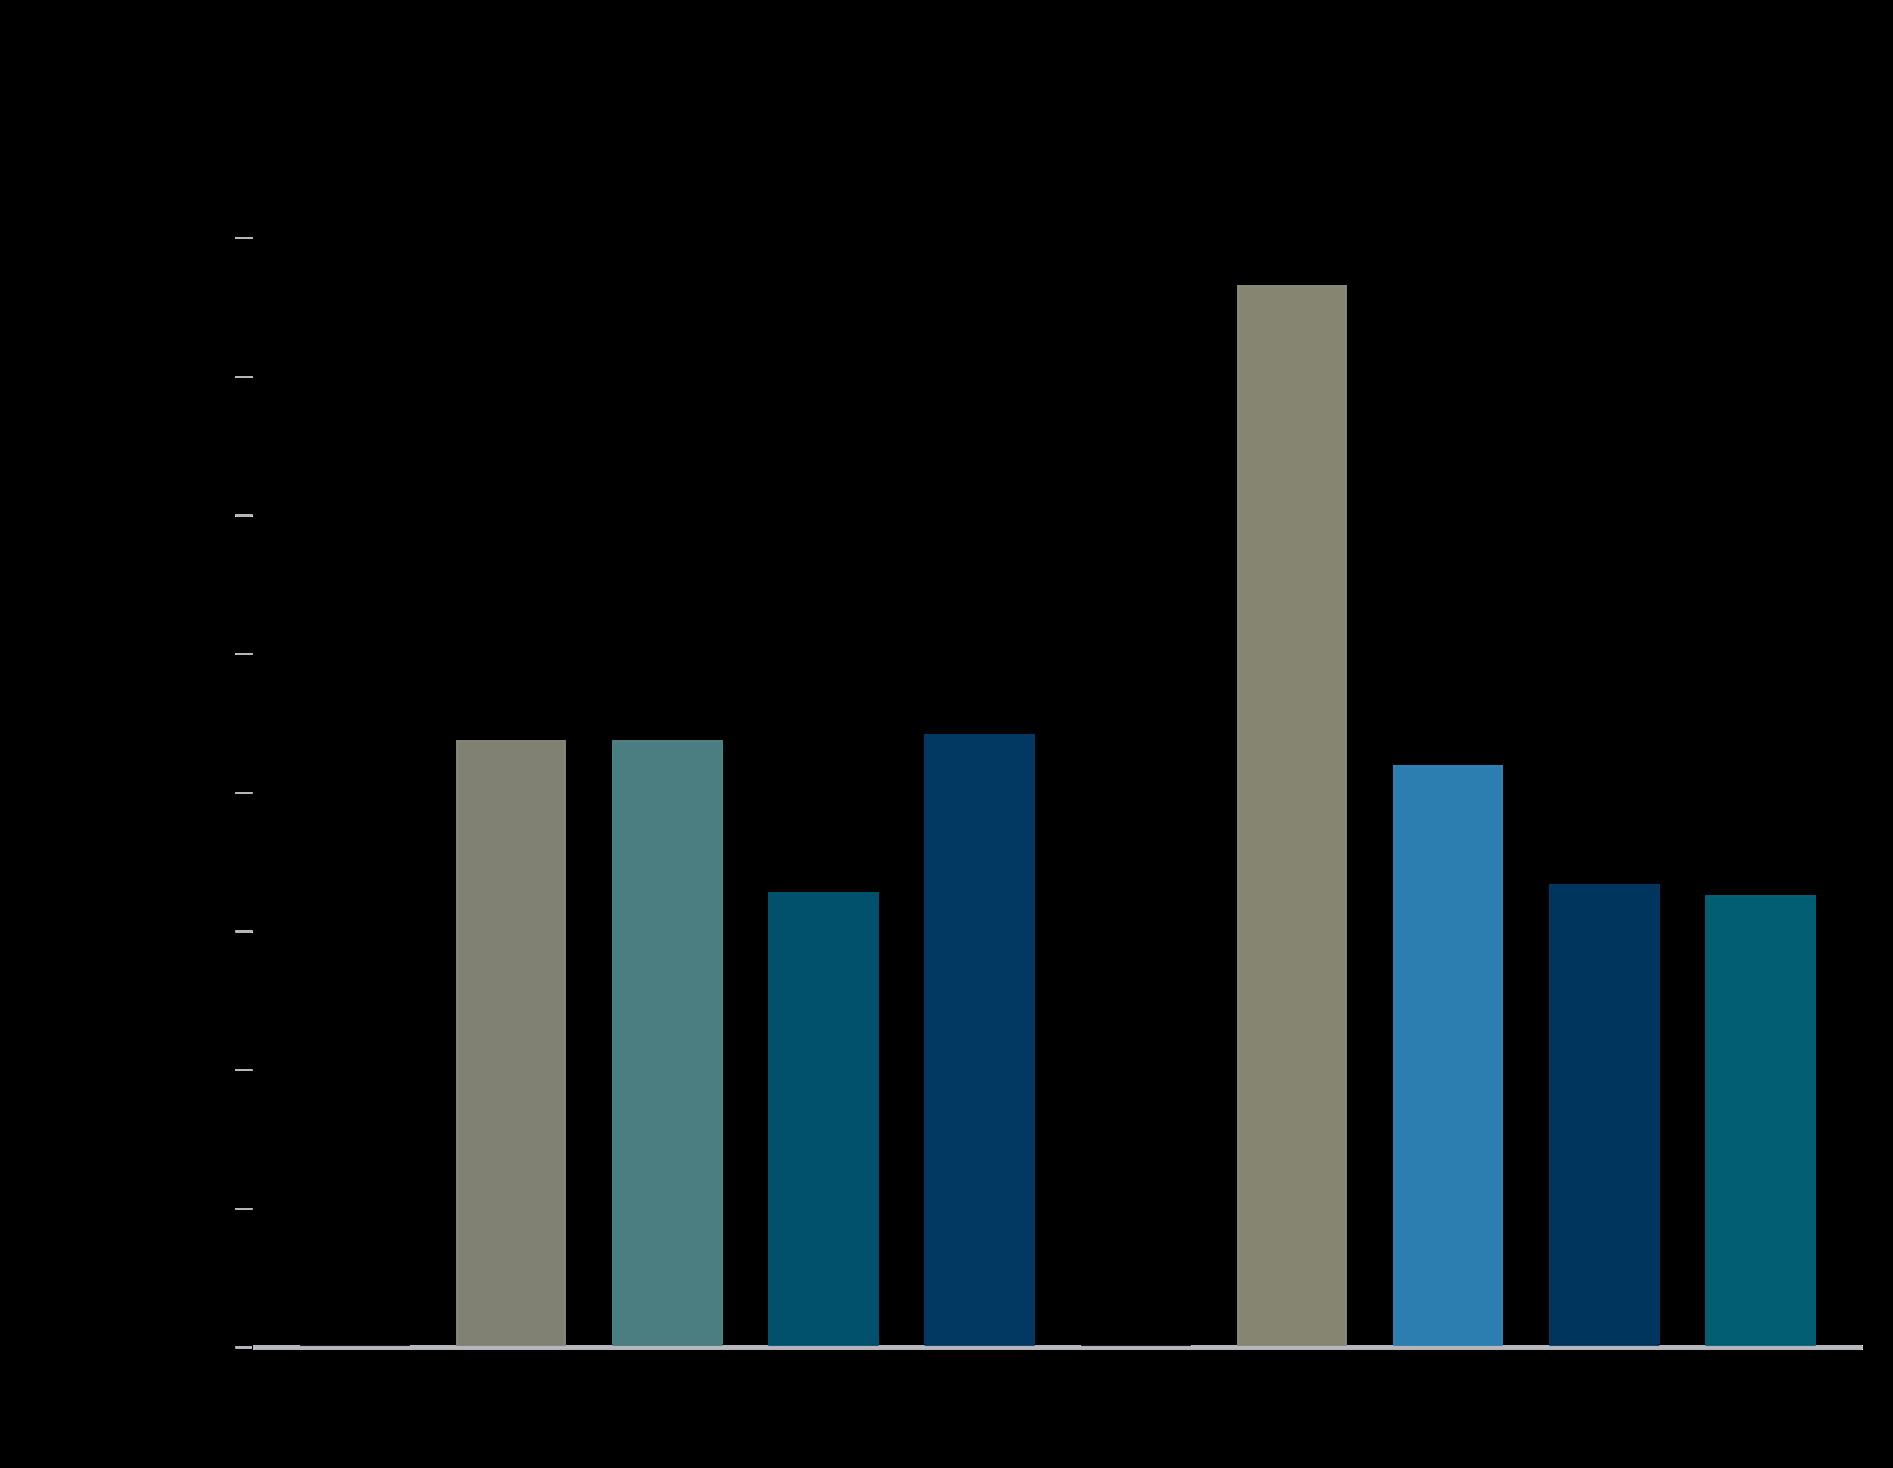
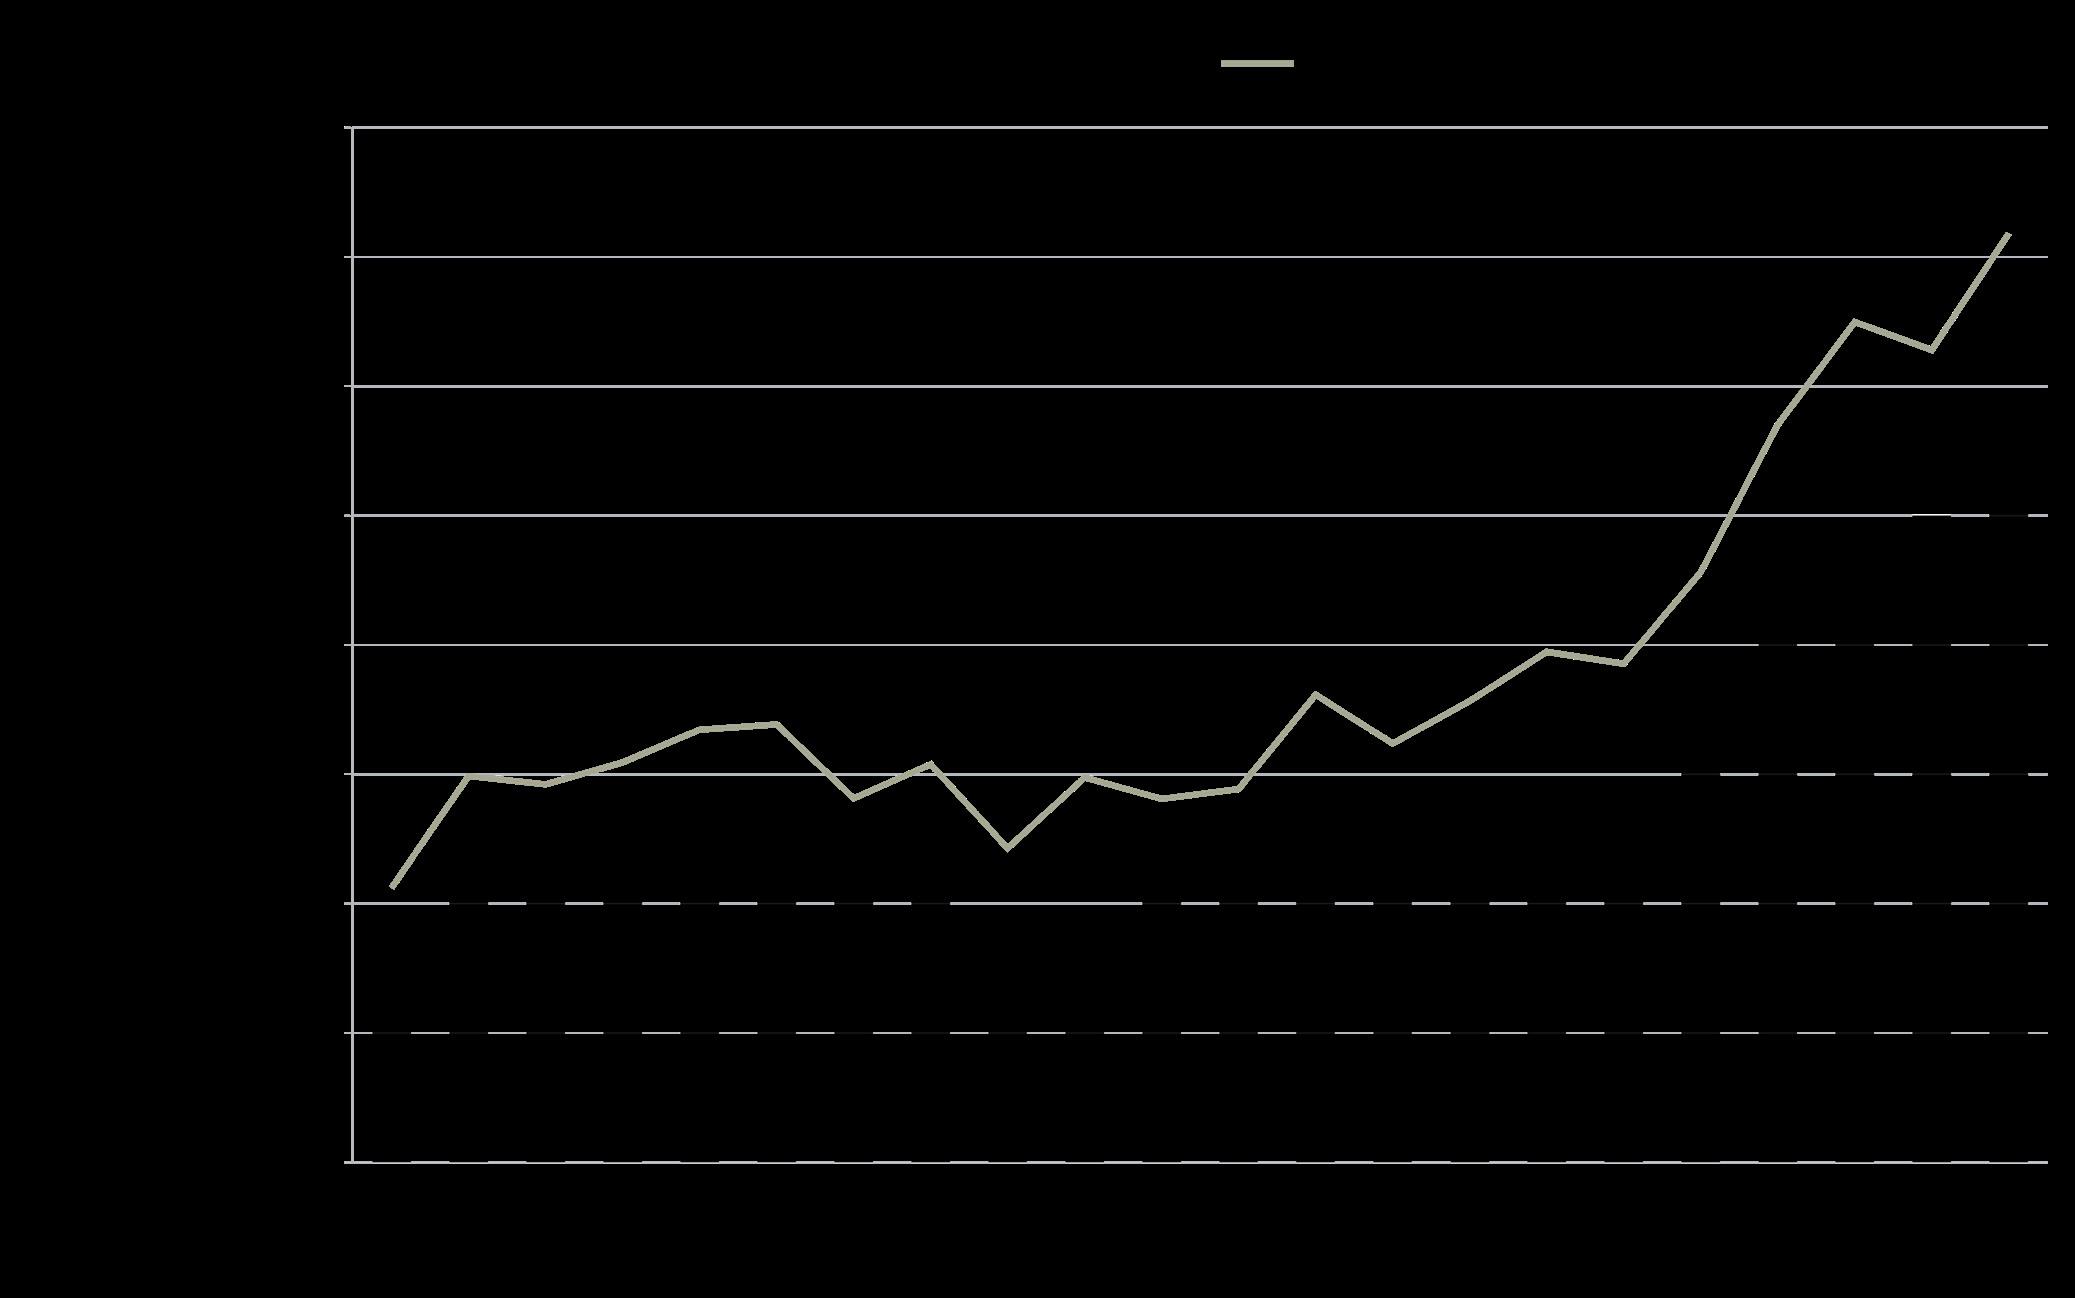
LISTINGS + SOLD ANALYSIS YTD Totals | 2018-2024
INSIGHT | While sales volume increased by 12% over 2023, overall sales volume rose 24%: 2023: $2,881,889,322 2024: $3,568,215,015
The outlook for the ultra-luxury real estate market in 2025 remains optimistic, with two notable key drivers: wealth creation and wealth transfers. Highnet worth individuals continue to grow their fortunes, supported by gains in financial markets, robust economic activity and strategic wealth management. Additionally, an unprecedented transfer of wealth is underway as older generations pass significant assets on to their heirs. This influx of liquidity is empowering a new wave of buyers to enter the ultra-luxury market, increasing demand for exclusive properties despite inventory challenges.
While higher mortgage rates and rising insurance premiums are impactful, high-net-worth individuals are uniquely positioned to weather broader economic fluctuations, as they are often less affected by these costs and can leverage alternative financing or cash purchases. Furthermore, their focus on lifestyle, legacy and strategic investments ensures ongoing activity in key luxury markets.
Even though low inventory remains a persistent hurdle, the ultra-luxury sector’s resilience is driven by high demand for premier properties that cater to discerning tastes and long-term value. From trophy homes in iconic destinations to private exclusives offering unmatched discretion, the segment is well-positioned for a strong year ahead. We are optimistic about this segment in our area.
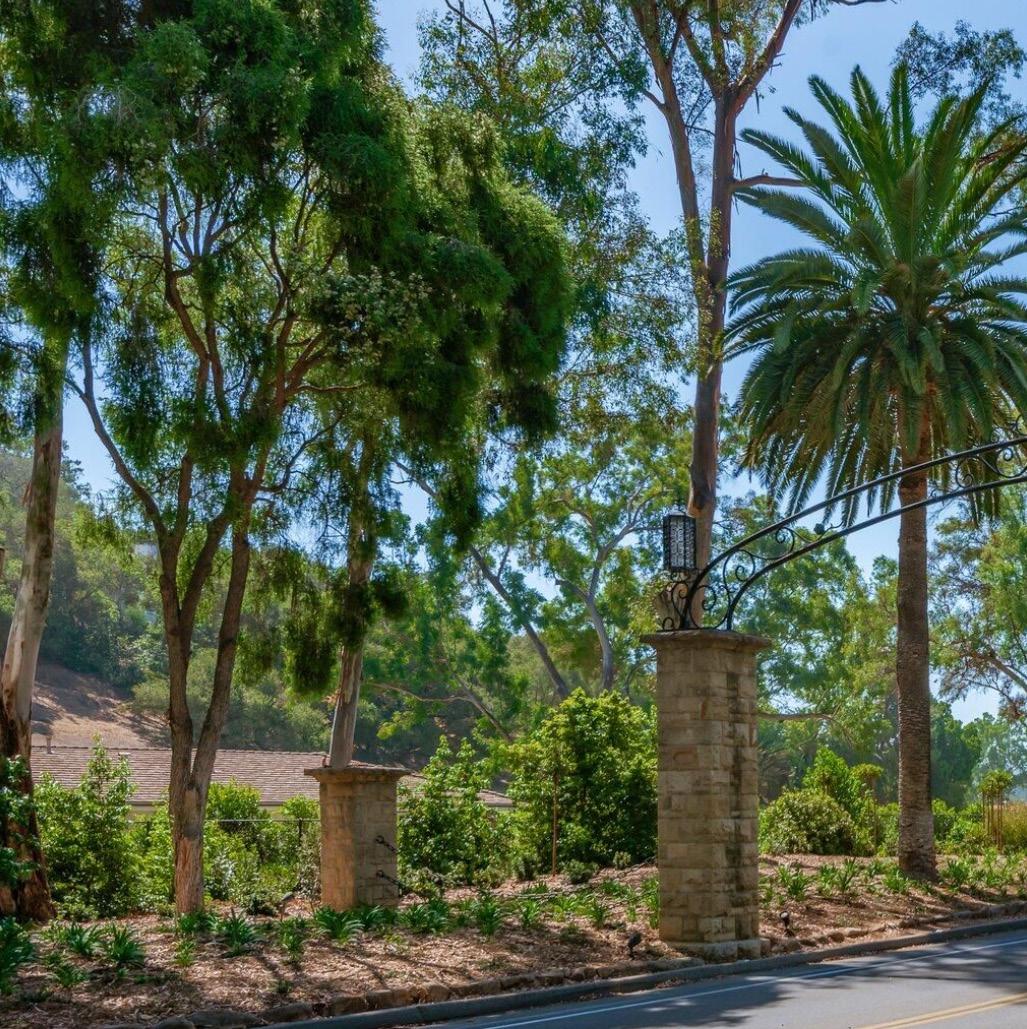
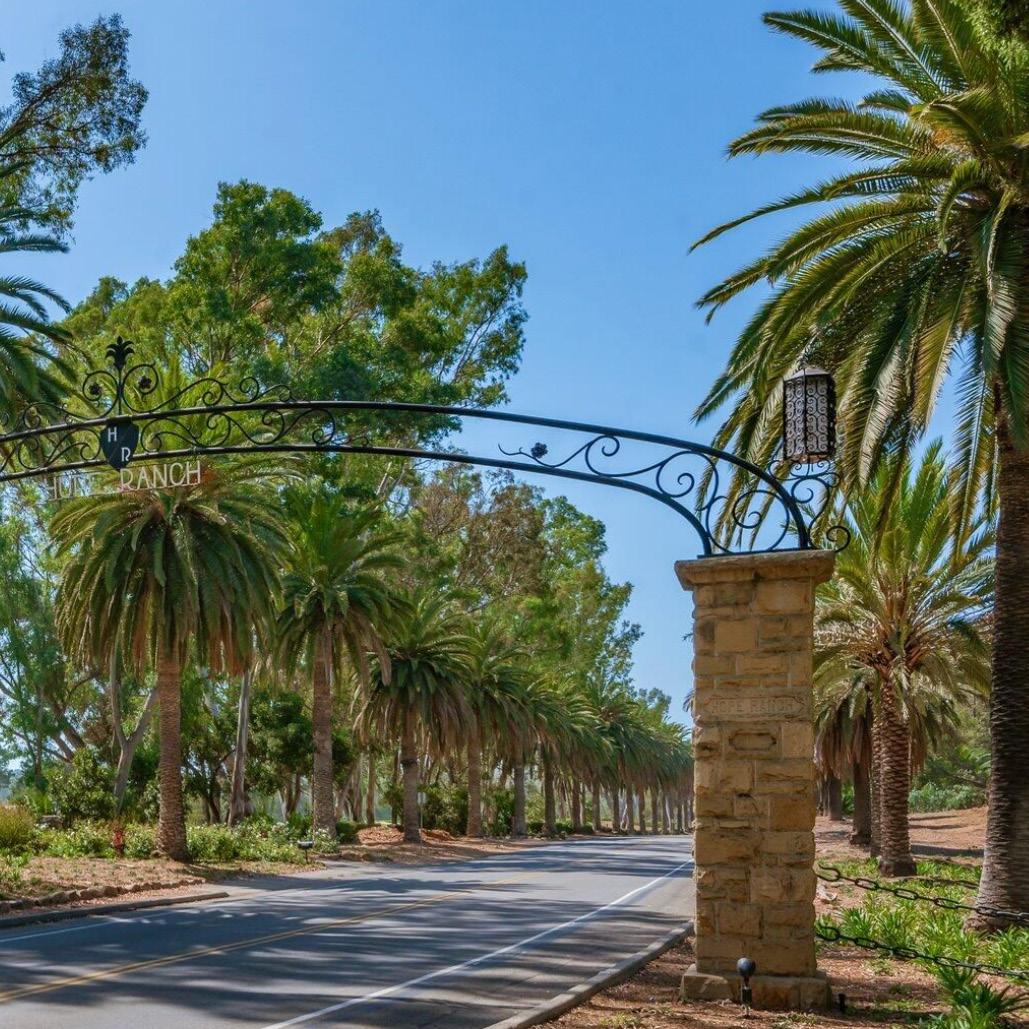
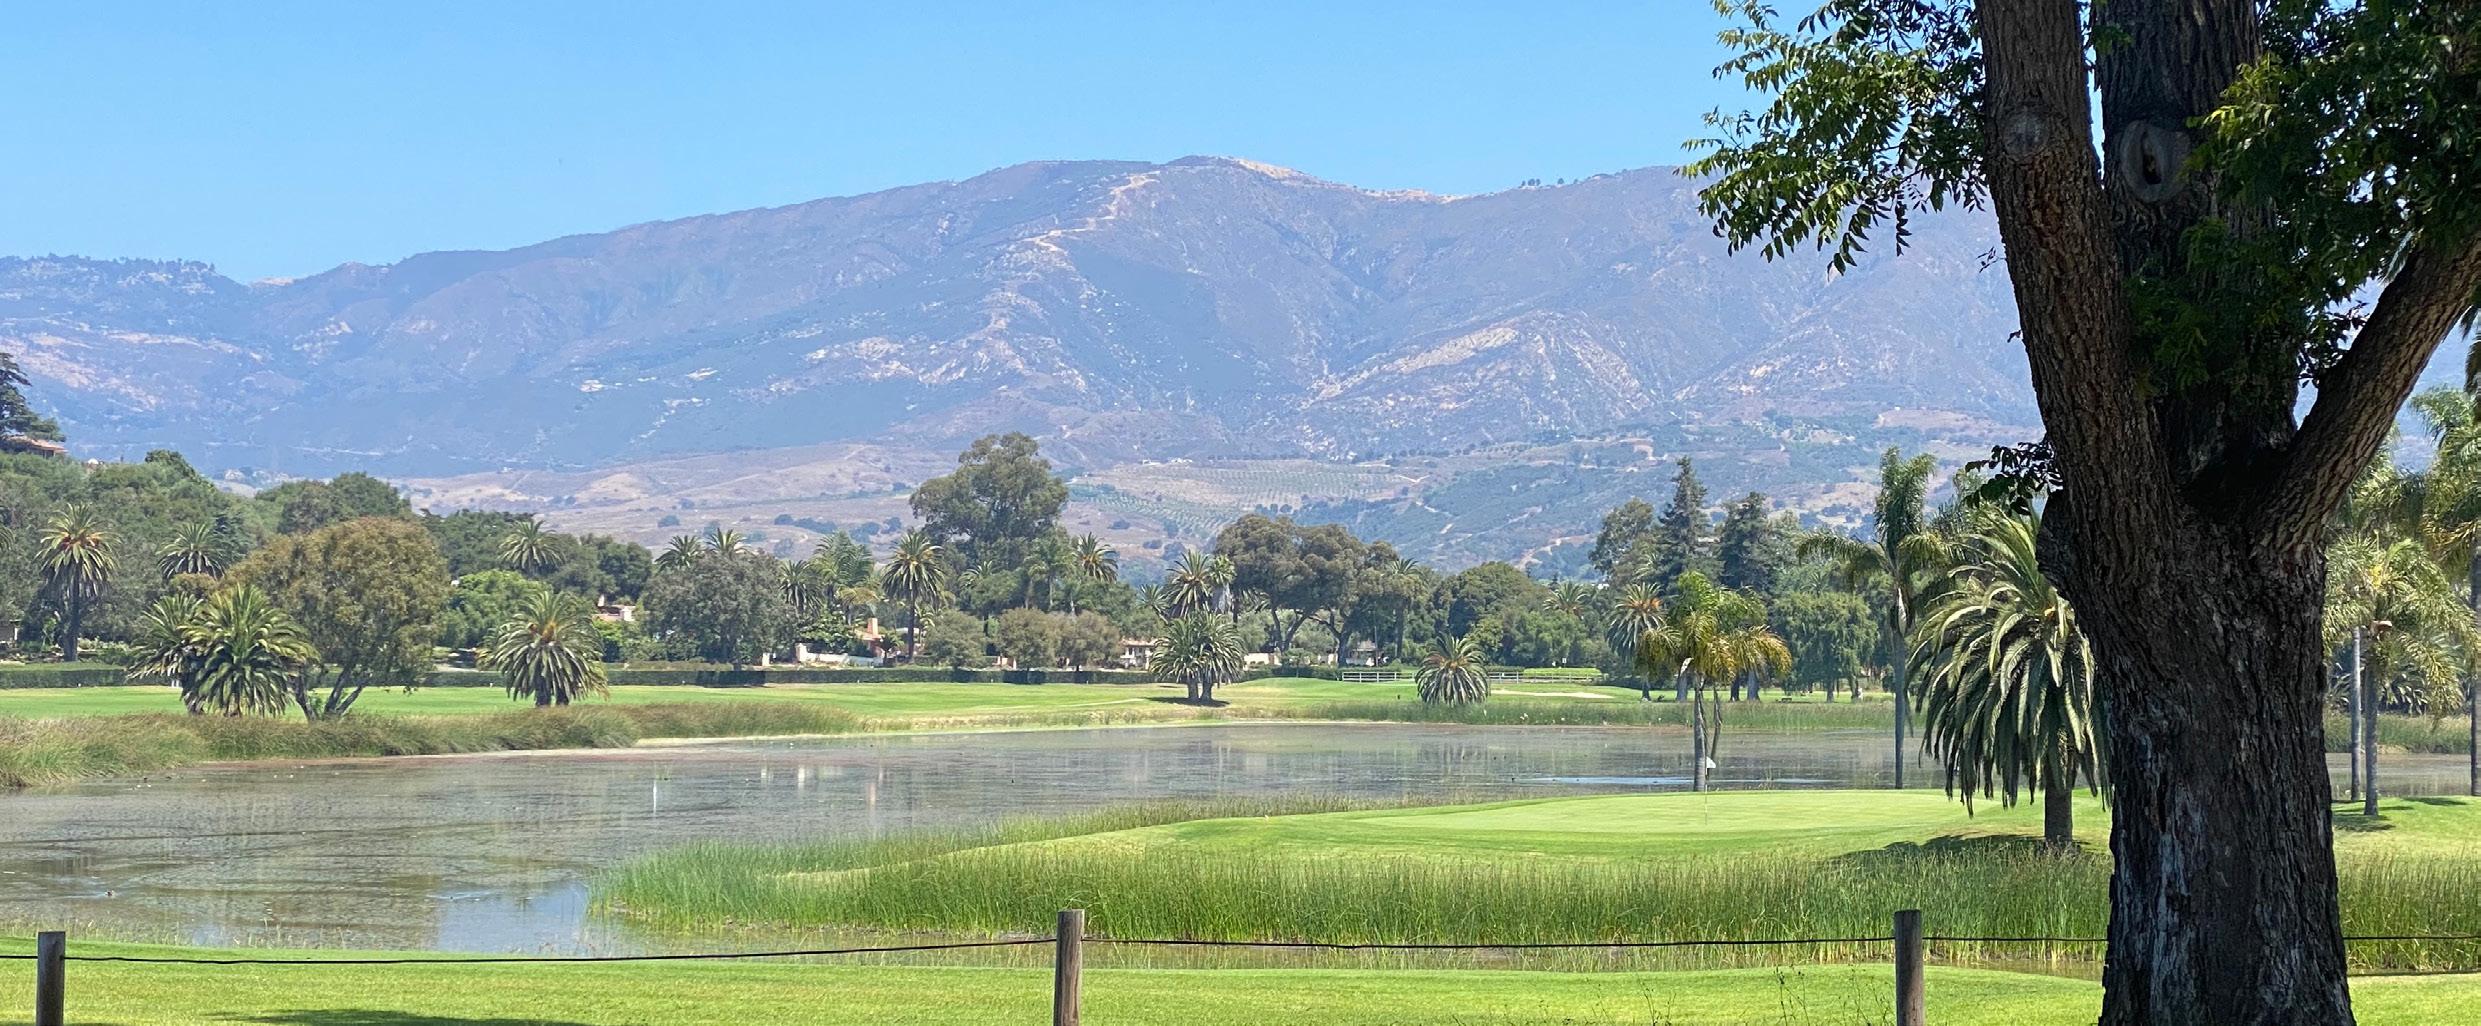
Our market has seen a continued rise in demand for properties as a secondary or vacation home as affluent buyers prioritize lifestyle-driven purchases. Montecito and Hope Ranch have experienced heightened interest with buyers seeking serene retreats offering exceptional climate, outdoor amenities, privacy and year-round recreation. Our market provides the perfect balance between luxury living and natural beauty, making it attractive to second-home buyers and those seeking a peaceful escape.
The demand for ultra-luxury estate homes in our beautiful coastal community remains robust, as affluent buyers from around the globe are drawn to Montecito, Hope Ranch, Carpinteria and Santa Barbara. During 2024, 33 homes traded over $10M and 12 of these traded over $20M with the highest sale trading for $96M at 2781 Padaro Lane.
- 2024 Sales ListULTRA LUXURY

The Demand Luxury our Beautiful Community as Affluent Around to Montecito Barbara Climate, Privacy, Community.
Demand for UltraLuxury Estate Homes in Beautiful Coastal Community Remains Robust, Affluent Buyers from Around the Globe are Drawn Montecito and Santa Barbara for our Exceptional Climate, Outdoor Activities, Privacy, Safety and Vibrant Community.

We have historically never seen a better time to capitalized on the equity you may have in your home. In this low inventory market with high buyer demand, now could be the ideal time. Your dream price might be more within reach than you think. In our local market, buyers have been willing to offer above the market price to secure their dream home and live in our beautiful community.
Thinking about selling your home but still on the fence? What is your aspirational price at which, if offered from a real buyer, you would consider selling?
We have the solution. We can discreetly test your aspirational sale price by entering it into the "Make Me Sell" category of our Compass Platform Database next to your property and wait. This will be exclusively available to our extensive network of 30,000± Compass agents across the country.
LEARN MORE
Your price, property details, and personal information remain completely confidential until you are ready. We will connect with other Compass buyer's agent and present your property details and your aspirational price.
This is a no risk way to test the market and not incur Days on Market. With each additional day a home is on the market publicly, the value of the property erodes. With your property available discreetly, we eliminate that trap.
Reach out to discuss the details. There is no paperwork to sign and zero obligation to sell. Just expect a call from us when we identify interested buyer!

Many Think Selling Their Home The Traditional Way Delivers The Most Value
. . .

In the same way Hollywood launches multiple trailers to build anticipation for a movie premiere, the Compass Three Phased Marketing Strategy lets you launch your property multiple times, to build maximum excitement and demand.

- let's talkRANDY/MOLLY
Check out our carefully curated Compass Collection which includes properties we consider to be exceptional, excellent investments and/or good values - call/text/email for details or a private showing at 805.880.6530.
These properties are available at time of publication, but the market is still moving fast due to historically low inventory. Stay ahead of the market by getting in touch for a list of the most up to inventory—including Compass Private Exclusives (off market) and Coming Soon homes that are not available below or on public search sites.

Single Family Homes + Condominiums -2% change over YTD 2023 (167 total sales)
163
TOTAL 2024 SALES 0% change over 2023
145
AVERAGE SALES PRICE
+16% increase over 2023
$7,602,453
MEDIAN SALES PRICE
+4% increase over 2023
$5,500,500
TOTAL 2024 SALES -18% change over 2023
18
AVERAGE SALES PRICE +20% change over 2023
$3,783,092
MEDIAN SALES PRICE +11% change over 2023
$3,212,500
TOTAL AVERAGE DAY ON MARKET 67 SOLD TO ORIGINAL LIST PRICE 91%
Single Family Homes + Condominiums (combined sales)
14
AVERAGE SALES PRICE
+11% change over 2023
$5,591,939
MEDIAN SALES PRICE
-5% change over 2023
$4,246,000
HIGHEST SALES PRICE
770 San Ysidro Lane Montecito CA 93108
$13,500,000
LOWEST SALES PRICE
1220 Coast Village Road, Unit 211 Montecito CA 93108
$1,715,650 Condominium Home
TOTAL AVERAGE DAY ON MARKET
81 SOLD TO ORIGINAL LIST PRICE 86%
ADDRESS LIST PRICE SOLD PRICE % LIST DOM
JANUARY / 16 TRANSACTIONS
1035 Alston Road
515 Santa Angela Ln
608 STONE MEADOW LN
900 West Park Lane
$16,850,000 $14,500,000 86% 150
$8,450,000 $7,825,000 93% 59
$7,950,000 $7,950,000 100% 1
$7,950,000 $6,780,000 85% 176
839 Summit $5,900,000 $5,900,000 100% 1
301 San Ysidro Road
674 Oak Grove Drive
1365 Virginia Road
830 Summit Road
547 Owen Road
$6,850,000 $5,700,000 83% 227
$5,825,000 $5,015,000 86% 85
$4,795,000 $4,675,000 97% 53
$4,795,000 $4,500,000 94% 11
$5,150,000 $4,500,000 87% 310
919 Aleeda Lane $3,950,000 $3,900,000 99% 17
1557 Miramar Lane $3,595,000 $3,620,000 101% 10
11 Cedar Lane $2,675,000 $2,675,000 100% 5
621 Barker Pass Road $2,500,000 $2,400,000 96% 22
195 CANON VIEW ROAD $2,700,000 $2,700,000 100% 1
633 Circle Drive $1,950,000 $1,950,000 100% 1
FEBRUARY / 13 TRANSACTIONS
875/885 Park Lane
$43,500,000 $36,800,000 85% 99
319 San Ysidro Road $39,950,000 $32,000,000 80% 1
777 Romero Cyn Rd $25,000,000 $25,124,500 100% 48
303 Meadowbrook Dr $13,000,000 $9,650,000 74% 455
172 Santa Elena Lane
$8,495,000 $8,470,000 100% 19
865 Romero Canyon Rd $7,100,000 $7,100,000 100% 220
454 Meadowbrook Dr $5,750,000 $5,950,000 103% 10
937 Arcady Road
$5,295,000 $5,400,000 102% 27
285 Bonnie Lane $5,095,000 $4,900,000 96% 1
740 Hot Springs Road $4,000,000 $4,000,000 100% 1
3035 Hidden Valley Ln $3,595,000 $3,595,000 100% 1
161 Loureyro Road $3,495,000 $3,025,000 87% 100
988 Coyote Road $3,499,000 $2,500,000 71% 160
MARCH / 12 TRANSACTIONS
1530 Mimosa Lane $16,500,000 $16,500,000 100% 26
812 BUENA VISTA AVE $14,750,000 $14,750,000 100% 1
1580 Ramona Lane $8,450,000 $8,450,000 100% 1
1564 Ramona Lane
$9,500,000 $8,200,000 86% 159
433 Alcala Lane $6,950,000 $6,550,000 94% 15
602 Parra Grande Ln $6,200,000 $5,800,000 94% 42
1320 Plaza Pacifica $4,500,000 $4,500,000 100% 13
227 Hot Springs Road $3,300,000 $3,300,000 100% 1
734 El Rancho Road $3,595,000 $3,210,000 89% 16
845 Woodland Drive $3,595,000 $3,075,000 86% 77 847 Deerpath Road $2,795,000 $2,650,000 95% 11 1050 Fairway Road $1,750,000 $1,700,000 97% 1
ADDRESS LIST PRICE SOLD PRICE % LIST DOM APRIL / 17 TRANSACTIONS
595 Picacho Lane $36,500,000 $30,242,500 83% 168 1581 S Jameson Lane $21,950,000 $21,010,000 96% 1 377 Santa Rosa Lane $16,500,000
ADDRESS
JULY / 11 TRANSACTIONS
771 GARDEN LANE
$28,400,000 $28,400,000 100% 1
680 Buena Vista Drive $10,900,000 $9,500,000 87% 14
2475 Bella Vista Drive
1666 San Leandro Lane
31 SEAVIEW
2868 East Valley Road
$8,650,000 $8,450,000 98% 13
$5,000,000 $6,200,000 124% 11
$5,500,000 $5,500,000 100% 1
$4,900,000 $4,300,000 88% 76
1295 Spring Road $3,975,000 $4,000,000 101% 8
334 Seaview Drive $4,395,000 $3,500,000 80% 106
99 SIERRA VISTA ROAD
$3,075,000 $3,075,000 100% 1
28 Rosemary Lane $2,250,000 $2,000,000 89% 60
1220 Coast Vlg Rd #303 $1,750,000 $1,525,000 87% 146
AUGUST / 15 TRANSACTIONS
2039 Boundary Drive $10,900,000 $11,050,000 101% 1 1130 E Mountain Drive $12,995,000 $11,050,000 85% 61 2128 Birnam Wood Drive $11,250,000 $11,000,000 98% 1
1 MIRAMAR AVENUE $8,583,500 $8,583,500 100% 1
2175 Boundary Drive $6,650,000 $6,400,000 96% 1 1046 Cima Linda Lane $6,500,000 $6,287,874 97% 29 150 Santa Elena Lane $5,850,000 $5,850,000 100% 6 501 Hodges Lane $6,750,000 $5,675,000 84% 159 975 Mariposa Lane $6,895,000 $5,155,000 75% 289 843 Knapp Drive $4,495,000 $4,400,000 98% 8 181 Coronada Circle $3,750,000 $4,062,000 108% 9 179 SANTA ISABEL LN $4,000,000 $4,000,000 100% 1
1315 Plaza Pacifica $3,200,000 $2,625,000 82% 97 15 Chase Drive $2,665,000 $2,555,000 96% 34 1930 N Jameson Lane A $1,450,000 $1,270,000 88% 46
SEPTEMBER / 15 TRANSACTIONS
416 Meadowbrook Drive$16,950,000 $16,780,500 99% 1
167 Pomar Lane $10,600,000 $10,600,000 100% 1 161 La Vereda Road $9,950,000 $9,750,000 98% 1 2760 SYCAMORE CYN RD $9,000,000 $9,000,000 100% 1
2297 Featherhill Road $7,975,000 $7,800,000 98% 45
109 Olive Mill Road $7,500,000 $7,000,000 93% 37 1545 Ramona Lane $7,995,000 $6,700,000 84% 228
1385 Plaza Pacifica $6,700,000 $6,400,000 96% 50
499 Monarch Lane $5,700,000 $5,500,000 96% 12
175 Miramar Avenue $8,000,000 $5,500,000 69% 424
585 Stone Meadow Ln $6,200,000 $5,250,000 85% 34
61 Olive Mill Road $3,850,000 $3,850,000 100% 1
1284 Spring Road $3,395,000 $3,275,000 96% 27
651 Romero Canyon Rd $2,595,000 $2,200,000 85% 68
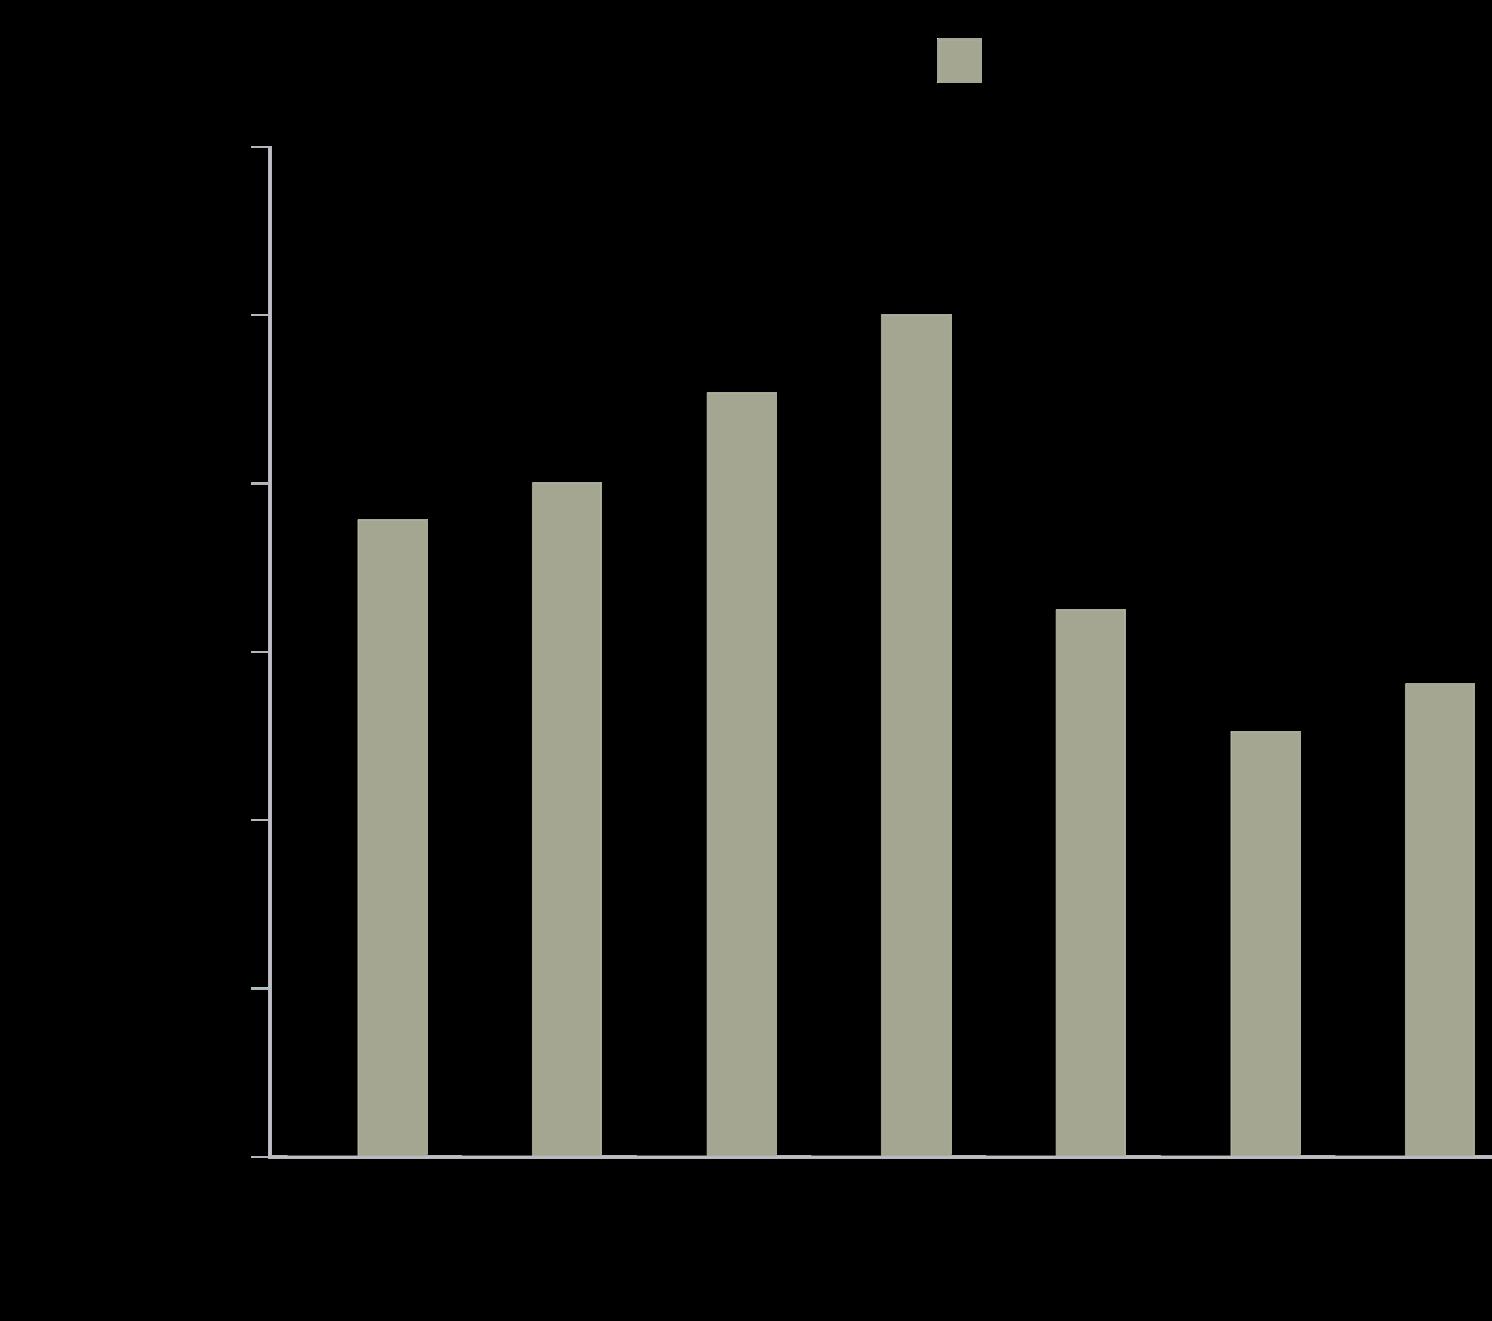
- homes | estates | puds | condosYEAR END 2024 | TOTAL SALES
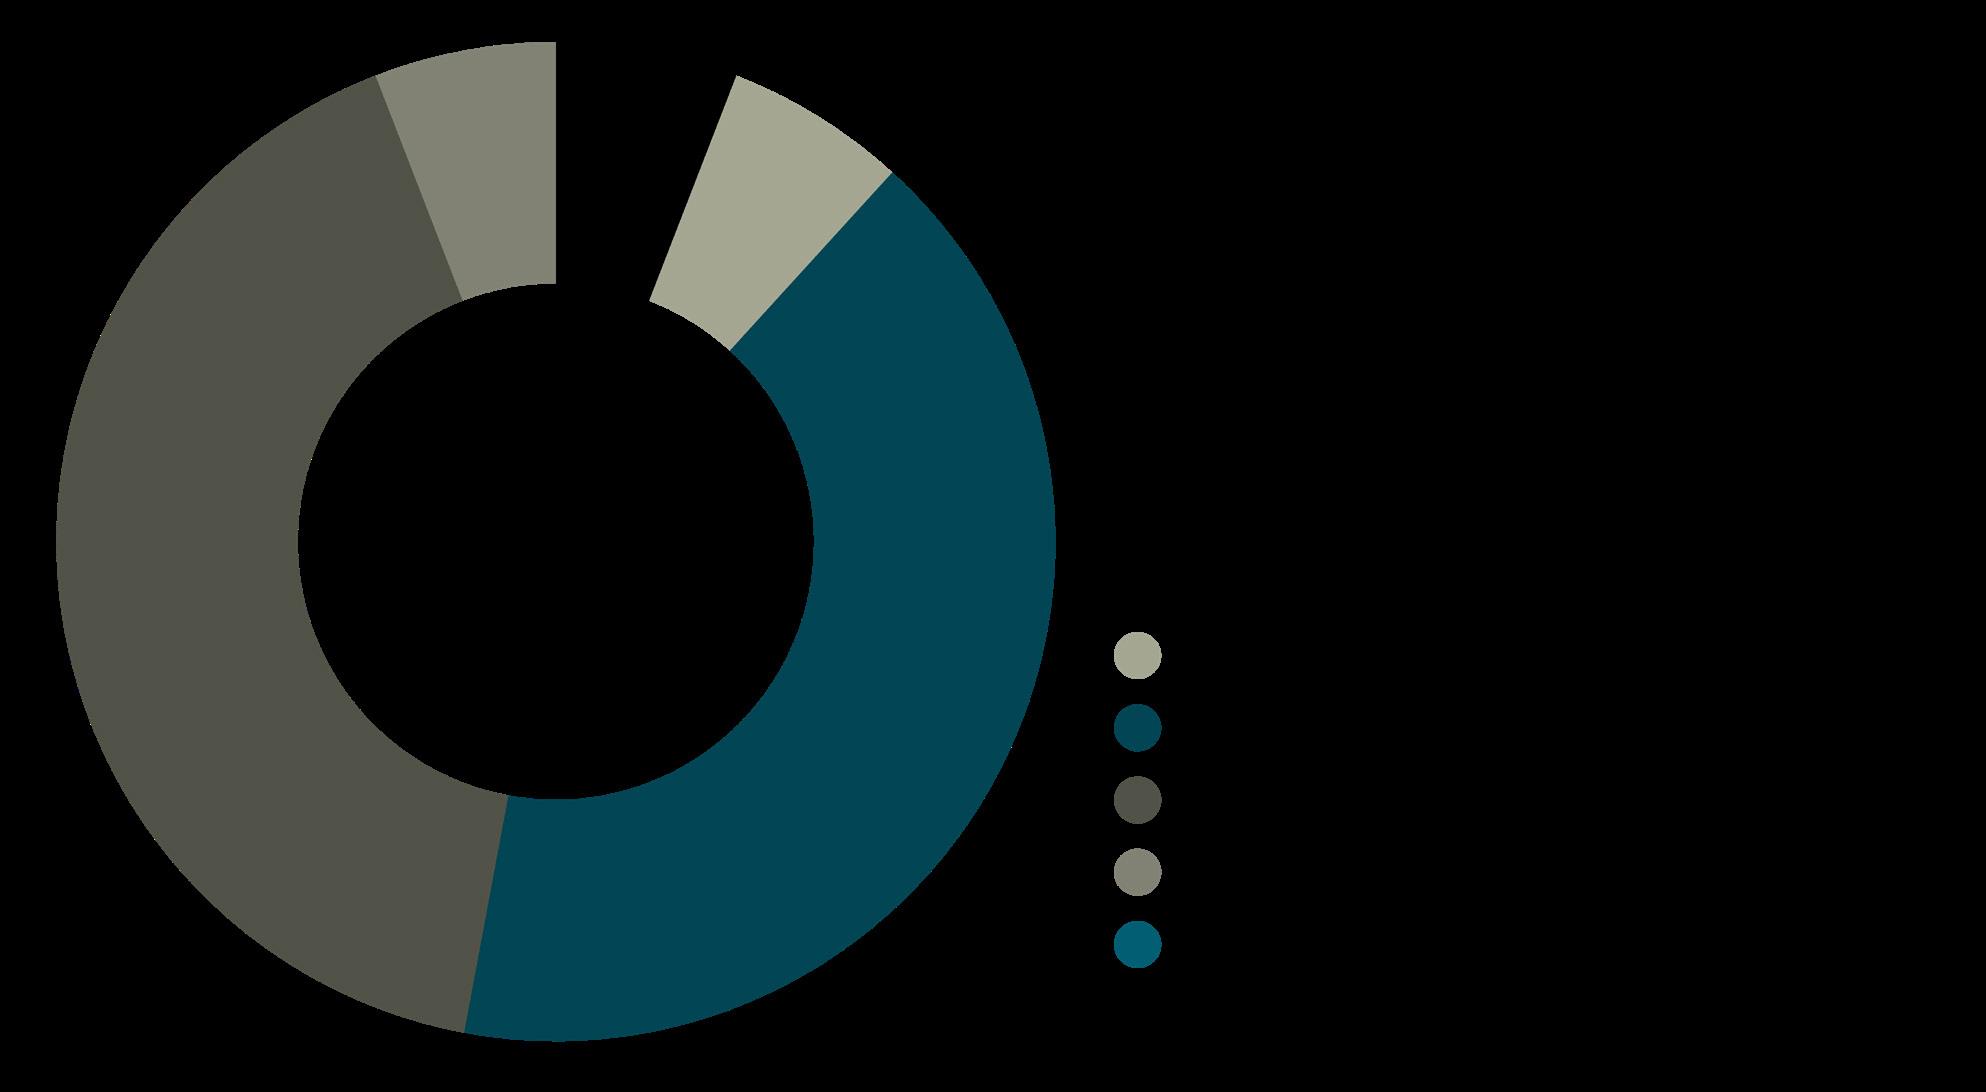
Distributed by Price Range
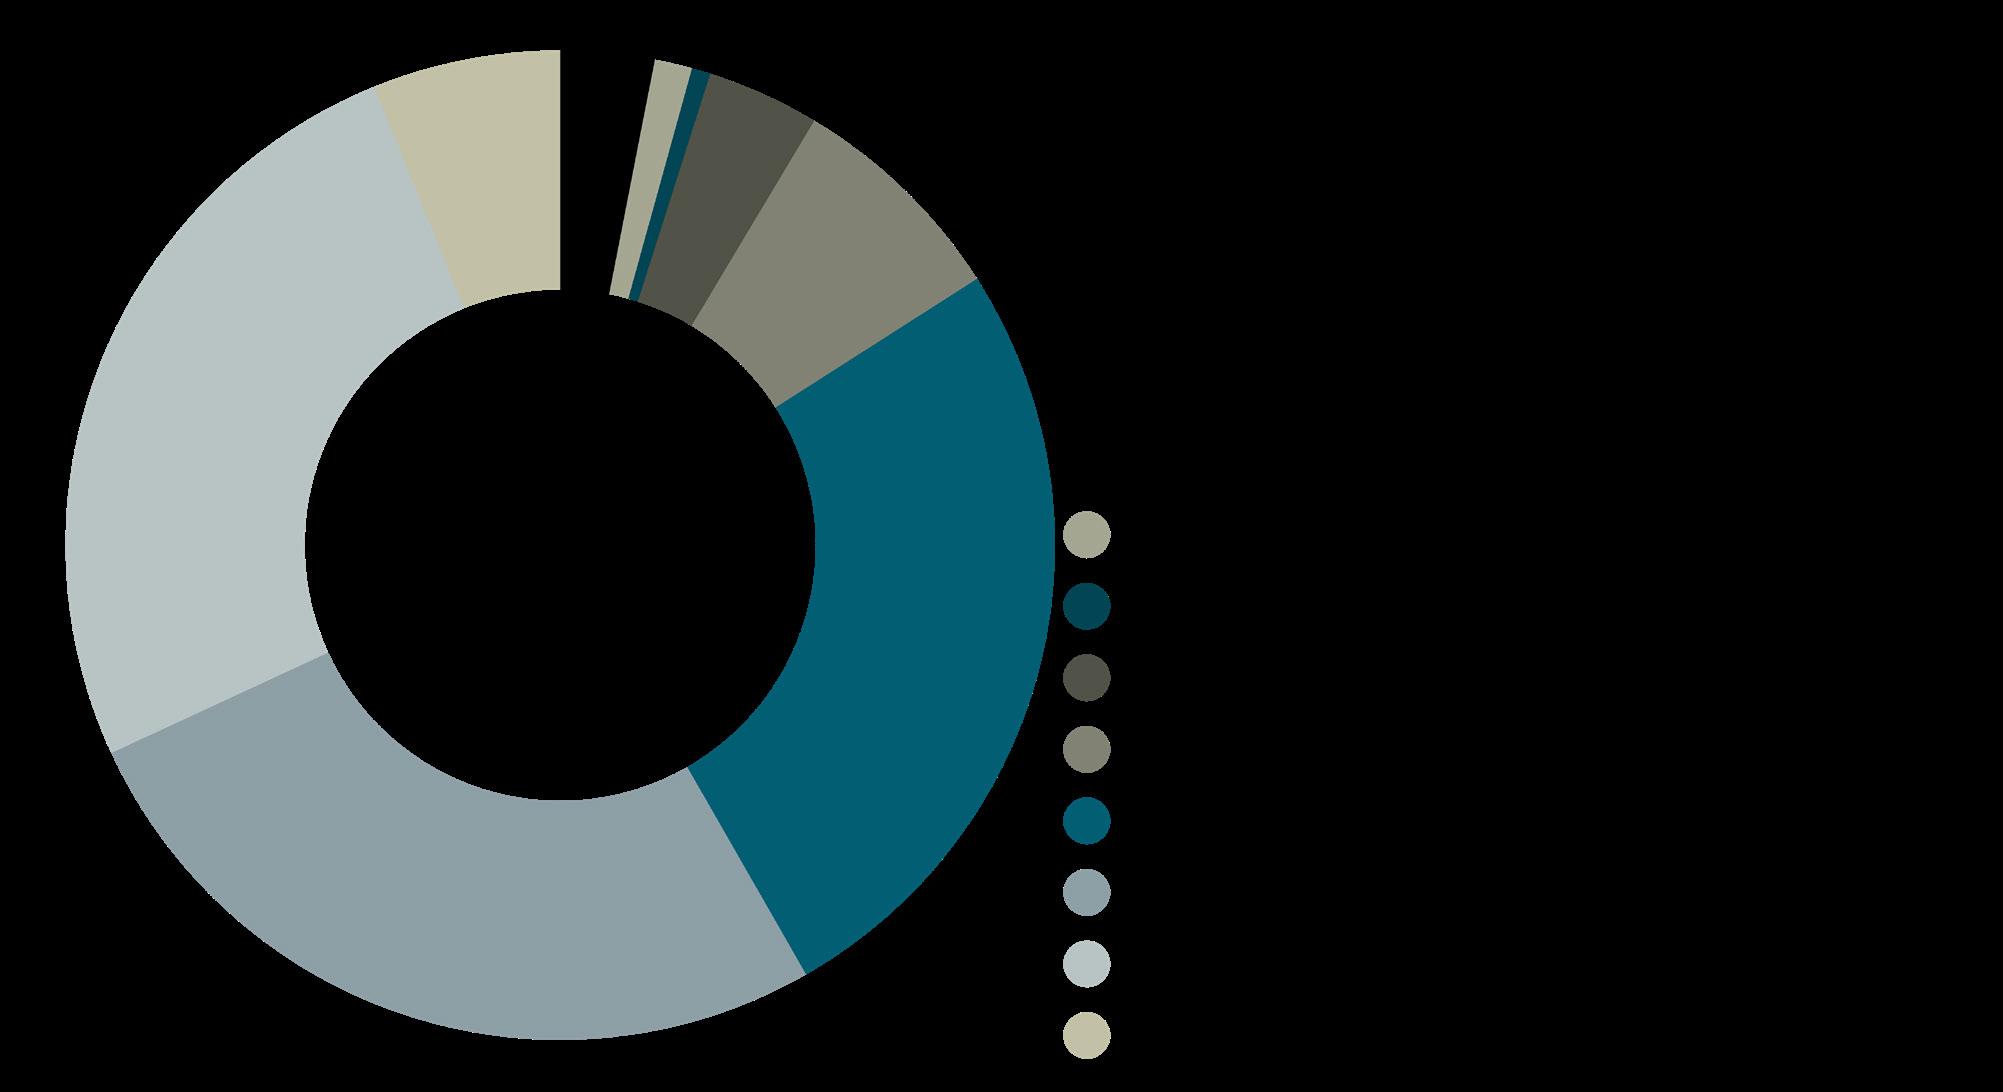
sales
55% YTD SALES ALL CASH
93 of the 163 Total Sales
2024 TOTAL SALES
163 Total Transactions Dollars In Millions
12% YTD SALES OFF MARKET
20 of the 163 Total Sales
$7,180,683 $5,400,000
Single Family Homes (no condos in Hope Ranch) -15% change over YTD 2023 (20 total sales)
SINGLE FAMILY HOMES
TOTAL 2024 SALES
-15% change over 2023
17
AVERAGE SALES PRICE
-11% increase over 2023
$6,259,993
MEDIAN SALES PRICE
+5% increase over 2023
$6,053,000
TOTAL AVERAGE DAY ON MARKET
17 CONDOMINIUM HOMES
No Condos in Hope Ranch N/A
AVERAGE SALES PRICE N/A
MEDIAN SALES PRICE N/A
121 SOLD TO ORIGINAL LIST PRICE 87%
Single Family Homes (no condos in Hope Ranch)
1
AVERAGE SALES PRICE
n/a change from 2023
$5,350,000
MEDIAN SALES PRICE n/a change from 2023
$5,350,000
TOTAL AVERAGE DAY ON MARKET
HIGHEST SALES PRICE
785 Carosam Road Hope Ranch CA 93
$5,350,000
LOWEST SALES PRICE
785 Carosam Road Hope Ranch CA 93
$5,350,000
64 SOLD TO ORIGINAL LIST PRICE 94%
puds
Distributed by Price Range
2024 QUARTER SALES
17 Total Transactions Dollars In Millions 17 sales
12% YTD SALES OFF MARKET
2 of the 17 Total Sales 41% TOTAL 20244 ALL CASH 7 of the 17 Total Sales
20 Year Trend | 2005— 2024
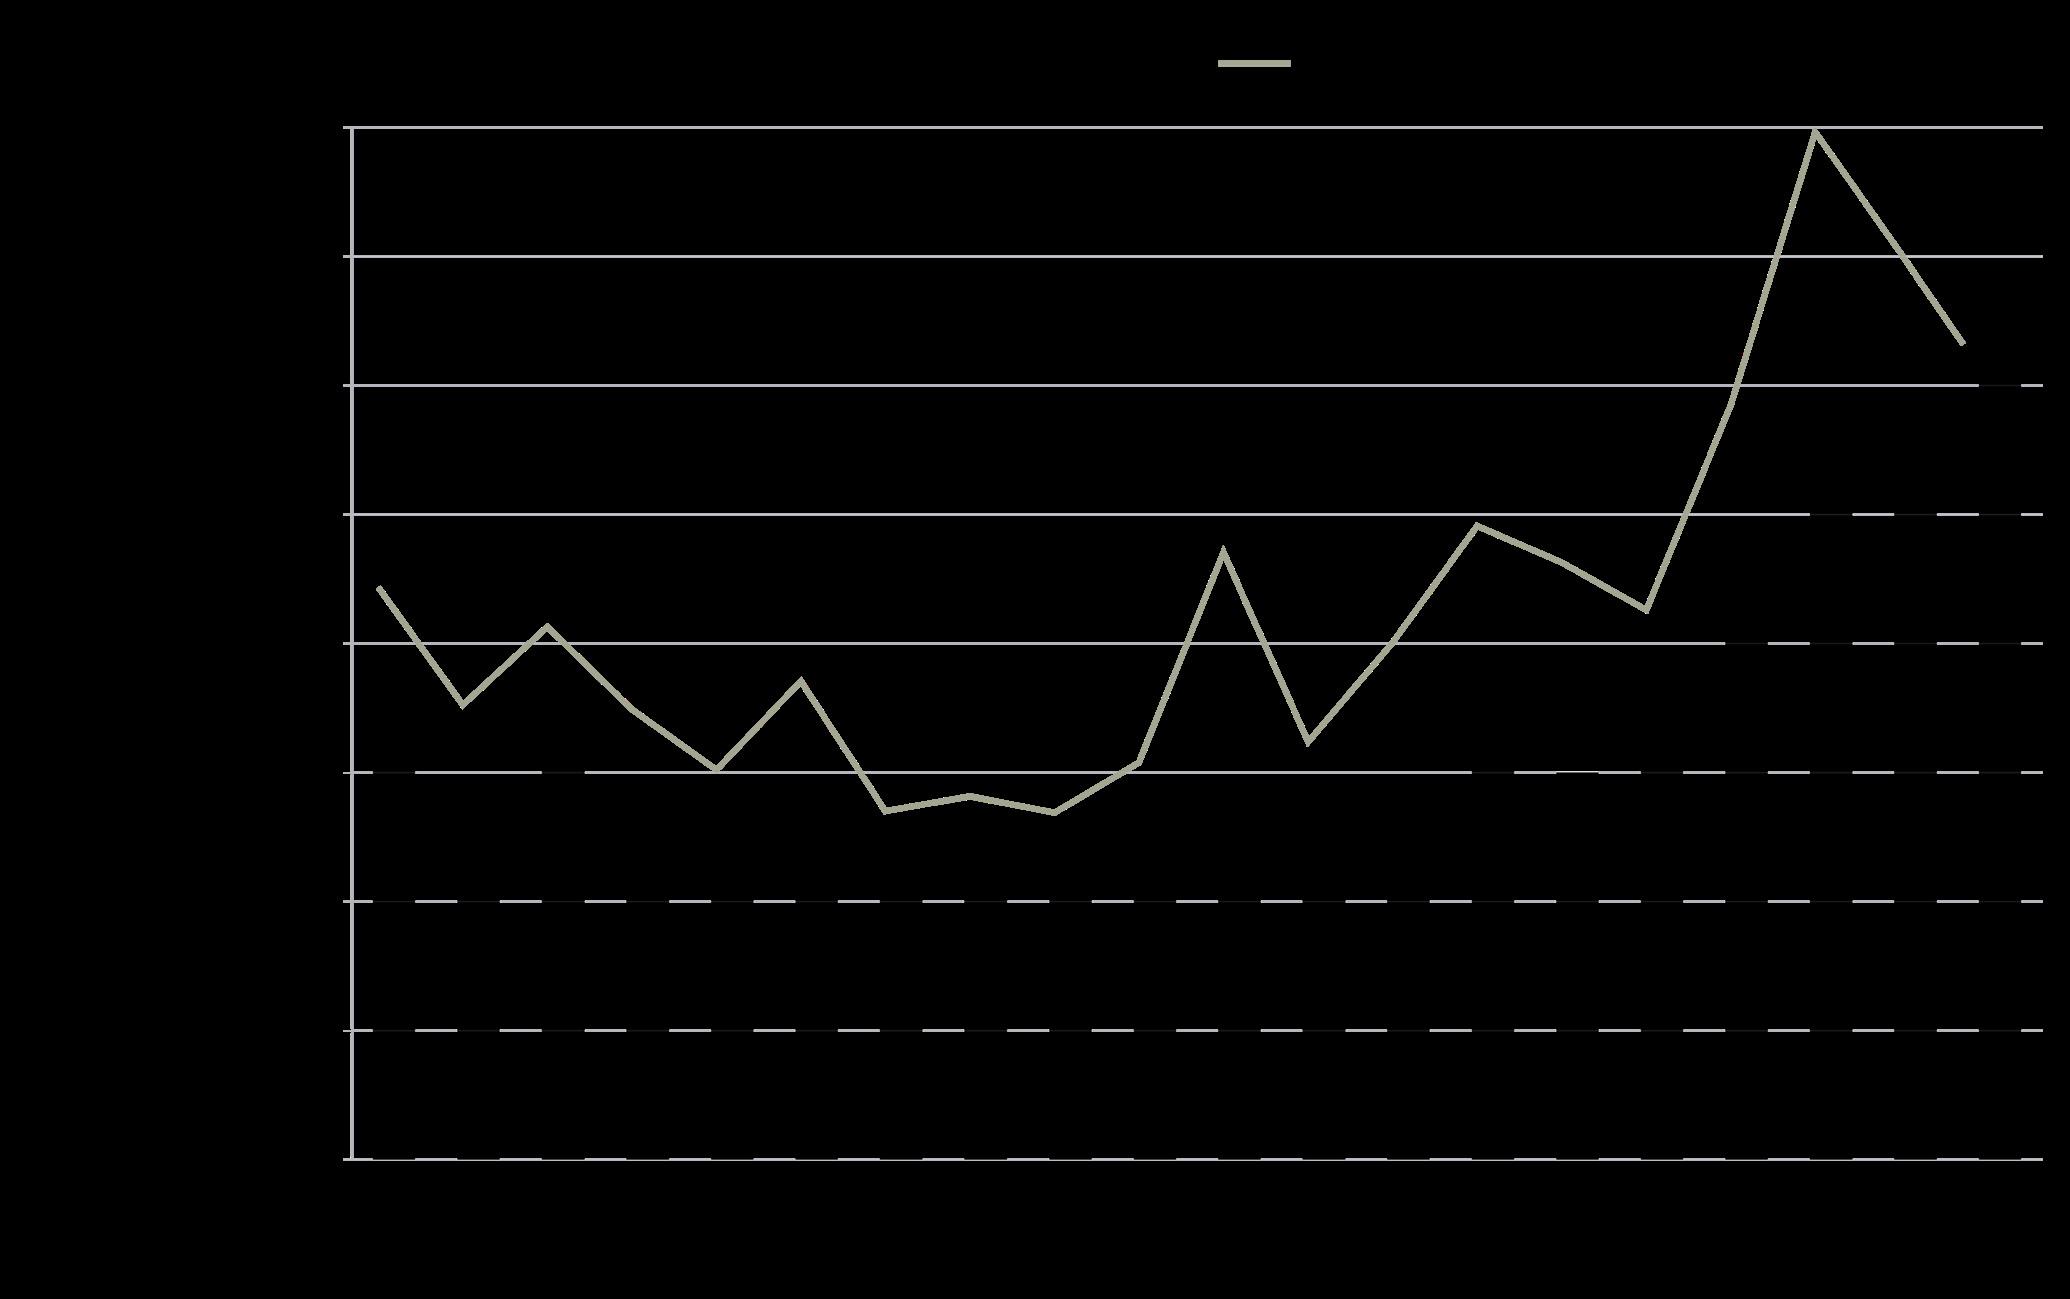
$6,316,867 $6,116,500


Single Family Homes + Condominiums +11% change over 2023 (502 total sales)
558
TOTAL 2024 SALES
+21% change over 2023
429
AVERAGE SALES PRICE
+8% increase over 2023
$2,490,110
MEDIAN SALES PRICE
+7% increase over 2023
$2,140,000
CONDOMINIUM HOMES
TOTAL 2024 SALES -13% change over 2023
129
AVERAGE SALES PRICE -2% change over 2023
$1,281,150
MEDIAN SALES PRICE -3% change over 2023
$1,085,000
Single Family Homes + Condominiums (combined sales)
AVERAGE SALES PRICE
-8% change over 2023
$1,794,413
MEDIAN SALES PRICE
+13% change over 2023
$1,696,500
HIGHEST SALES PRICE
3002 Paseo Tranquillo
Santa Barbara CA 93105
$3,800,000
LOWEST SALES PRICE
529 De La Vina Street
Santa Barbara CA 93101
$650,000

Single Family Homes + Condominiums 0% change over 2023 (13 total sales)
13
TOTAL 2024 SALES
+33% change over 2023
12
AVERAGE SALES PRICE
-29% increase over 2023
$3,675,750
MEDIAN SALES PRICE
-9% increase over 2023
$3,182,500
TOTAL 2024 SALES -75% change over 2023
1
AVERAGE SALES PRICE -33% increase over 2023
$999,999
MEDIAN SALES PRICE -33% increase over 2023
$999,999
Single Family Homes + Condominiums (combined sales)
1
AVERAGE SALES PRICE
n/a change over 2023
$8,500,000
MEDIAN SALES PRICE
n/a change over 2023
$8,500,000
HIGHEST SALES PRICE
255 Lambert Road Summerland CA 93067
$8,500,000
LOWEST SALES PRICE
255 Lambert Road Summerland CA 93067
$8,500,000

Single Family Homes + Condominiums 0 change over 2023 (113 total sales)
113
TOTAL 2024 SALES -18% change over 2023
51
AVERAGE SALES PRICE +146% increase over 2023
$7,351,386
MEDIAN SALES PRICE +25% increase over 2023
$2,000,000
CONDOMINIUM
TOTAL 2024 SALES +22% change over 2023
62
AVERAGE SALES PRICE +22% change over 2023
$1,016,566
MEDIAN SALES PRICE +7% change over 2023
$840,000
Single Family Homes + Condominiums (combined sales)
AVERAGE SALES PRICE
+55% change over 2023
$2,231,667
MEDIAN SALES PRICE
+12% change over 2023
$1,465,000
HIGHEST SALES PRICE
800 Rincon Hill Road
Carpinteria CA 93013
$5,200,000
LOWEST SALES PRICE
130 Ash Avenue, Unit 3
Carpinteria CA 93013
$705,000 Condominium Home

Single Family Homes + Condominiums +27% change over 2023 (290 total sales)
369
TOTAL 2024 SALES
+31% change over 2023
240
AVERAGE SALES PRICE
+2% increase over 2023
$1,837,995
MEDIAN SALES PRICE
+9% increase over 2023
$1,622,500
TOTAL 2024 SALES
+21% change over 2023
129
AVERAGE SALES PRICE +11% change over 2023
$1,035,987
MEDIAN SALES PRICE +14% change over 2023
$942,000
Single Family Homes + Condominiums (combined sales)
AVERAGE SALES PRICE
+8% change over 2023
$1,480,730
MEDIAN SALES PRICE
+9% change over 2023
$1,350,000
HIGHEST SALES PRICE
1070 Oakside Way Goleta CA 93117
$3,745,000
LOWEST SALES PRICE
410 Camino Del Remedio, Unit F Goleta CA 93117
$420,000 Condominium Home


Now more than ever you need an expert advisor on your side who can provide comprehensive analysis and exclusive insights into today’s fast-paced housing market. We see every luxury property available and know the market. Our commitment to staying educated on what’s happening with economic news, the real estate market, local sales and listings is essential to your success when buying or selling properties.
We strive to deliver a high level of personalized service—personally! We provide our clients with cutting-edge strategies that produce ideal results. Our exceptional service is driven by efficient communication, understanding your needs and having expansive industry resources— combined with expert knowledge of the extensive contracts and required forms to protect your best interests. The process comes together as a result of our years of successful negotiating which leads to a winning deal. We listen carefully, anticipate your needs, execute the deal and handle all the details. The hard work starts when a contract is in place so you will be happy you chose representation experienced in closing the deal smoothly.
Sell a Home | Build a Home initiative. We are deeply connected and committed to the communities in which we live and work. Haden Homes Luxury Property Group has made a pledge to help individuals with housing needs by partnering with Habitat for Humanity. For every home that our clients buy or sell, Haden Homes makes a donation to Santa Barbara’s Habitat for Humanity.

Privacy is the Ultimate Commodity And the Decision to Sell Your Home Is a Personal One.
Decide When to Share Details About Your Home - Including PriceMore Expansively On Your Own Timing.
Exclusive Exposure To Compass Agents, Including Premium Placements On Agent Facing Platform.
Get the Best Offer by Testing The Market Privately to Gather Key Insights Without Your Listing Getting Stale or Overexposed.


Ask Us About Our Exciting Private Exclusive Listings | Contact Us Live For details!
A Compass Private Exclusive listing is an off-market home that can be shared by a Compass agent directly with their colleagues and their buyers. Property details are not disseminated widely and won’t appear on public home search websites.
Listing your home as a private exclusive allows you to control what information is shared about you and your home while still getting exposure to top agents at Compass.

- click link for full article -
Compass CEO Tops List of Real Estate’s Most Powerful Leaders
The Housing Market Hasn’t Been This Slow in Almost 30 Years | High Mortgage Rates + Low Inventory Have Kept Homes Out of Reach for Many People in the US
Five Factors That Could Make or Break Housing Markets in 2025
Interior Design Trends of 2025 Include a Refresh on Maximalism Accomplished Designers Share Thoughts on 2025's Anticipated Home Decor Trends
Overstimulated at Home? How a Soothing, Clutter-Free Space Can Still Include Art Designers Offer Thoughts on Genres + Colors That Complement Understated Vibe
The Most Expensive US Home Sales This Year Included Seven Deals Over $100 Million
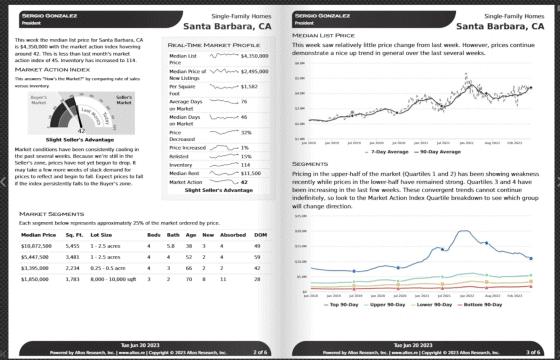


All information provided is deemed reliable but has not been verified. We do not guarantee it and recommend buyers make their own inquiries. Data source Fidelity National Title of Santa Barbara, CORT and Santa Barbara MLS. INdata Real Estate Market Reporting through December 2024.
Properties featured are courtesy of the Santa Barbara MLS and are available for sale at time of publication. They may be listed by brokers and/or agents other than Compass or Haden Homes Luxury Property Group. Contact us for details or to set up a private showing at 805.880.6530.


On December 18th, the Fed dropped its benchmark rate for the 3ra time since summer, by another quarter percent, but suggested only 2 further reductions in 2025 - which was not what investors and bond markets wanted to hear. This caused stock markets to fall from recent highs and mortgage interest rates to spike up, but, so far, these are very short-term reactions, and may quickly change course again. In early December readings, the U.S. jobs report rebounded, inflation ticked up slightly, and consumer confidence hit its highest point in 7 months. And, as of the date of this report, a government shutdown looms once again due to the inability of Congress to agree on a spending bill.
• National existing-home sales in November 2024 fell 9.5% from October but rose 5% from November 2023. Though continuing to drop from the usual June peaks, year over year, the median single-family-home sales price and median condo/co-op sales price were up 4.8% and 2.8% respectively.
• Moving into the mid-winter holiday slowdown, the numbers of new listings, homes for sale, listings pending sale, and closed sales all declined, and can be expected to drop further in December.
• Approximately 53% of sales went into contract in less than 1 month (vs. 62% in 11/23), 18% sold over list price, and 25% of buyers purchased all-cash. The median days-on-market to acceptance of offer was 32 days (vs. 25 days last year), and sold listings received an average of 2.1 offers.
• Approximately, 30% of purchases were by first-time buyers, and 4% by vacation home buyers.
It is difficult to make definitive determinations about where the market is heading in 2025 from end-of-year statistics, but in the last several years, demand rebounded substantially early in the new year and then accelerated into spring. As always, much depends on political and macroeconomic factors that are challenging to predict.