AREA REPORT


JANUARY 2023
AREA REPORT
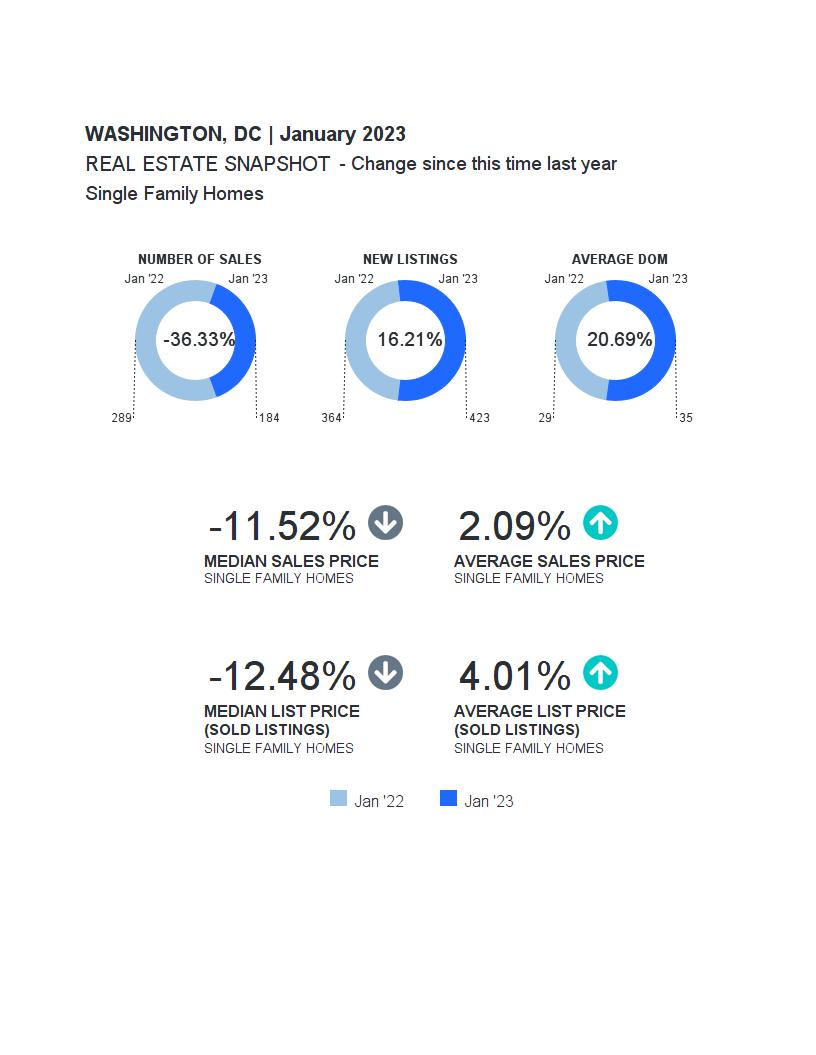
WASHINGTON, DC
FULL MARKET SUMMARY
January 2023 | Single Family Homes
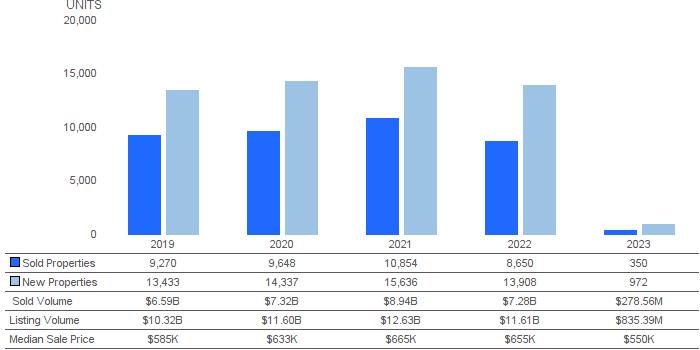
SOLD AND NEW PROPERTIES (UNITS)
January 2023 | Single Family Homes

Month to Date Year to Date January 2023 January 2022 % Change YTD 2023 YTD 2022 % Change New Listings 423 364 16.21% 423 364 16.21% Sold Listings 184 289 -36.33% 184 289 -36.33% Median List Price (Solds) $735,000 $839,800 -12.48% $735,000 $839,800 -12.48% Median Sold Price $730,000 $825,000 -11.52% $730,000 $825,000 -11.52% Median Days on Market 24 15 60% 24 15 60% Average List Price (Solds) $1,059,366 $1,018,476 4.01% $1,059,366 $1,018,476 4.01% Average Sold Price $1,034,690 $1,013,484 2.09% $1,034,690 $1,013,484 2.09% Average Days on Market 35 29 20.69% 35 29 20.69% List/Sold Price Ratio 97.4% 99.9% -2.48% 97.4% 99.9% -2.48%
Sold Properties| Number of properties sold during the year New Properties | Number of properties listed during the year.
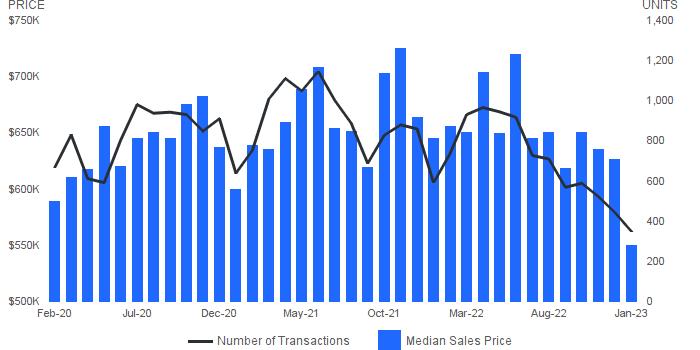
MEDIAN SALES PRICE AND NUMBER OF SALES

January 2023 | Single Family Homes
Median Sales Price | Price of the ""middle"" property sold -an equal number of sales were above and below this price.
Number of Sales | Number of properties sold.
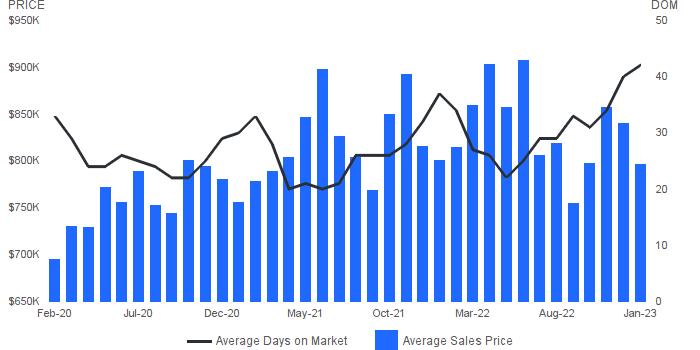
AVERAGE SALES PRICE AND AVERAGE DAYS ON MARKET

January 2023 | Single Family Homes
Average Sales Price| Average sales price for all properties sold. Average Days on Market | Average days on market for all properties sold.


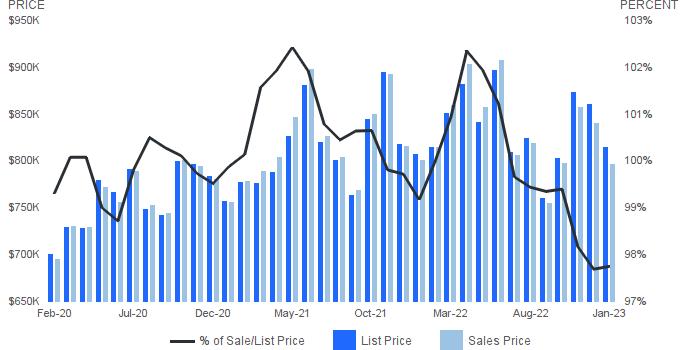
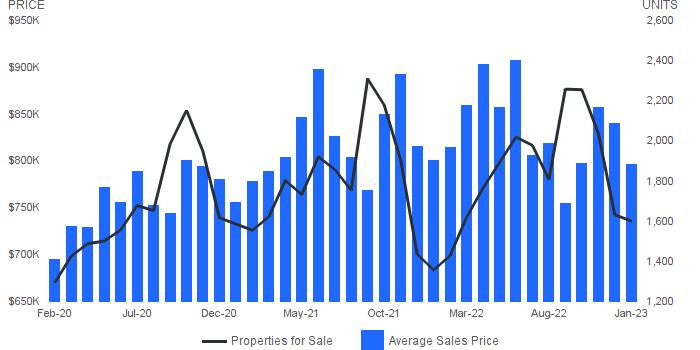
SALES PRICE AS A PERCENTAGE OF ORIGINAL PRICE January 2023 | Single Family Homes Sale Price as a Percentage of Original Price| Average sale price of property as percentage of final list price. AVERAGE SALES PRICE AND NUMBER OF PROPERTIES FOR SALE January 2023 | Single Family Homes Average Sales Price| Average sales price for all properties sold. Properties for Sale | Number of properties listed for sale at the end of month.
PROPERTIES FOR SALE AND SOLD PROPERTIES
January 2023 | Single Family Homes
Properties for Sale | Number of properties listed for sale at the end of month.
Sold Properties| Number of properties sold.

AVERAGE ASKING/SOLD/UNSOLD PRICE

January 2023 | Single Family Homes
Unsold Price| the average active list price
Asking Price | the average asking price of sold properties
Sold Price | the average selling price
ABSORPTION RATE
January 2023 | Single Family Homes
Absorption Rate | Looks at the past year's monthly supply of inventory. In a normal market there should be a 6 month supply. The higher the rate above 6 the more aggressive a seller has to be with the competition; price and having a picture perfect property.
MONTHS SUPPLY OF INVENTORY

January 2023 | Single Family Homes
Months Supply of Inventory | Properties for sale divided by number of properties sold.

Units Listed | Number of properties listed for sale at the end of month.
Units Sold| Number of properties sold.
AREA REPORT
WASHINGTON, DC
FULL MARKET SUMMARY
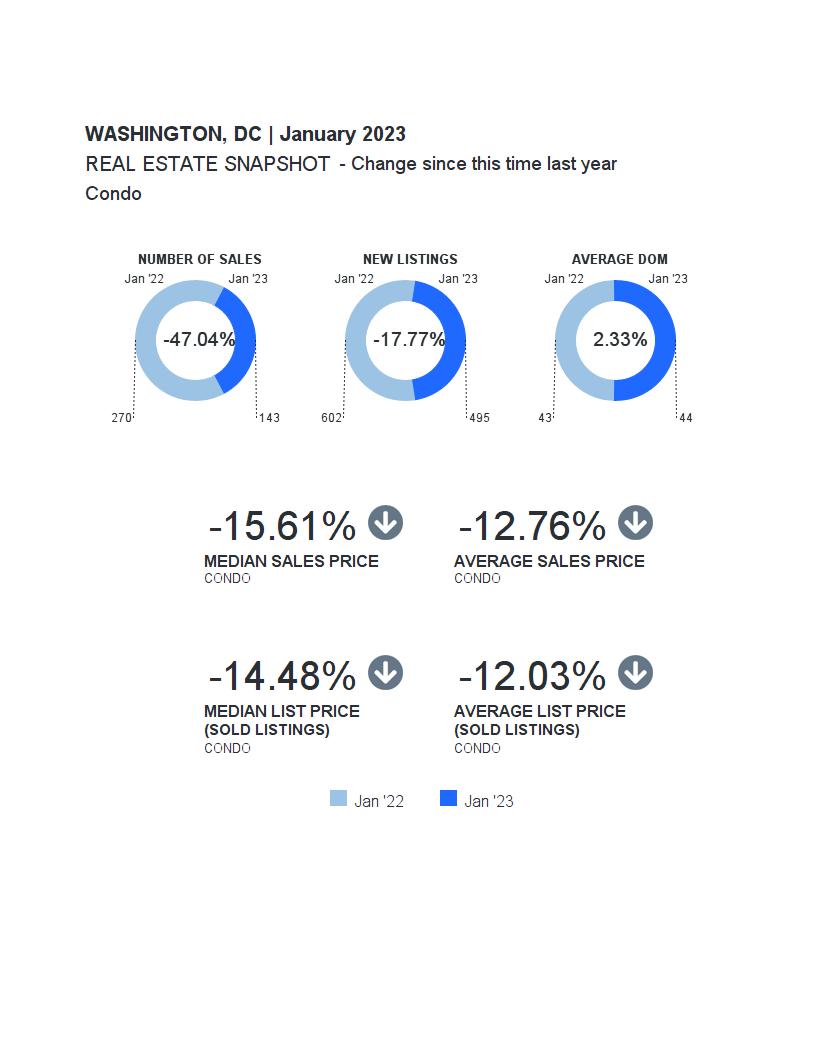
January 2023 | Condo

SOLD AND NEW PROPERTIES (UNITS)
Month to Date Year to Date January 2023 January 2022 % Change YTD 2023 YTD 2022 % Change New Listings 495 602 -17.77% 495 602 -17.77% Sold Listings 143 270 -47.04% 143 270 -47.04% Median List Price (Solds) $449,000 $525,000 -14.48% $449,000 $525,000 -14.48% Median Sold Price $443,000 $524,950 -15.61% $443,000 $524,950 -15.61% Median Days on Market 29 33 -12.12% 29 33 -12.12% Average List Price (Solds) $532,327 $605,151 -12.03% $532,327 $605,151 -12.03% Average Sold Price $522,946 $599,460 -12.76% $522,946 $599,460 -12.76% Average Days on Market 44 43 2.33% 44 43 2.33% List/Sold Price Ratio 99.5% 99.1% 0.41% 99.5% 99.1% 0.41%
Condo Sold Properties| Number of properties sold during the year New Properties | Number of properties listed during the year.
January 2023 |
MEDIAN SALES PRICE AND NUMBER OF SALES
January 2023 | Condo
Median Sales Price | Price of the ""middle"" property sold -an equal number of sales were above and below this price.
Number of Sales | Number of properties sold.
AVERAGE SALES PRICE AND AVERAGE DAYS ON MARKET

January 2023 | Condo
Average Sales Price| Average sales price for all properties sold. Average Days on Market | Average days on market for all properties sold.


SALES PRICE AS A PERCENTAGE OF ORIGINAL PRICE January 2023 | Condo Sale Price as a Percentage of Original Price| Average sale price of property as percentage of final list price. AVERAGE SALES PRICE AND NUMBER OF PROPERTIES FOR SALE January 2023 | Condo Average Sales Price| Average sales price for all properties sold. Properties for Sale | Number of properties listed for sale at the end of month.
PROPERTIES FOR SALE AND SOLD PROPERTIES
January 2023 | Condo
Properties for Sale | Number of properties listed for sale at the end of month.
Sold Properties| Number of properties sold.

AVERAGE ASKING/SOLD/UNSOLD PRICE
January 2023 | Condo
Unsold Price| the average active list price
Asking Price | the average asking price of sold properties
Sold Price | the average selling price

ABSORPTION RATE
January 2023 | Condo
Absorption Rate | Looks at the past year's monthly supply of inventory. In a normal market there should be a 6 month supply. The higher the rate above 6 the more aggressive a seller has to be with the competition; price and having a picture perfect property.
MONTHS SUPPLY OF INVENTORY

January 2023 | Condo
Months Supply of Inventory | Properties for sale divided by number of properties sold.

Units Listed | Number of properties listed for sale at the end of month.
Units Sold| Number of properties sold.
AREA REPORT
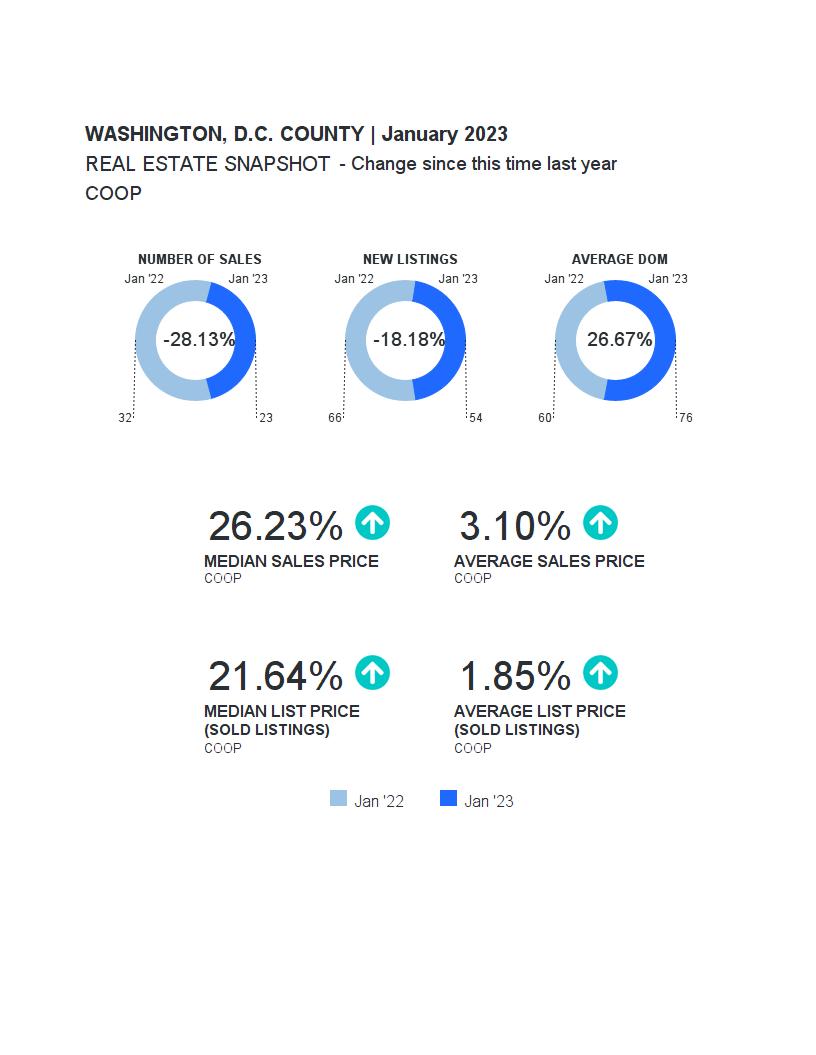
WASHINGTON, D.C. COUNTY
FULL MARKET SUMMARY

January 2023 | COOP
SOLD AND NEW PROPERTIES (UNITS)
January 2023 | COOP
Month to Date Year to Date January 2023 January 2022 % Change YTD 2023 YTD 2022 % Change New Listings 54 66 -18.18% 54 66 -18.18% Sold Listings 23 32 -28.13% 23 32 -28.13% Median List Price (Solds) $450,000 $369,950 21.64% $450,000 $369,950 21.64% Median Sold Price $450,000 $356,500 26.23% $450,000 $356,500 26.23% Median Days on Market 52 56 -7.14% 52 56 -7.14% Average List Price (Solds) $605,813 $594,793 1.85% $605,813 $594,793 1.85% Average Sold Price $582,400 $564,902 3.1% $582,400 $564,902 3.1% Average Days on Market 76 60 26.67% 76 60 26.67% List/Sold Price Ratio 97.6% 96.9% 0.71% 97.6% 96.9% 0.71%
Sold Properties| Number of properties sold during the year New Properties | Number of properties listed during the year.
MEDIAN SALES PRICE AND NUMBER OF SALES

January 2023 | COOP
Median Sales Price | Price of the ""middle"" property sold -an equal number of sales were above and below this price.
Number of Sales | Number of properties sold.
AVERAGE SALES PRICE AND AVERAGE DAYS ON MARKET

January 2023 | COOP
Average Sales Price| Average sales price for all properties sold. Average Days on Market | Average days on market for all properties sold.


SALES PRICE AS A PERCENTAGE OF ORIGINAL PRICE January 2023 | COOP Sale Price as a Percentage of Original Price| Average sale price of property as percentage of final list price. AVERAGE SALES PRICE AND NUMBER OF PROPERTIES FOR SALE January 2023 | COOP Average Sales Price| Average sales price for all properties sold. Properties for Sale | Number of properties listed for sale at the end of month.
PROPERTIES FOR SALE AND SOLD PROPERTIES
January 2023 | COOP
Properties for Sale | Number of properties listed for sale at the end of month.
Sold Properties| Number of properties sold.

AVERAGE ASKING/SOLD/UNSOLD PRICE
January 2023 | COOP
Unsold Price| the average active list price
Asking Price | the average asking price of sold properties
Sold Price | the average selling price

ABSORPTION RATE
January 2023 | COOP
Absorption Rate | Looks at the past year's monthly supply of inventory. In a normal market there should be a 6 month supply. The higher the rate above 6 the more aggressive a seller has to be with the competition; price and having a picture perfect property.
MONTHS SUPPLY OF INVENTORY

January 2023 | COOP
Months Supply of Inventory | Properties for sale divided by number of properties sold.

Units Listed | Number of properties listed for sale at the end of month.
Units Sold| Number of properties sold.

AREA REPORT
Washington, DC
FULL MARKET SUMMARY
January 2023 | All Property Types
SOLD AND NEW PROPERTIES (UNITS)
January 2023 | All Property Types
Month to Date Year to Date January 2023 January 2022 % Change YTD 2023 YTD 2022 % Change New Listings 972 1032 -5.81% 972 1032 -5.81% Sold Listings 350 591 -40.78% 350 591 -40.78% Median List Price (Solds) $550,000 $649,000 -15.25% $550,000 $649,000 -15.25% Median Sold Price $550,000 $645,000 -14.73% $550,000 $645,000 -14.73% Median Days on Market 26 25 4% 26 25 4% Average List Price (Solds) $814,228 $806,707 0.93% $814,228 $806,707 0.93% Average Sold Price $795,884 $800,047 -0.52% $795,884 $800,047 -0.52% Average Days on Market 42 37 13.51% 42 37 13.51% List/Sold Price Ratio 98.3% 99.4% -1.09% 98.3% 99.4% -1.09%
Sold Properties| Number of properties sold during the year New Properties | Number of properties listed during the year.
MEDIAN SALES PRICE AND NUMBER OF SALES
January 2023 | All Property Types
Median Sales Price | Price of the ""middle"" property sold -an equal number of sales were above and below this price.
Number of Sales | Number of properties sold.
AVERAGE SALES PRICE AND AVERAGE DAYS ON MARKET
January 2023 | All Property Types
Average Sales Price| Average sales price for all properties sold. Average Days on Market | Average days on market for all properties sold.
PRICE
2023 | All Property Types Sale Price as a Percentage of Original Price| Average sale price of property as percentage of final list price. AVERAGE SALES PRICE AND NUMBER OF PROPERTIES FOR SALE
2023 | All Property Types Average Sales Price| Average sales price for all properties sold. Properties for Sale | Number of properties listed for sale at the end of month.
SALES
AS A PERCENTAGE OF ORIGINAL PRICE January
January
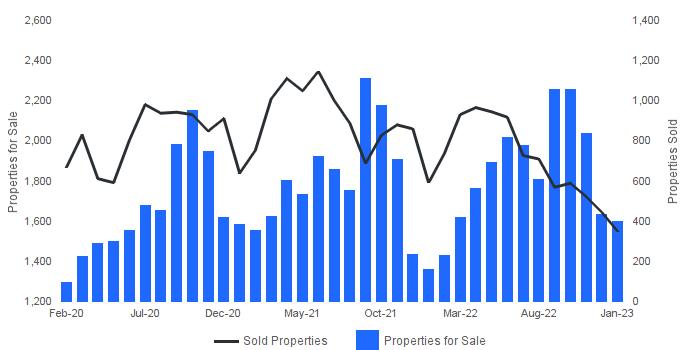
PROPERTIES FOR SALE AND SOLD PROPERTIES
January 2023 | All Property Types
Properties for Sale | Number of properties listed for sale at the end of month.
Sold Properties| Number of properties sold.
AVERAGE ASKING/SOLD/UNSOLD PRICE
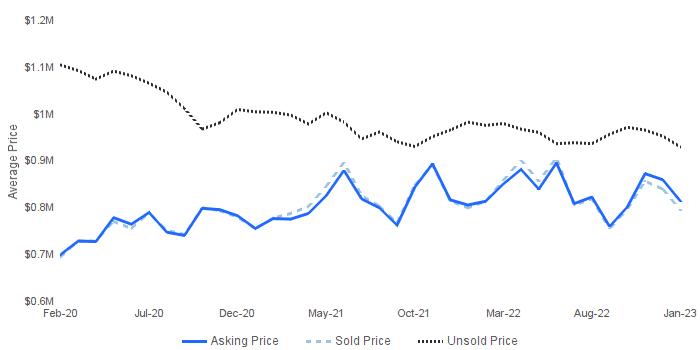
January 2023 | All Property Types
Unsold Price| the average active list price
Asking Price | the average asking price of sold properties
Sold Price | the average selling price
ABSORPTION RATE
January 2023 | All Property Types
Absorption Rate | Looks at the past year's monthly supply of inventory. In a normal market there should be a 6 month supply. The higher the rate above 6 the more aggressive a seller has to be with the competition; price and having a picture perfect property.
MONTHS SUPPLY OF INVENTORY
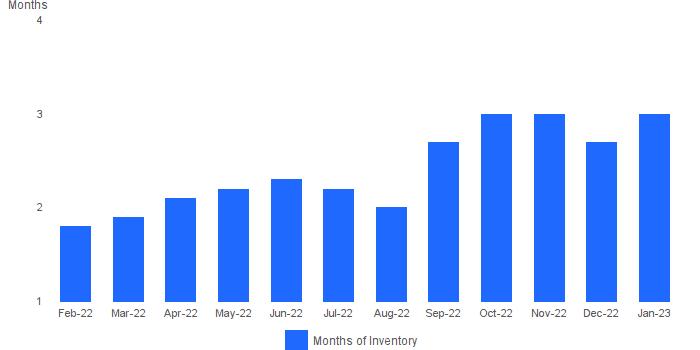
January 2023 | All Property Types
Months Supply of Inventory | Properties for sale divided by number of properties sold.
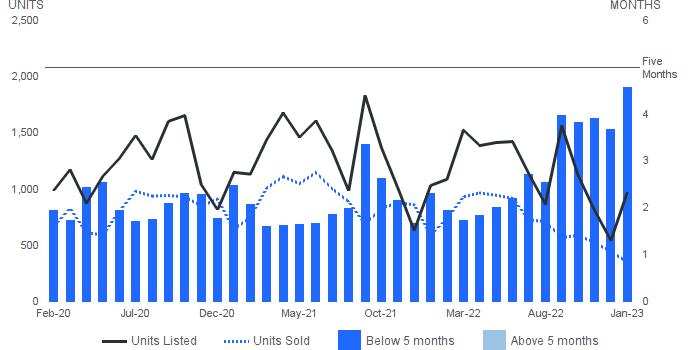
Units Listed | Number of properties listed for sale at the end of month.
Units Sold| Number of properties sold.
