
19 minute read
JOSE JULIO ESPINA


Summary:
José Julio Espina Agullo / ARTICLE
Advertisement
• European Handball Federation (EHF) Master Coach • Técnico Deportivo Superior en Balonmano Rfebm • Master en Dirección y Gestión Deportiva • Licenciado en Derecho • Doctor en Ciencias del Deporte por la Universidad de Alicante • Presidente de la Asociación de Entrenadores de Balonmano
The aim of this paper is to establish the pacerns of connecNon between goalkeeper staNsNcs (i.e. saves and goals) in European, World and Men's Olympic Championship finals with the results obtained by their teams in those finals. To what extent, ulNmately, is the performance of goalkeepers relevant to success/failure in those finals. The results will give us data applicable to high performance, as the matches analysed (32 in total), represent a sufficiently qualitaNve and quanNtaNve sample for those to have a very high absolute reliability.
Introduc-on:
The axiom that establishes the importance of the goalkeeper's game, and the relaNonship of his performance with the results of his team, is well known, not only in handball, but in any team sport in which this figure exists.
In the case of this sport, the performance of the goalkeeper and his impact on the game takes on special relevance, given the high number of intervenNons in each match. Insofar as I am analysing matches at the highest level, the results take on a special significance because European, World or Olympic Ntles are at stake. I am now going to detail, with staNsNcal data, the quanNficaNon of this importance, recognised by all. recognised by all. And even more so, if there is a direct relaNonship between the goalkeeper's success and his team's victory.
For this purpose, and having at our disposal the images of all the men's finals of the Olympic Games since 1984 (i.e. 8 matches), of the World Championships since 1982 (i.e. 14 matches) and of the European Championships since 1994 (i.e. 10 matches), it seems clear that we have a more than sufficient base of objecNve data to affirm, albeit with absolute modesty, that the conclusions obtained will have very solid foundaNons. It seemed important to me, therefore, to give numerical support to a reality that had already been studied in some leagues or championships, such as the study carried out by Pascual X. on the influence of goalkeeping efficiency on performance between the 2001-2002 and 20062007 seasons of the ASOBAL League.
This research showed that "the higher the efficiency of a team's goalkeepers, the better the team's ranking at the end of the season " and that "the efficiency of the goalkeepers of the best ranked teams in the ASOBAL League is higher than that of the rest of the teams in the competition" . It was also shown that "the better the efficiency of a goalkeeper and the better the shot, the greater the probability of winning versus losing or drawing" .
The objective richness of the sample of the present study allows us to provide sufficient data to establish very overwhelming conclusions since we have the images of all the finals of the Olympic Games since 1984 (n=8), of the World Championships since 1982 (n=14) and of all the European Championships from 1994 to 2013 (n=10).
All this, obviously, does not represent any added merit in itself, but it supports the results both for the long period analysed (31 years), and for the number of matches accumulated, 32. The level of these matches is, obviously, not worth commenting on, as they are simply the most important matches held in the world during this period in the field of men's handball.
The reasons that led me to undertake the present study are to be found in the concern to demonstrate empirically and statistically the enormous importance of the efficiency of the handball goalkeeper in the final result of his team in a given match, which is becoming increasingly important in handball today and everything seems to indicate that this will continue to be the case in the future (Spãte, 2005).
As a future option and objective, it is clear that the importance of goalkeeper performance does not always fit in with individualised attention, training and the search for specificity on the part of coaches. It is up to us to provide our goalkeepers with the means, time and attention (physical, technical and psychological).
It is a huge contradiction not to dedicate enough time to this specific position during the week's work, to then demand a performance that is going to have an impact (as the conclusions of this work determine) in a very relevant way on the final result of the matches.
It is clear that this dynamic has been improving over the years, so that we can affirm that more and more attention is being paid to goalkeepers, but we are still far from the desirable balance between what we train them and what we demand of them. Northern European countries (Denmark, Sweden and Norway) as well as South Korea are currently the pioneers in this new line of work, which should serve as a mirror for others.
Slowly but steadily today we can safely say that the whole world is aware of the enormous importance of goalkeeping in handball. I would almost go so far as to say that this has always been the case. The problem lies in adapting this reflection to the time, importance, means and dedication given to them during the different phases of the Periodisation of Training in each case and in each team.
OBJECTIVE
The aim of this study is to demonstrate and quanNfy as accurately as possible the special relevance of the goalkeeper's performance in Handball and its impact on the game, and therefore on the final result of the matches.
Obviously, like any study focused on a sporNng acNvity, it cannot offer mathemaNcally exact results, since due to the idiosyncrasy of the acNvity in quesNon (in this case handball), there will always be other elements (endogenous and exogenous to the athlete and/or the team) that will also have a certain relevance in the result/performance of the athlete/team.
MATERIAL AND METHODOLOGY
The study sample includes 32 men's handball finals divided into the first IO European Championship finals (from the 1994 to 2012 ediNons), 14 World Championship finals (from the 1982 to 2013 ediNons) and 8 Olympic finals (from the 1984 Los Angeles ediNons to London 2012).
Therefore, this study sample includes IO European Championship finals (out of the 12 played to date), 14 World Championship finals (out of a total of 23 played to date) and 8 Olympic finals (out of the l l l played to date).
The video material on which the analysis was carried out was obtained from television broadcasts on TV channels TV l, TV2, Teledeporte and Eurosport.
In order to proceed with the notaNonal analysis, the sofware SportCode Pro v. 8.5.2 was used. In total, 38h49min16 sec of video were analysed with the sofware SportCode Pro v.8.5.2, as well as 3810 acacking acNons in which the goalkeeper's saves were selected.
The visualisaNon and analysis of the video recordings was carried out by 2 experienced observers. For the reliability of the observaNon during the study, 2 inter-operator visualisaNons were carried out.
The reliability of the inter-observer analysis obtained a margin of error of less than 5%. The analysis of the matches focused on the handball goalkeeper, classifying the saves according to the acacking zone. To do this, observaNon variables were established for the notaNonal analysis of the acNons carried out to help us determine the influence of the goalkeeper in the development of the matches.
Four acacking zones were determined, i.e., shots from 6 metres (6M), 9 metres (9M), 7 metres (7M) and counter-acack (CA).
Taking into account the launching zones, a strict observation protocol is established (Table 1).
OPERACIÓN DEFINICIÓN
Tabla 1
Lanzamientos de 6 metros Lanzamientos realizados en la zona comprendida entre la línea de 6 metros y la de 9 metros, esto es, el área de golpe franco, En los lanzamientos donde el jugador se encuentra en el aire, se tomará como zona de lanzamiento el lugar desde el cual realizó la batida previa al vuelo.
Lanzamientos de 9 metros Lanzamientos realizados por detrás la línea de 9 metros delimitada en el campo de juego. En los lanzamientos donde el jugador se encuentra en el aire, se tomará como zona de lanzamiento el lugar desde el cual realizó la batida previa al vuelo.
Lanzamientos de 7 metros Se toma como lanzamiento de 7 metros todos aquellos que se realicen desde dicha distancia como resultado de un penalti pitado a favor del equipo atacante
Contraataque Lanzamientos realizados en situación de contraataque, aquella en que un atacante se sitúa solo delante del portero por haber aventajado en velocidad a los defensores durante el repliegue defensivo.
In addition to the throwing zones, established in the previous matrix, the players' throwing location was included. Determining whether the final action was performed from the centre (LC) or from the side (LL), regardless of the attacking zone. (Figure l),

Figura 1 Lugares de lanzamiento
From the establishment of the launch site, the description of the analysis matrix for the launch types can be carried out (Table 2).
Finally, the variables corresponding to the result of the throw-in were established, being goal (GOAL), non-goal (NGOL), as well as the participation of the goalkeeper in the result of the throw-in, carrying out a direct intervention (IDP) on the throw-in resulting in a save (FOR) or an indirect intervention (IIP) on the failure of the throw-in (OUT).
In the same way, an observation matrix was established for the analysis of the result of the throw-in as well as the goalkeeper's intervention (Table 3).
Therefore, in order to carry out the analysis of the matches, the following sequence was established: • Recording and digitisation of the images. • Creation of code matrices with the elements to be analysed for each analysis. • Coding of the images with each of the codes created. • Combination of the codes to obtain a quantification of the actions analysed.
Lateral
OPERACIÓN
Centro Matriz de Análisis lugares de lanzamientos
DEFINICIÓN
Tabla 2
Aquellos lanzamientos que se realizan por la zona curva de las áreas de 6 metros y 9 metros, Dicha zona se corresponde con la zona derecha e izquierda del campo. Aquellos lanzamientos que se realizan por la zona recta de las áreas de 6 metros y 9 metros (3m).
Gol
OPERACIÓN
No gol
Fuera Matriz de Análisis lugares de lanzamientos
DEFINICIÓN
Tabla 3
Aquellos lanzamientos en los que el portero no detiene el balón y este acaba entrando en la portería
Aquellos lanzamientos en los que por intervención directa (IDP) o indirecta (IIP) del portero el balón no entra dentro de la portería. Acciones en las que el portero intercepta la trayectoria del balón que va a la portería evitando que este se introduzca en la misma. Llevando a cabo por tanto, una intervención directa del portero (IDP). Acciones en las que el portero no lleva a cabo contacto alguno con el balón y aún así, este no entra dentro de la portería, por su trayectoria desviada. Por tanto, una intervención indirecta del portero (HP).
StaNsNcal analysis:
The data were analysed with the staNsNcal programme SPSS v. 19 to carry out descripNve staNsNcs. Similarly, in order to establish significance in the analysis of the goalkeeper's effecNveness, the CHI-Squared staNsNc was applied. Furthermore, in order to establish the significance between the saves by shooNng zones of the goalkeeper whose team wins the match and the one whose team loses the match, an ANOVA was applied.


RESULTS
Of the total number of matches analysed (n=32), we found that 81% of the matches in which the goalkeeper was more effecNve in the same match than his opponent, his team ended up winning, while 19% of the matches in which the goalkeeper was more effecNve in the same match than the opposing goalkeeper, his team ended up losing. (Figure 2),

Figura 2
As for the effectiveness of the goalkeepers whose teams ended up winning the match, we found an average number of saves of 46.97% ±5.77, with a minimum recorded effectiveness of 35.89% and a maximum of 60.87%. On the other hand, those goalkeepers who even though they made more saves than their opponents lost, had an average of 32.69%, with a minimum recorded efficiency of 32.69% and a maximum of 51.11%.
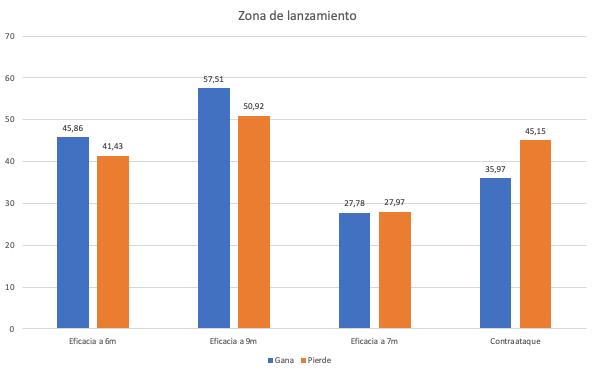
Of the zones of play established for the analysis, we found that the goalkeepers who won the match with a higher effectiveness in total saves in the 6-metre zone had an average effectiveness of 45.86%±8.39, where the lowest effectiveness was 30.77% and the maximum was 68.42%. In the 9metre shots, the effectiveness of the goalkeepers had an average of 57.51%±17.73, with the lowest effectiveness recorded being 0.0% and the maximum 93.33%. In the 7-metre actions, the average effectiveness was 27.78%±27.98, where there were matches in which the goalkeepers did not save any 7-metre shots, as well as matches in which the goalkeeper saved all of them. Something similar occurred in counter-attacking actions, in which the goalkeepers presented an average save effectiveness of 35.97%±23.96. In the case of the 7-metre throw, there were matches in which the goalkeepers did not save any of the balls, as well as the opposite, with all of them being saved. As for the effectiveness of the save in goalkeepers, who even having a higher effectiveness than the opposing goalkeeper lost the match, we found that in the 6-metre zone they presented an average effectiveness of 41.43%±9.32, where the lowest effectiveness was 33.33% and the maximum was 58.62%. In the 9-metre throws, the goalkeepers' effectiveness had an average of 42.86%, with the lowest effectiveness recorded and the maximum 57.14%. In counter-attacking actions, the average effectiveness of the goalkeepers was 45.15%±29.52%, with the lowest recorded effectiveness of 0.00% and the maximum of 83.33% (Figure 3).
Finally, analysing the effecNveness of the save depending on the verNcality of the throw, we found that the goalkeepers who presented a higher total effecNveness of saves than the opposing goalkeepers and ended up winning the match had an average effecNveness from 6 metres-centre of 70.47%±16.87, where the lowest effecNveness recorded was 42.86% and the highest was 100%. In the 6-metre-lateral throws, the average effecNveness was 63.33%±12.91, where the lowest effecNveness recorded was 35.29% and the highest was 90%. From 9-metre-centre, the average effecNveness was 58.45%±22.09 with a minimum of 25% and a maximum of 100%.
Finally, the average effecNveness for the 9-metre-lateral zone was 43.08%±28.49, with a minimum effecNveness of 0.00% and a maximum of 100%.
As for the effecNveness of the save depending on the verNcality of the throw, the goalkeepers who presented a higher total effecNveness of saves than the opposing goalkeepers and ended up losing the match, had an average effecNveness from 6-metre-centre of 71.66%±9.64 where the lowest effecNveness recorded was 60.00% and the highest 87.50%. In the 6-metre-lateral throw, the average effecNveness was 8.94, where the lowest effecNveness recorded was 22.22% and the highest was 76.47%. From 9 metres-centre, the average effecNveness was 49.30%±25.85 with a minimum of 16.67% and a maximum of 80.00%. Finally, the average effecNveness for the 9-metre-lateral zone was 56.94%±46.07, with a minimum effecNveness of 0.00% and a maximum of 100%. (Figure 4).

Figura 4 Zona de lanzamiento
In the present study, dedicated to high performance, the figure of 81% (p<.05) of the occasions, in which the greater performance in goal of the team that ends up winning the match shows the extraordinary direct relaNonship between both data. The same occurs in the research by Pascual X. et al. (2010) with the ASOBAL League (between 2001/2002 and 2006/2007).
Both Magalhaes (1999) and Silva (2000) demonstrated the influence of goalkeeper efficiency on the final classificaNon of the aforemenNoned compeNNons. On the other hand, both Volossovicthet al. (2002) and Pascual X. et al. (2010), demonstrated not only the correlaNon between goalkeeper efficiency and final classificaNon but also the correlaNon between goalkeeper efficiency and the final result of the matches, as in the present study.
CONCLUSIONS
The first relevant fact that almost sums up the content of this study is the fact that in 81% of the cases, the final result of the match (in this case the victory) coincided with the best performance (in the form of save/goal percentages) of the goalkeepers of the team that won the match. In contrast, in 19% of the cases where a team's goalkeepers performed becer but were defeated by their opponents, their save/goal percentages were worse. In other words, eight Nmes out of ten, the team whose goalkeepers perform becer wins.
The almost conNnuous presence of the teams from Russia (on some occasions and at that Nme also known as the Soviet Union or CIS, because it coincided chronologically with the process of its disintegraNon and the emergence of new states) and Sweden in the finals of the European and World Championships and Olympic Games during the nineNes, allows us to provide a fact to highlight. Indeed, in both teams _ and during the period of Nme indicated, the goalkeepers were the same, Tomas Svensson and Mats Olsson for Sweden and Andrey Lavrov and Pavel Sukosian for Russia. Of the seven Nmes the two teams met in a final, only once did the best goalkeeping performance not coincide with the final result of the match. On all the other occasions, both parameters coincided. Therefore, we conclude that even among the same individuals, depending on the performance on different days, the final result is equally different.
As for the efficiency zones, the data obtained are very logical, with the most efficient zone for goalkeepers being the one where shots are taken from 9m (free-kick line) and the least efficient for shots from 7m (penalty kick). At an intermediate point are the 6m and counteracack kicks, although with very qualified scores for goalkeepers, taking into account that in both cases the shot is taken with almost no defensive opposiNon.
The data collected in terms of the verNcality of the throw-in are also logical. Thus, the goalkeeper is more effecNve in the lateral areas, and less effecNve in the central areas of the goal. In this sense, we must bear in mind that the goalkeeper is located on the bisector of the angle formed with the vertex on the thrower's ball and the sides on the imaginary lines from the ball to the goalposts. Therefore, the more centred the throw is, the greater the angle and the less chance there is of stopping it.
BIBLIOGRAPHY
-Anguera, M.T, (1991). Melodologia observacional en la invesNgaciön psicolögica, Vol. I . Barcelona. Promociones y Publicaciones Universitarias. -Antünez, A. (2003). La interceptaciön en las porteras de Balonmano: qfectos de un programa de entrenamiento percepNvo-motriz. Tesis Doctoral. Universidad de Murcia. -Arraya, M. et al (2012). Andebol. Un caminhopara o alto rendimento. Lisboa. Ed. M. Arraya. -Arslanagic, A. (1979). Na rukometnom golu. Banja Luka (Bosnia-Herzegovina). Ed.Nigro Glas. -Barata, J. (1992).Changes in ball velocity in the handball free throw, induced by two different speedstrenght training programs. Lisboa. Ed. Motricidade Humana. -Bayer, C (1983). Hand-ball. LaformaNon dujoeur. Paris. Ed Vigot. -Bayios, I.A. et al. (2001). RelaNonship betwen isokineNc strength ofhe internal and external shoulder rotators and ball velocity in team handball. Londres. Journal of Spons Medicine & Phisical Fitnes, 41 (2), pp. 229-235. -Blasco, J. y Pérez, J.A, (2007). Metodologias de invesNgaciÖn en ciencias de la acNvidadfisica y el deporte. Alicante. Universidad de Alicante.ECU, -Brégula, T. (1996). Pilka Reczna,Lata Doswiadczen. Varsovia (Polonia). Biblioteca Treversa. -Eliazs, J., Janik, J. & Wit, A. (1990).Ball flight velocity during throws in handball. Magazine Sport Wyczynowy. n
o
28, pp. 12-34. Varsovia (Polonia). -Falkowski, M.M. y Enriquez. E. (1979). Estudio monogråfico del portero. Madrid. Ed. Esteban Sanz. -Garay, O. y Hernåndez, A. (2002). Observaciön, ensefianza y deportes. Barcelona. Ed. INDE. -Garcia Herrero, LA.. et al (2003). Anålisis del comportamiento visual de los porteros de balonmano ante lanzamientos realizados desde 6 a 9 metros de la porteria. Revista Apunts. n
o 74, pp. 40-45.
Barcelona. INEF Universidad de Barcelona. -GorosNaga, E.M. et al. (2005). Differences in physical fitness and throwing velocity among elite and amateur male handball players. InternaNonal Journal of Spon Medicine. 26(3). 25-32, Londres (Reino Unido), -GuNérrez, M. (2010). Anålisis de los movimientos de anNcipaciön en porteros expertos y no expertos en Balonmano. Mérida (Venezuela). I Congreso Iberoamericano de biomecånica aplicada al deporte. -GuNérrez, O. (2012). Proceso para la mejora de la toma de decisiön en el poriero de Balonmano. Maia (Portugal). Ill Congreso Internacional Handball Project. -Hecker, S. y Thiel, A. (1993). Handball: Le Gardien de But. Paris. Ed. Vigot. -López, P. (2005). Efectos de la oposición sobre los factores biomecánicos del lanzamiento en salto en balonmano. Jaén. Universidad de Jaén. -Magalhaes F. (1999). Relaçao entre indicadores de eficacia e a classificaçao final de equipas de andebol. Dessertaçao de Maestrado. Porto. FCDEF-UP. -Pascual, X. (2004). El lanzamiento de primera línea: Claves para el portero. Revista Area de Balonmano, no 31. Comunicación Técnica no 233. pp, 1-15. Madrid. Asociación de Entrenadores de
Balonmano, -Pascual, X. (2006). El entrenamiento del portero: Una propuesta metodológica basada en el Nempo, Revista Area de Balonmano, no 38. Comunicación Técnica no 252, pp. l-
15. Madrid. Asociación de Entrenadores de Balonmano.
-Pascual, X, (2007). El entrenamiento de/ portero de balonmano: propuesta práctica sobre el desarrollo de la metodología basada en el tiempo. Comunicación Técnica n
o
RFEBM. 250. pp. 8-16. Madrid.
Pascual X, Lago C, CasáisL. (2010). La influencia del rendimiento del portero en el resultado de los equipos de balonmano de alto nivel. Apunts; 99: pp 72-81 -Ramos, J. L. , Hernández, J.A. y Parrilla, F, J, (2010). Selección y entrenamiento inicial del portero de balonmano. Vol. I y II. Revista Área de Balonmano. N
O 54 y 55. Madrid. Asociación de Entrenadores de
Balonmano, -Ribeiro, M. (2002). O Guarda-redes. Revista Andebol Top. N
O
Lusofona, I I . pp. 25-32. Lisboa. Universidad
-Román, J de D. (2005).Los inicios del siglo XXI. Evolución y tendencias del juego. Zaragoza. VII Seminario Internacional Asociación de Entrenadores de Balonmano. -Silva J. (2000).0 Sucesso no Andebol. Correlaçao entre indicadores de rendimiento com a classificaçaofinal. _ Andebol Top. 1 .pp 3-9. -Spãte, D. (2005). Analyse Tunisia 2005. Basilea (Suiza). World Handball Magazine. no -Thomas, J. y Nelson, J. (2007). Métodos de la investigación en la actividad fisica. 1/2005.
Barcelona. Ed. Paidotribo. -Tones, G. (1998). El conocimiento didáctico del contenido de la enseñanza de la técnica deportiva en balonmano: El lanzamiento en salto con caída desde el extremo. La perspectiva de los expertos, entrenadores y jugadores. Tesis Doctoral. La Coruña. Universidad de la Coruña. -Torres, G. et al. (2004). Evaluación y seguimiento en la formación de jóvenes jugadores de balonmano. XIV Clinic AAM. Lisboa. -Vila, H. et al. (2009). Relación entre parámetros antropométricos y la velocidad de lanzamiento en jugadores de waterpolo. Londres. Journal of Human Sport and Exercise. 4 (I). pp. 62-74. -Volossovitch A, et al. (2002).A influencia da prestaçao de guarda-redes no rendimento da equipa. Andebol Top. I I .pp 12-16. -William, A.M., Davids, K. y William, J.G. (1999). Visual perception and action in sports. Londres. E y FN Sport. -Zeier, U. (1986). Doze noçoes básicas para o treino do guarda-redes. Revista 7 Metros. no 28. Lisboa. Ed. 7 Metros. 20. pp. 23-


