NINTENDO
HARDI SHAH
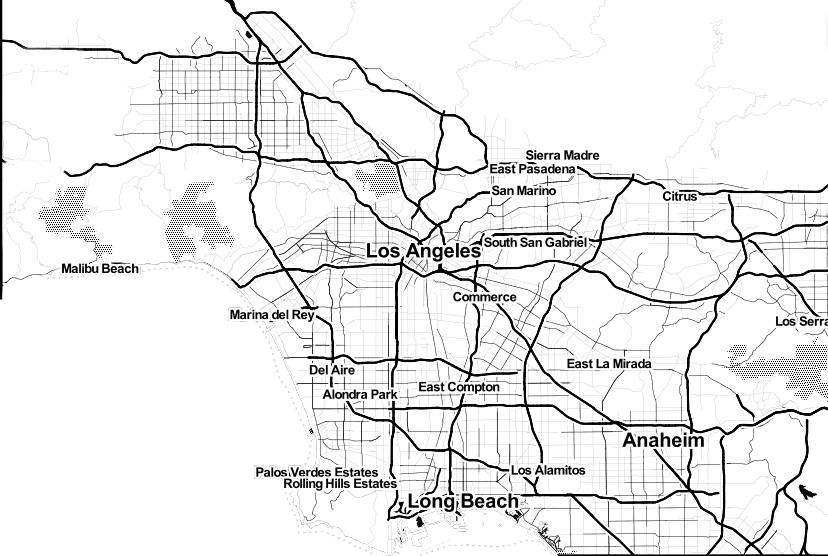
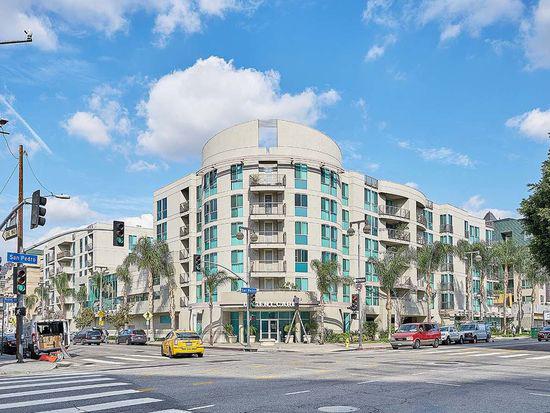
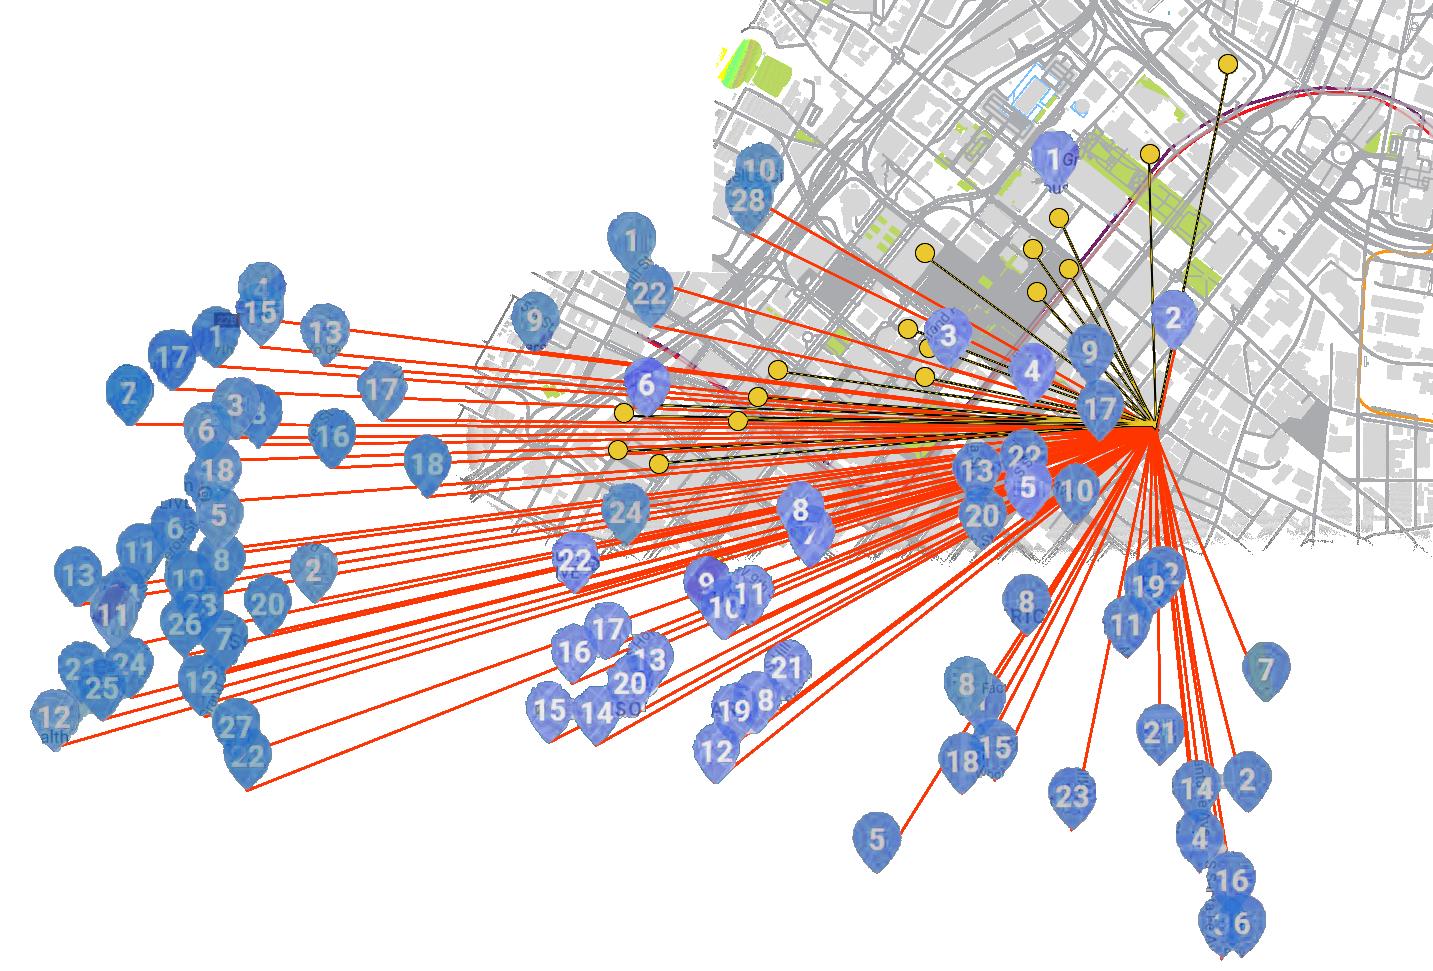
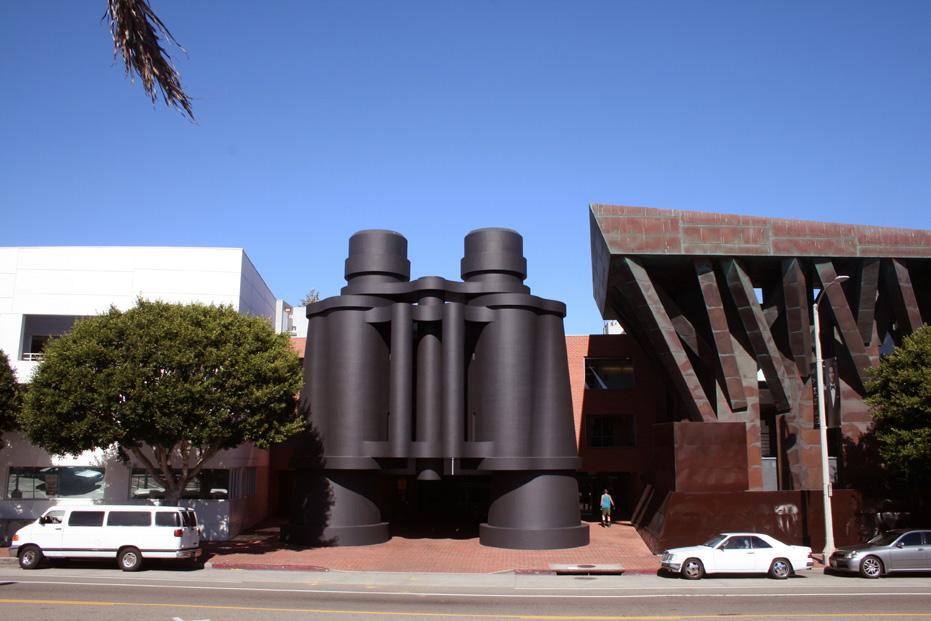
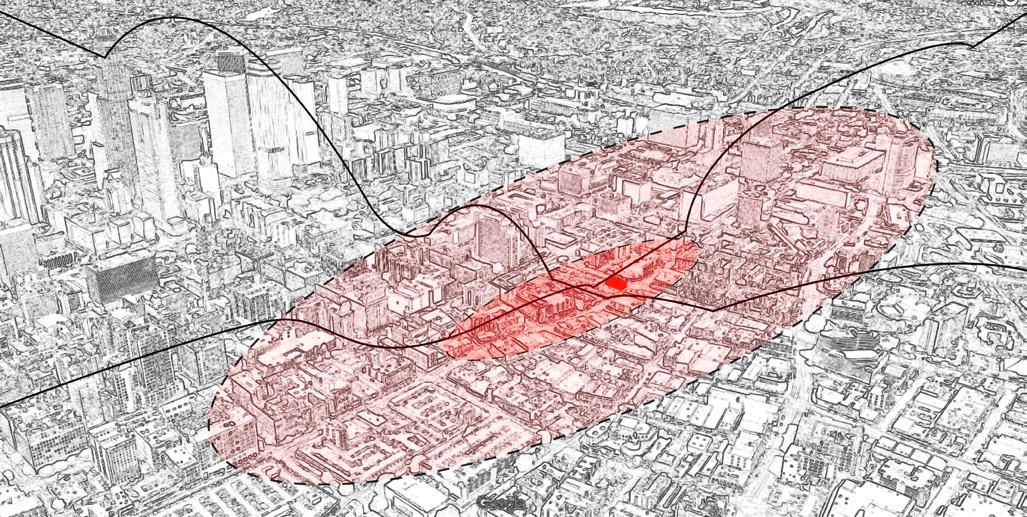
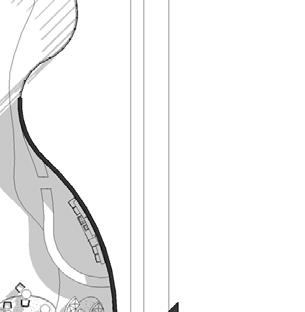
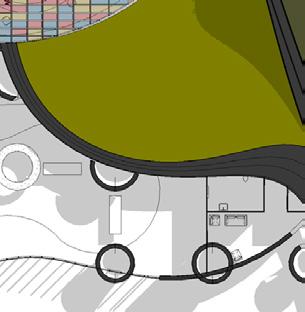
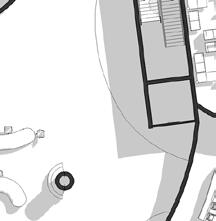
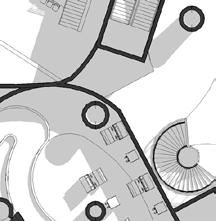
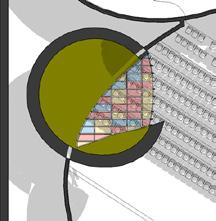
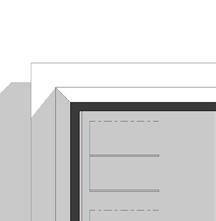
HARDI SHAH Los Angeles|Toy District & Downtown REGION| Location Los Angeles County, California Downtown LA, Los Angeles County 301-305 S Los Angeles St, Los Angeles, CA 90013
Grand Park
Walt Disney Concert Hall
The Broad Museum
Museum of Contemporary Art
Los Angeles City Hall
Union Station Commuter Rail
Volunteer Punk Band Venue
Japanese American National Museum
Japanese Village Plaza/Mall
Community Youth Association
Los Angeles Mission
Angel City Brewery
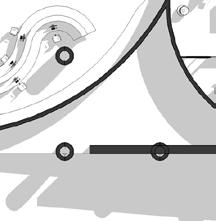
Parking Lots within 2 blocks in each direction Nearby Transit Areas
REGION|Points of Interest
Local businesses, Government buildings, etc
Parking Lots within 2 blocks in each direction Nearby Transit Areas
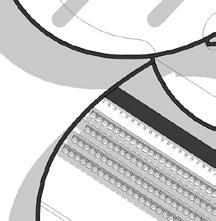
Larger social and administrative buildings are within a 15 minute walk from 301-305 S Los Angeles St Los Angeles, CA 90013. The Union Station Commuter Rail is a 30 minute walk but still accessible. Parks and green spaces are also a 15 minute walk away but parking lots are abundantly placed.
Art Walk DTLA
HARDI SHAH
Transit/Subway
Pershing Square Station (Purple, Red Lines)
Little Tokyo-Arts District Transit Stop (Gold Line)
Civic Center/Grand Park Transit Stop (Purple, Red Lines)
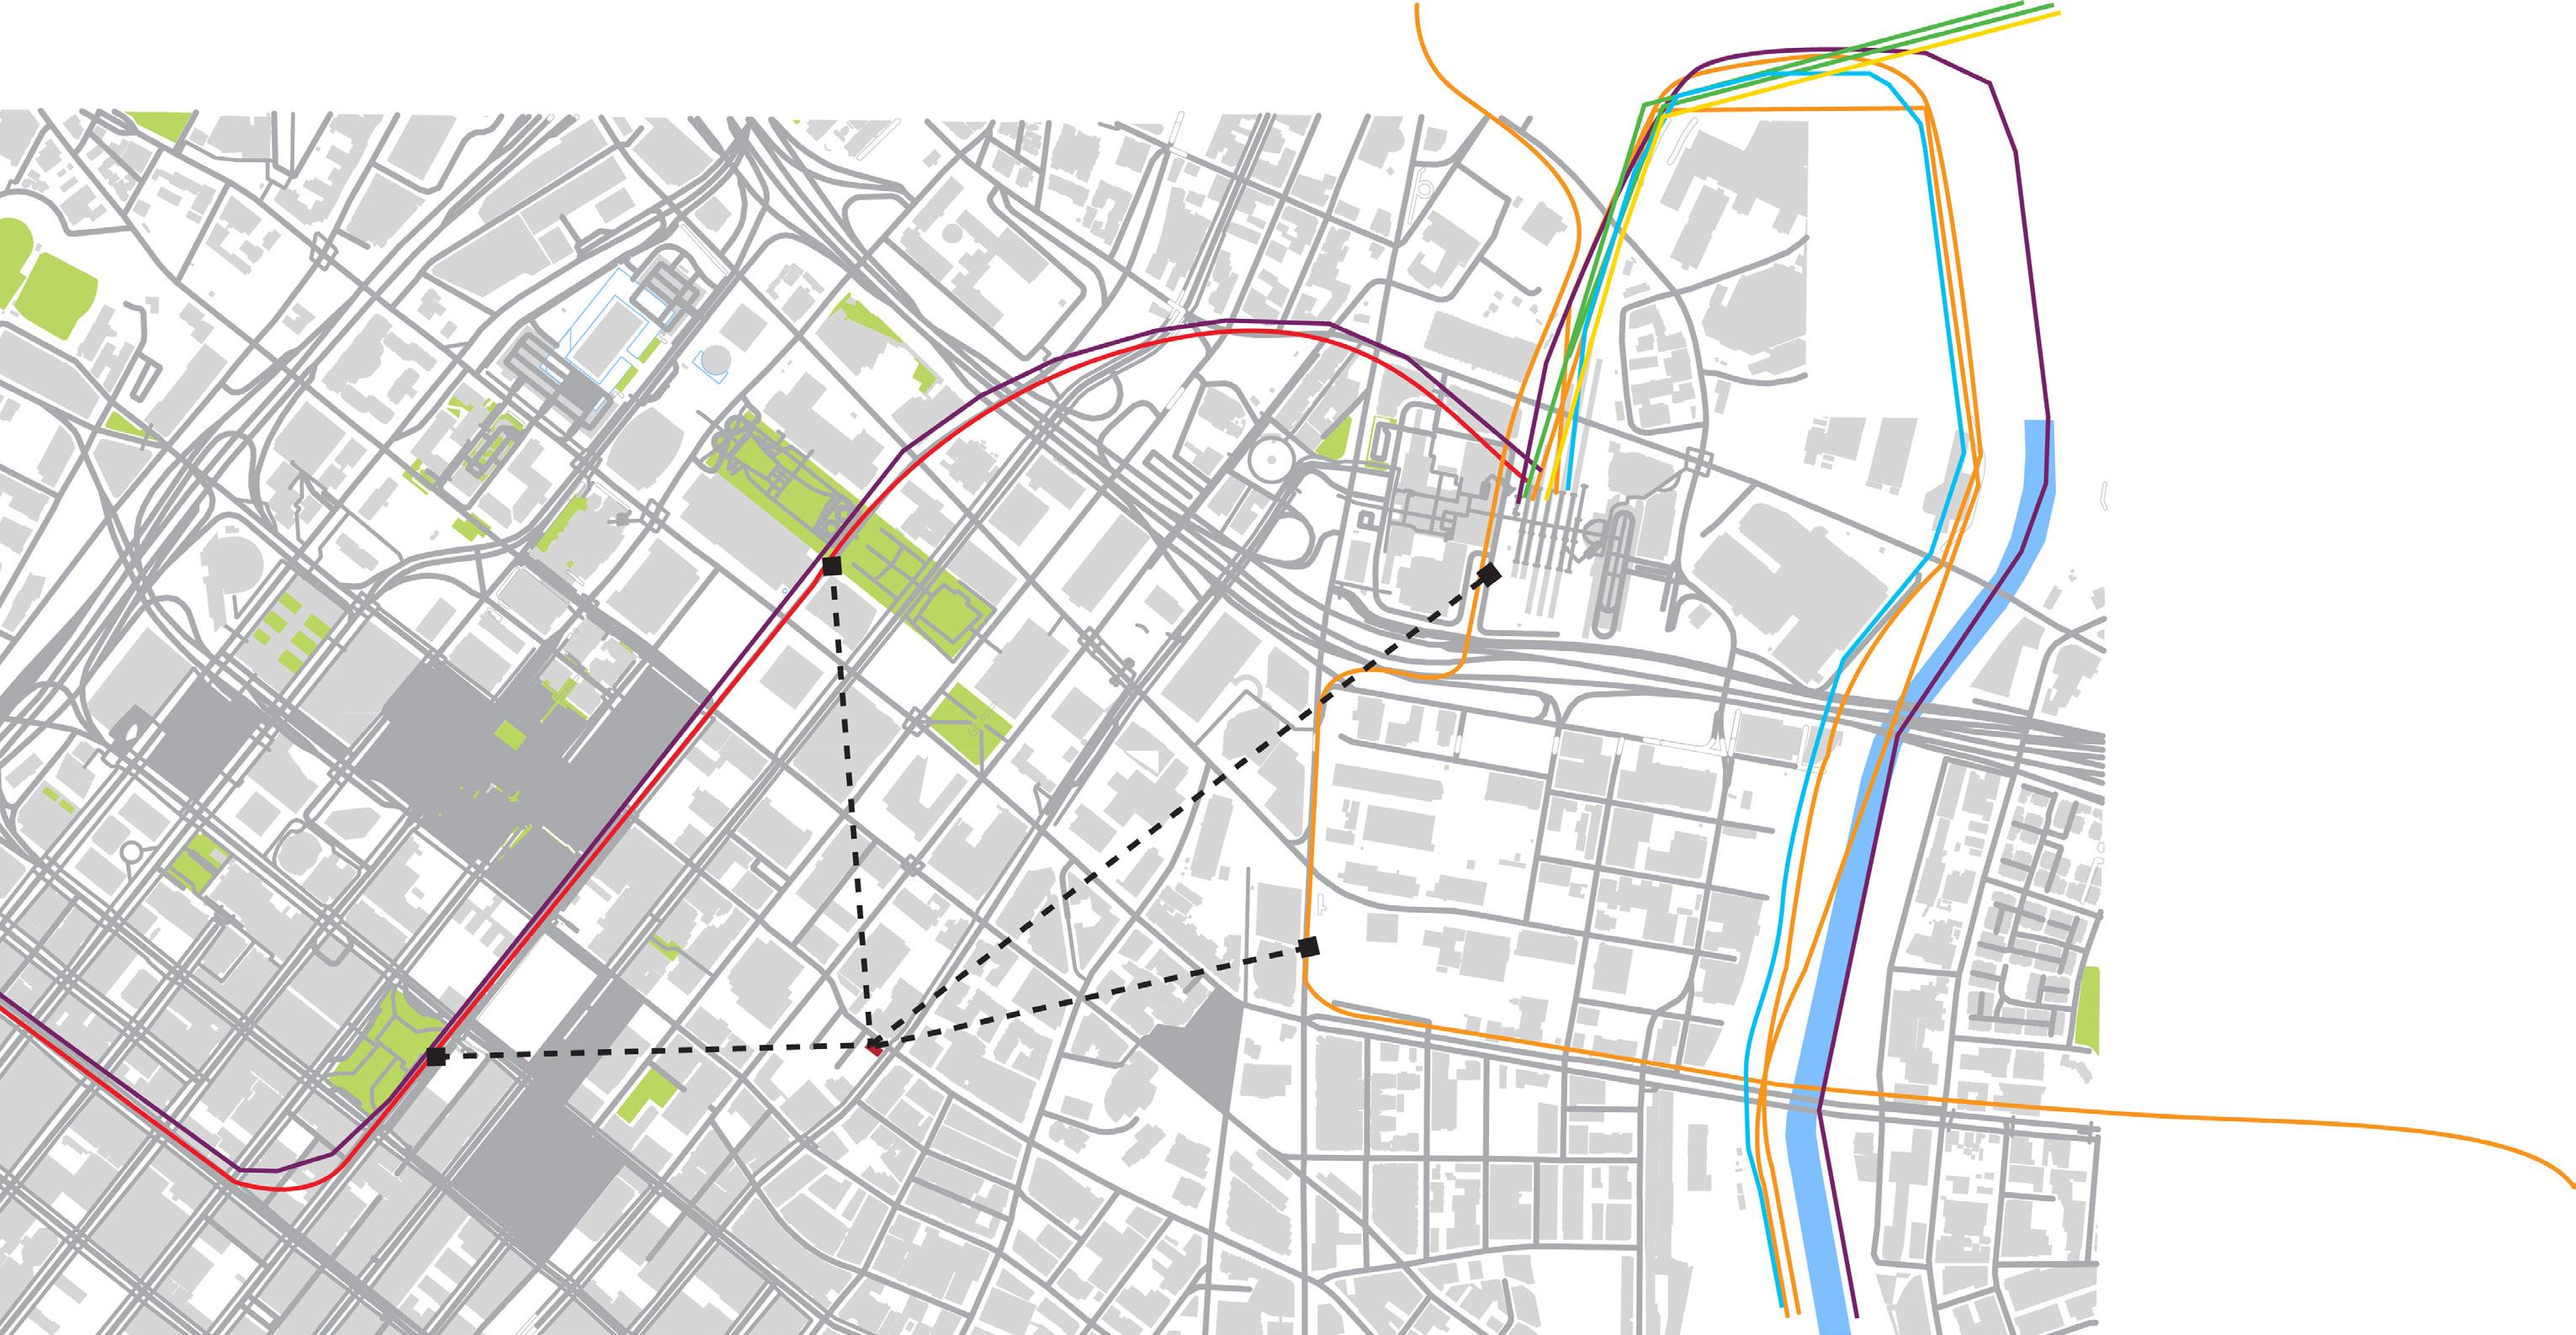
Union Station (Gold, Purple, Red Lines)
REGION| Relation to Transit
HARDI SHAH
Drive 2 min 3 min 2 min 5 min Walk 9 min 11 min 12 min 19 min Distance .5 miles .6 miles .7 miles 1 miles
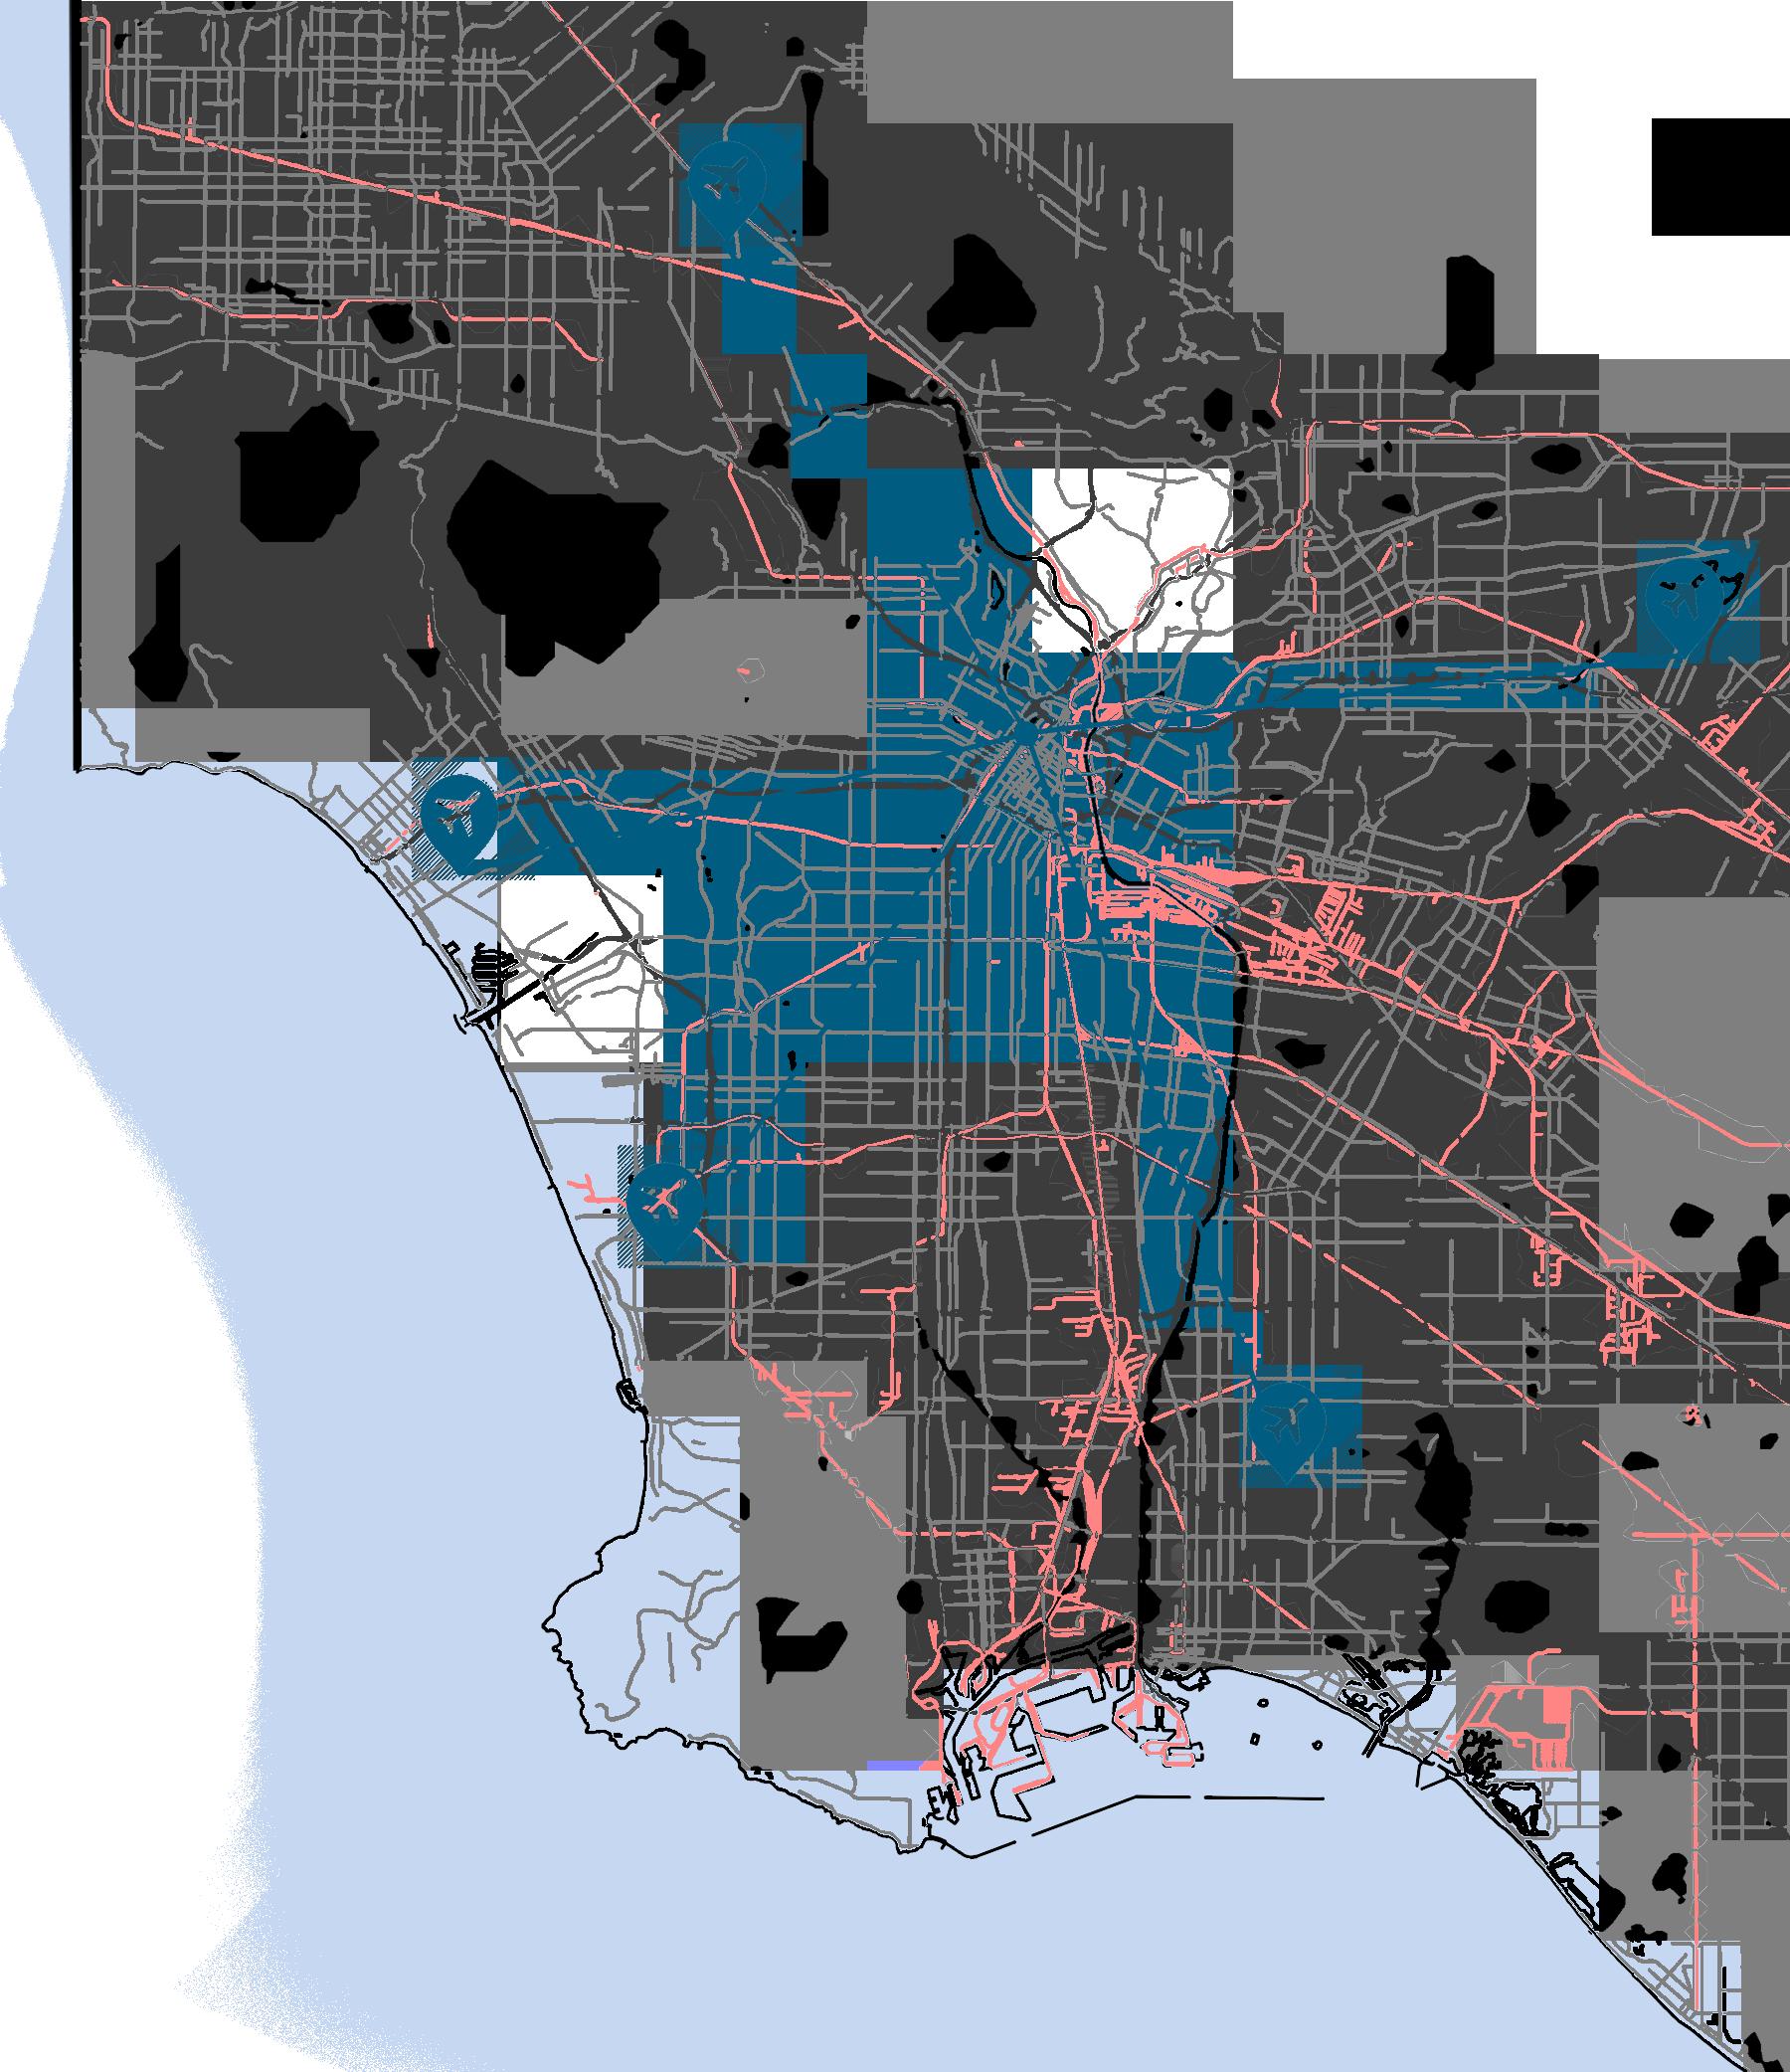
Airport Los Angeles Int’l Airport 23 min, 18.9 miles 28 min, 24.1 miles 23 min, 17 miles
Beach
Field Airport Brackett Field Airport Public Metro, Airports
Bob Hope Airport Santa Monica
Long
Daugherty
The sky glow of Los Angeles is visible from an airplane 200 miles away. When a 1994 earthquake knocked out the city’s power, many anxious residents called local emergency centers to report a strange “giant, silvery cloud” in the dark sky. What they were seeing – for the first time – was the Milky Way, long obscured by light pollution.
Artificial light at night disrupts the seasonal cycle of trees.
Artificial light at night can throw off a plant’s response to the change of seasons. Prolonged exposure to artificial light prevents many trees from adjusting to seasonal variations.
Light Pollution unnecessarily contributes to climate change
In an average year in the U.S., outdoor lighting uses some 120 terawatt-hours of energy, mostly to illuminate streets and parking lots. That’s enough energy to meet New York City’s total electricity needs for 2 years. Unfortunately, up to 50 percent of that light is wasted. That adds up to $3.3 billion and the release of 21 million tons of CO2 per year! To offset all that CO2, we’d have to plant 875 million trees annually.
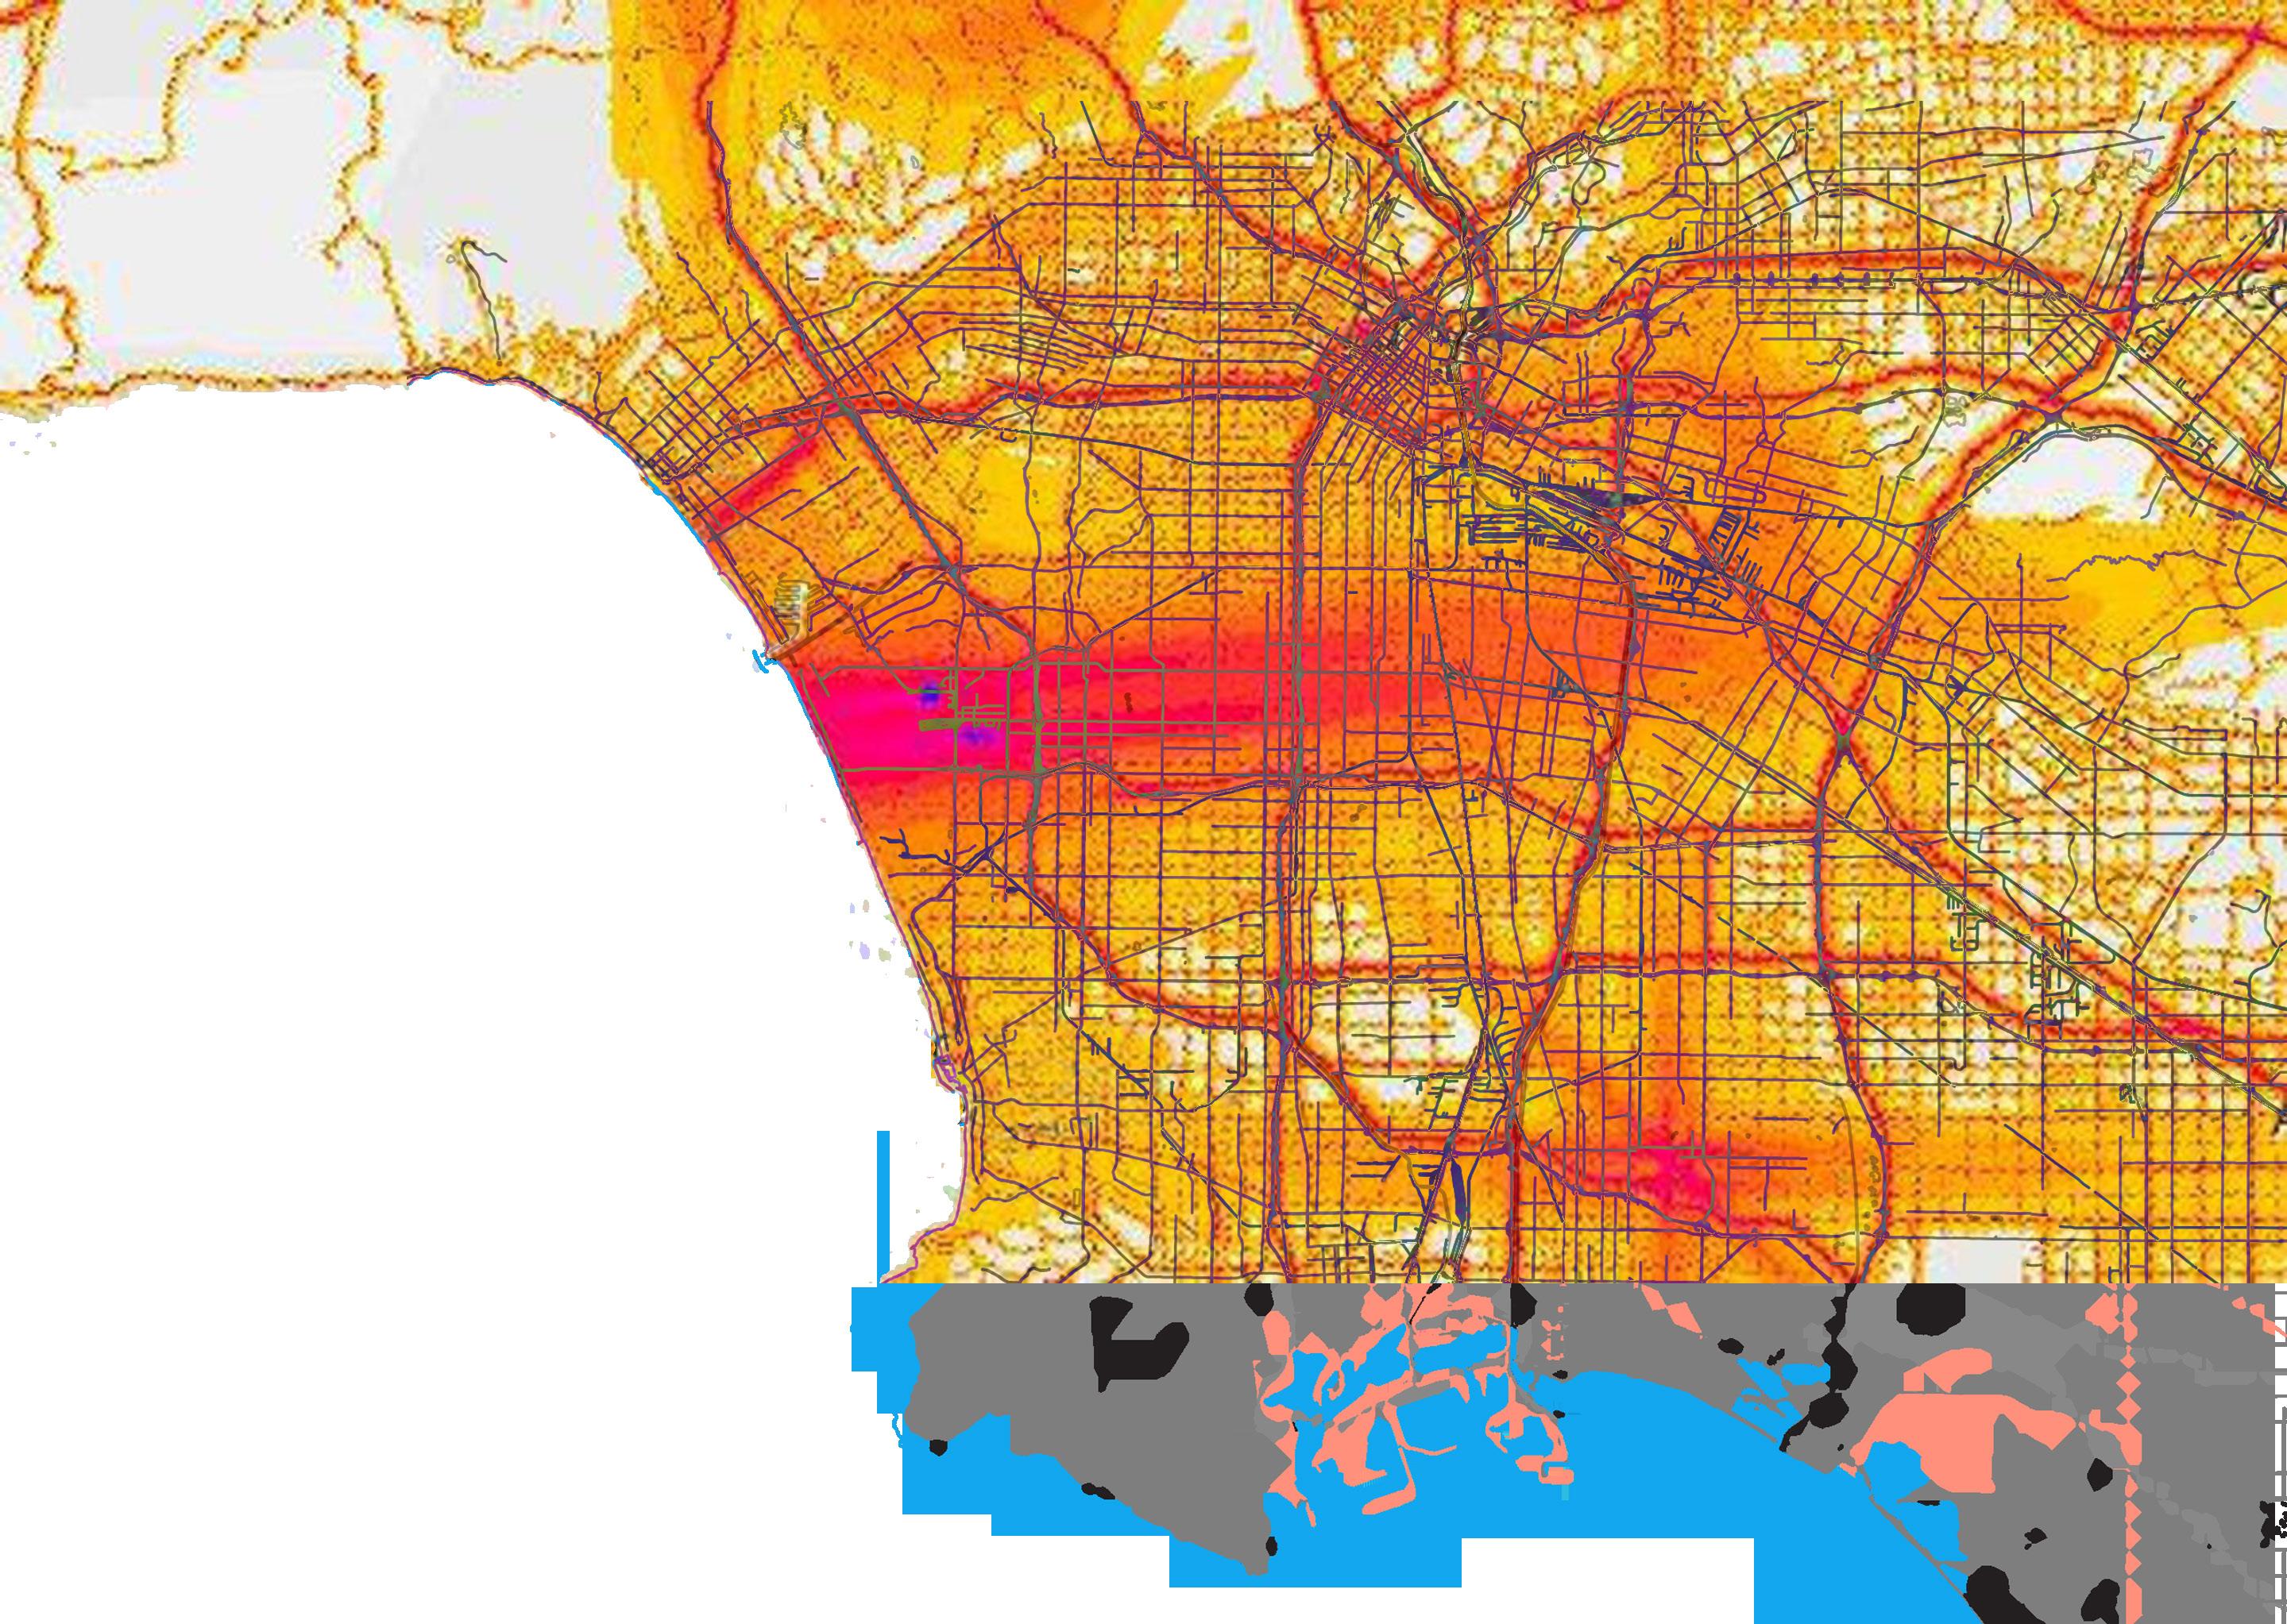
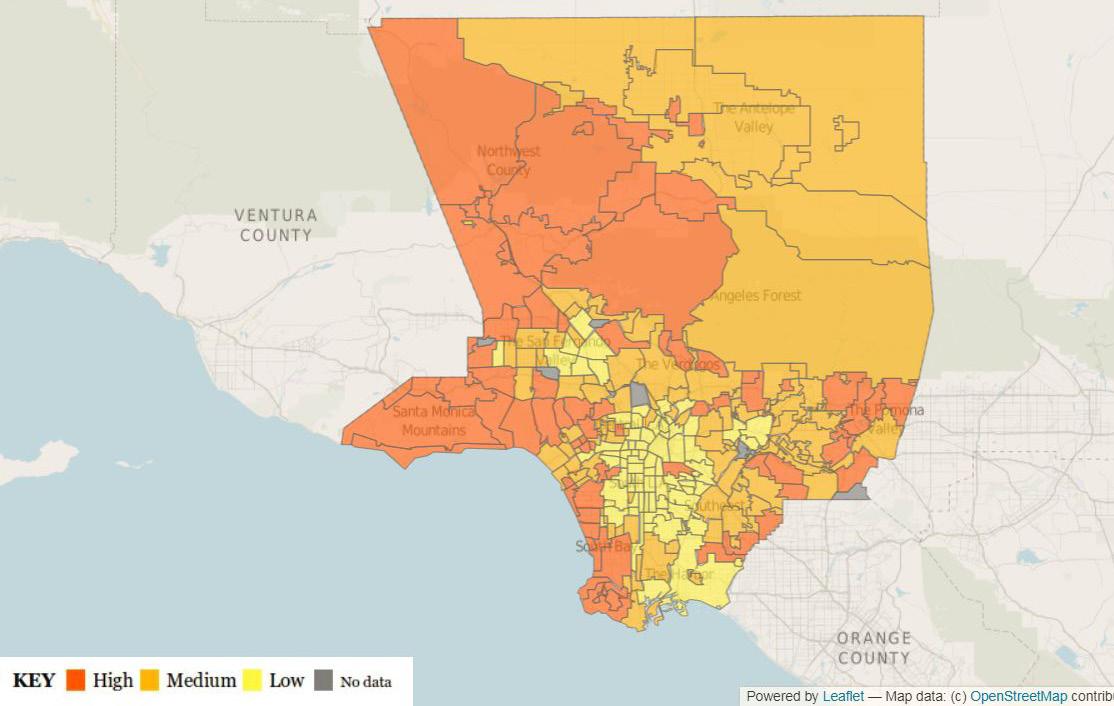
REGION|Noise & Light Pollution
Some of the noisier parts of California can be found around airports and freeways. Anyone who lives near an airport can tell you it’s loud. According to the map, the landing and takeoff zones around Los Angeles International Airport are particularly bad. Similar noise spikes are evident near airports in San Francisco, Oakland, San Diego, San Jose and Long Beach.
HARDI SHAH
Light Pollution Noise Pollution
Density and Comparison
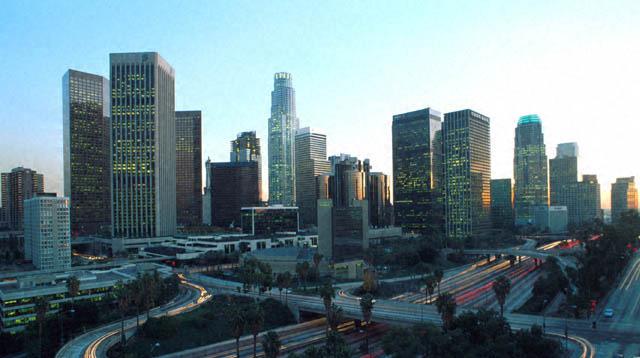
Downtown LA | Location of Site
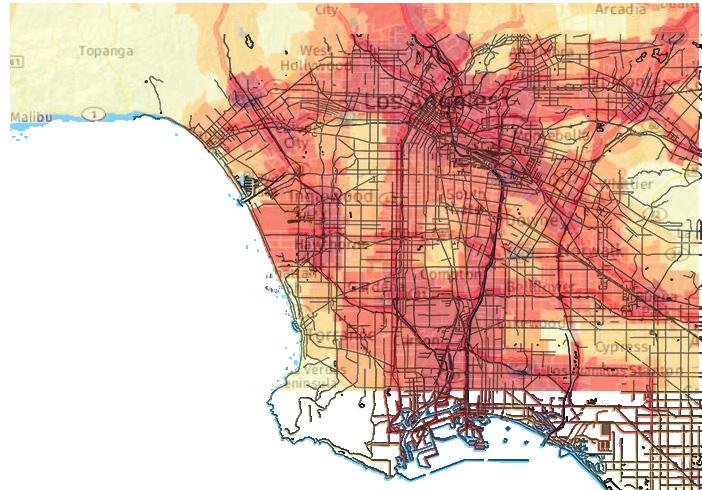
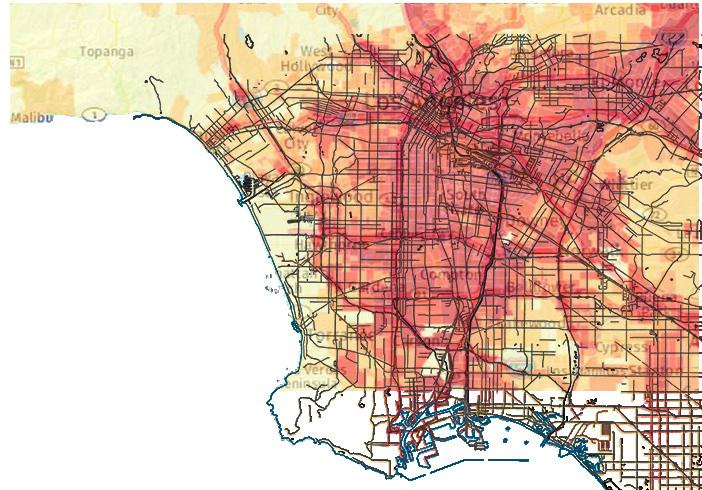
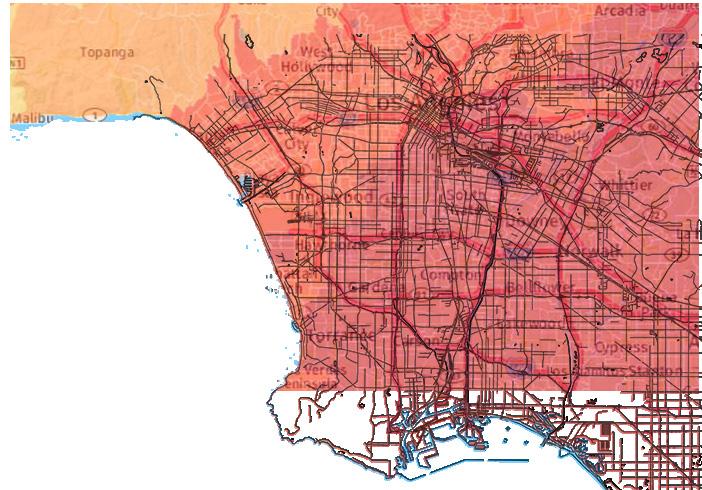
Southern California leads the nation in air pollution deaths
60%
Los Angeles still has the highest ozone concentrations of any major American metropolis. This is a result of its mountainous terrain, which trap air pollution in the Los Angeles basin. This topography contributes to the creation of smog.
Six of the USA’s 10 cities with the worst air pollution are in the Golden State including:
Bakersfield Los Angeles Fresno
California Cities other US cities
California Cities
Los Angeles-Long Beach, CA ranks first in the US cities for ozone pollution.
Ozone forms when volatile organic compounds, such as gasoline fumes, react with nitrogen oxides from diesel trucks and other machines with internal combustion engines.
Smog Days: days where pollutants in the air were above federal regulation standards
In 2014, Los Angeles had 94 smog days
factories power plants vehicles
Particulates like diesel dust, sulfur dioxide, and nitrogen dioxide can inflame the respiratory system, which can lead to permanently damaged lungs.
Smog-related aliments led to 30,000 emergency room visits in California
As many as 9,600 people die every year from complications of respiratory ailments, most of it due to prolonged exposure to smog.
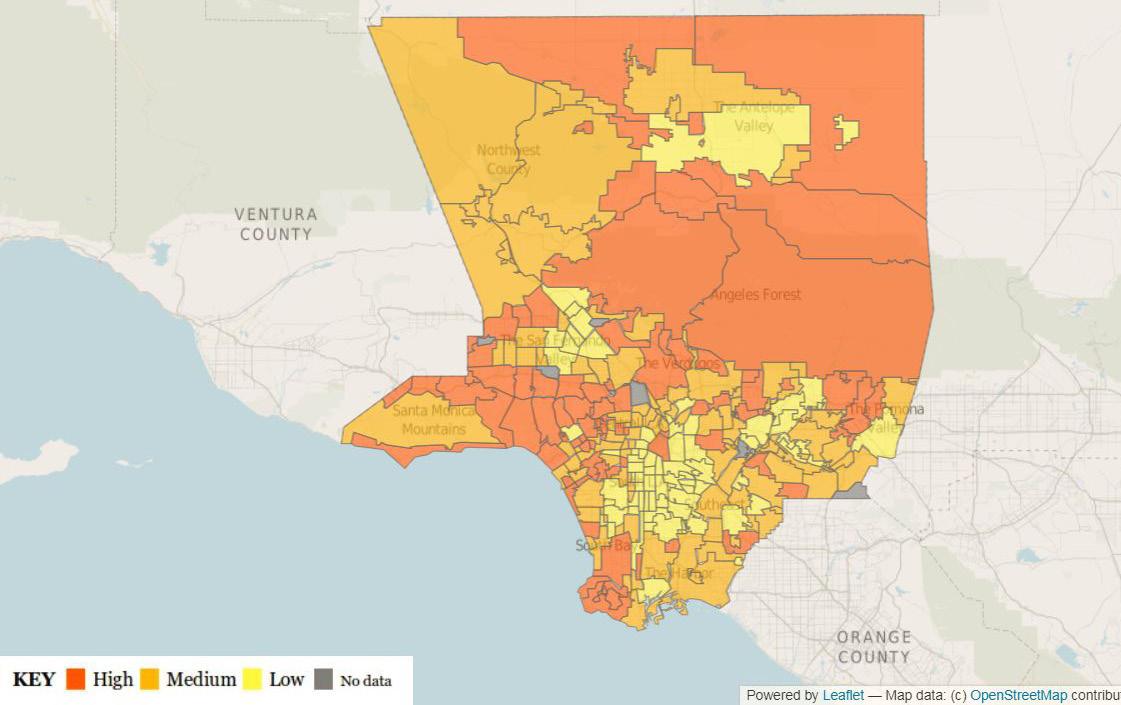
Air QUality
Fine Particulate Matter PM2.5 an air pollutant that is a concern for people’s health when levels are high. PM2.5 are tiny particles in the air which reduce visibility and cause the air to appear hazy when levels are elevated.
Based on:
1. Annual releases of pollutants or waste that are emitted or transferred into the atmosphere
2. use, type, and storage of hazardous materials
3. proximity to populations, hydrological sensitivity of the facility site, and where wastewater is discharged
The air quality is worst in and around fires burning but the smoke travels to places not threatened by the flames. As the Santa Ana winds die down the smoke lingers in the city causing more pollutants to settle. The most polluted areas are also in lowincome regions where immigrants live.
HARDI SHAH
Toxic releases into Air Deisel Particulate Matter Environmental Impact Index less 1 1 more 100 100
SMOG Toxic Releases into Air REGION|
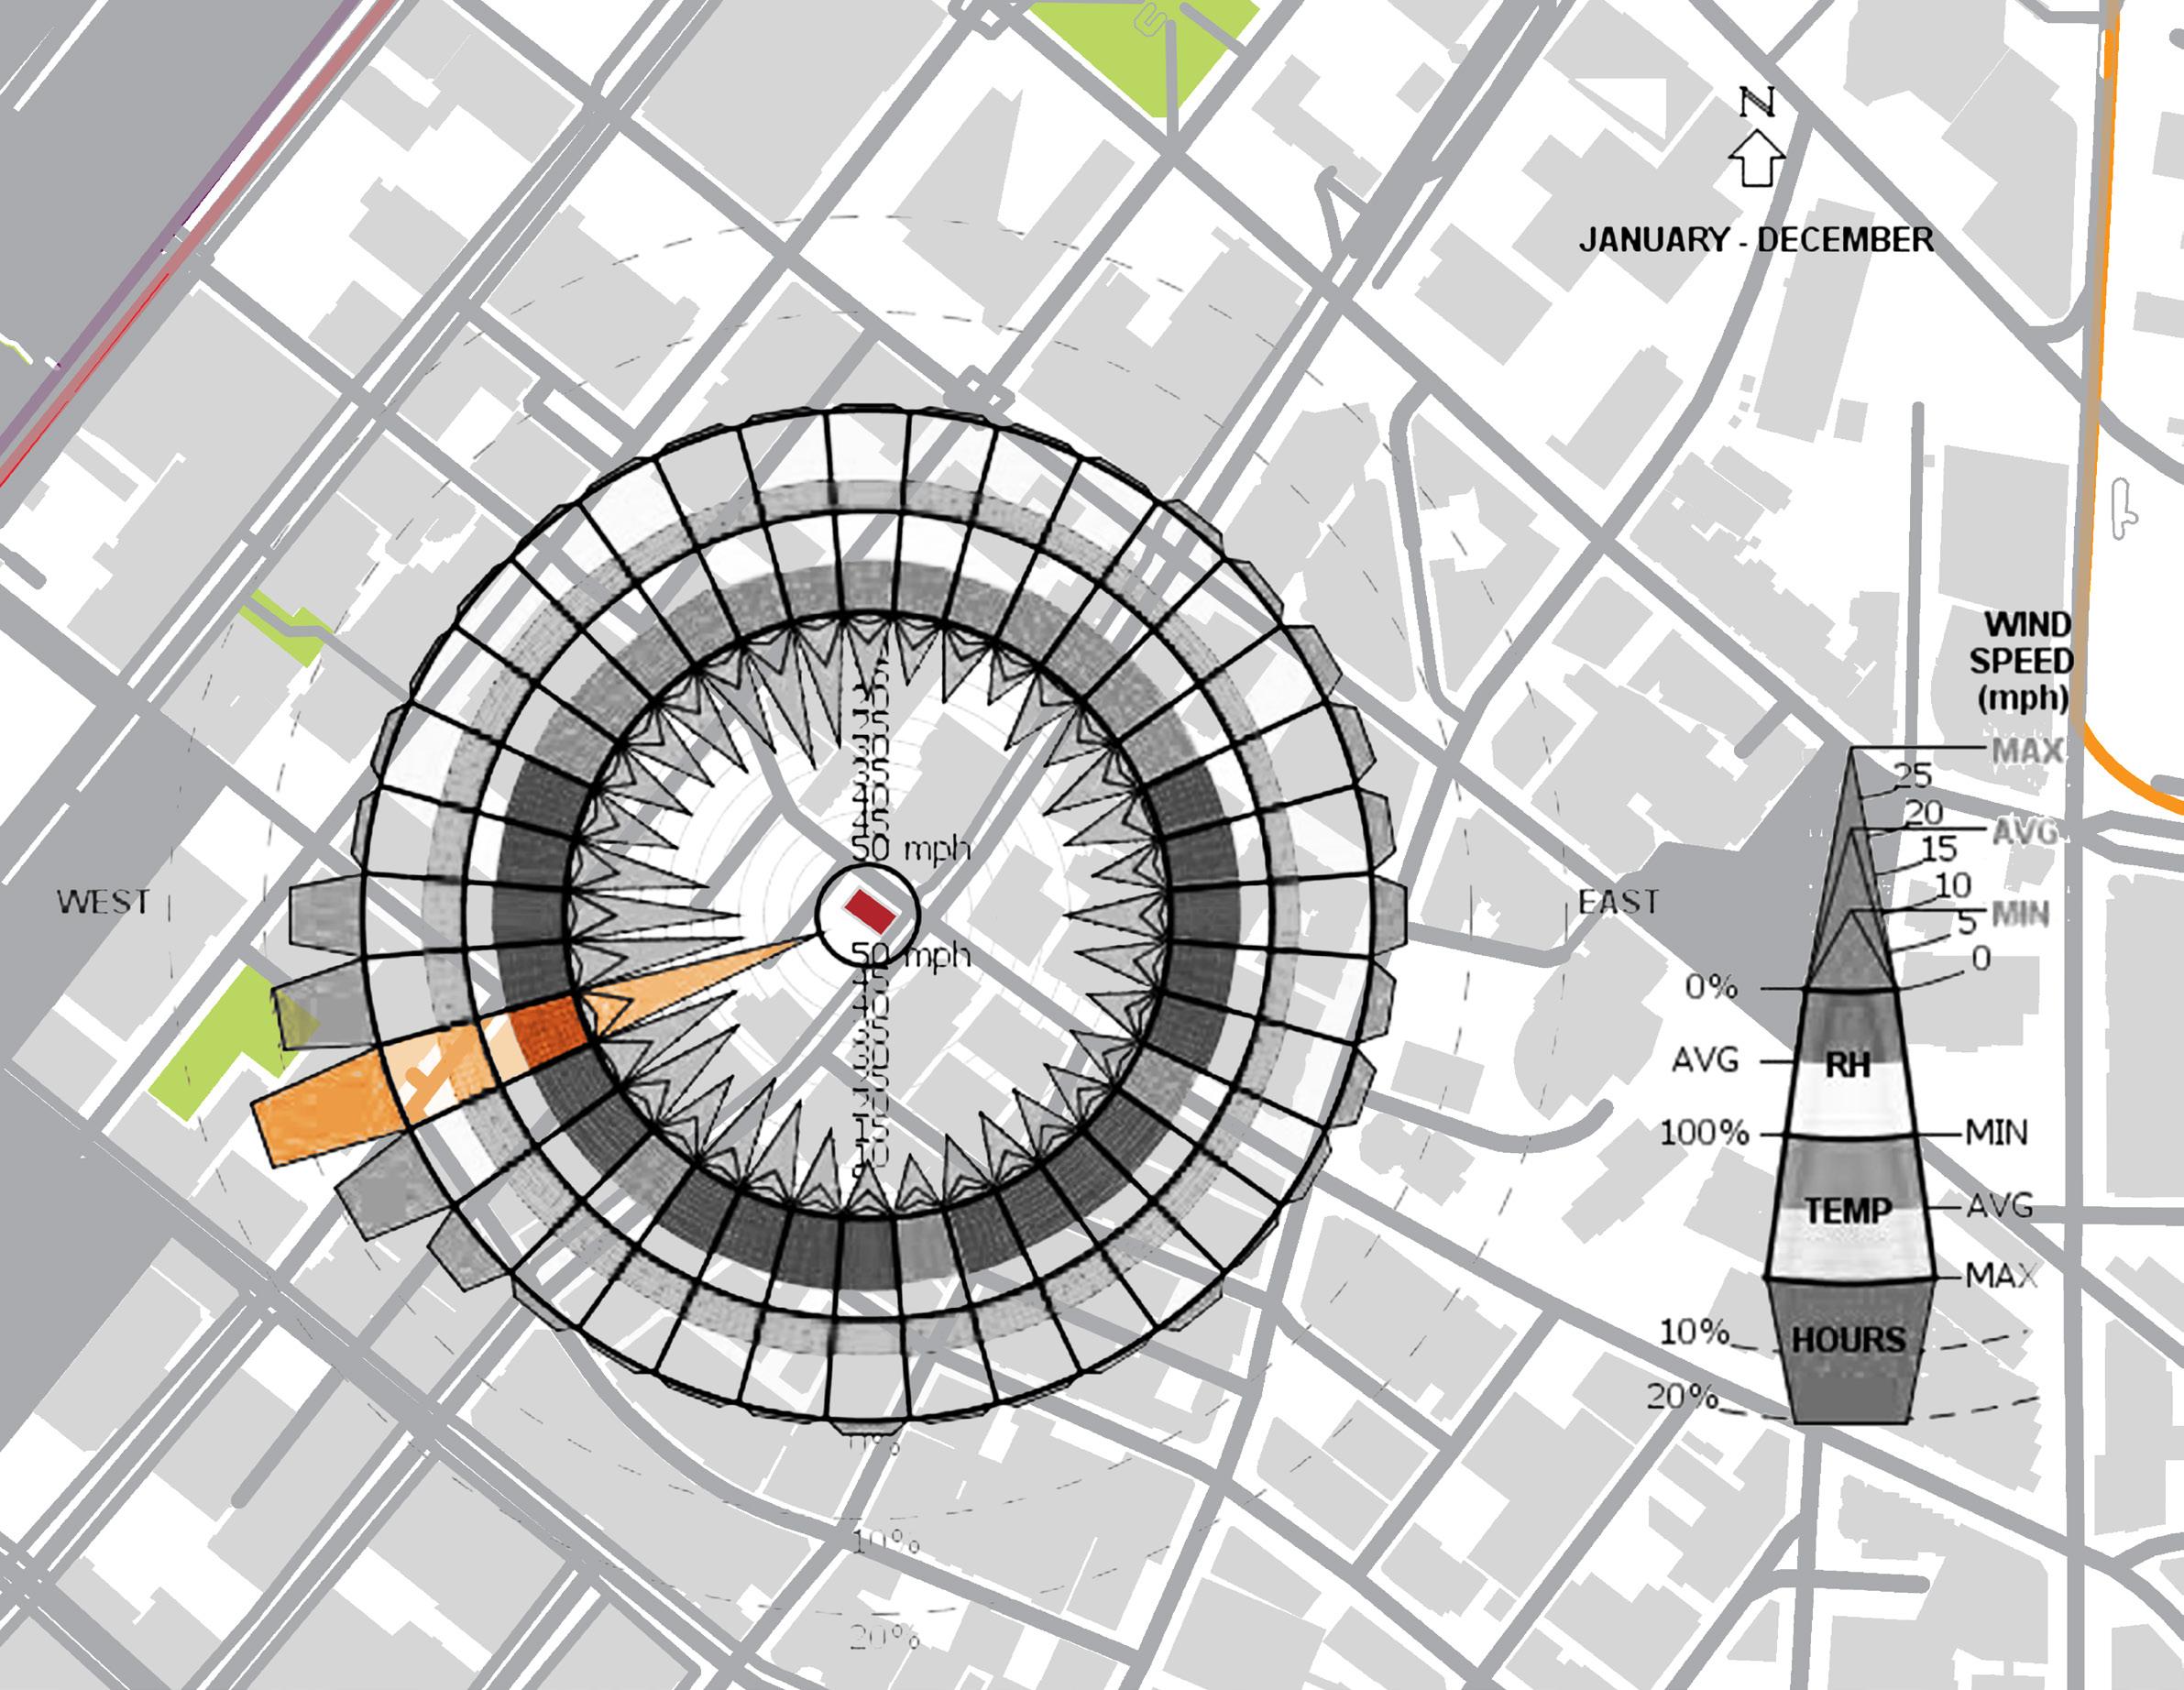
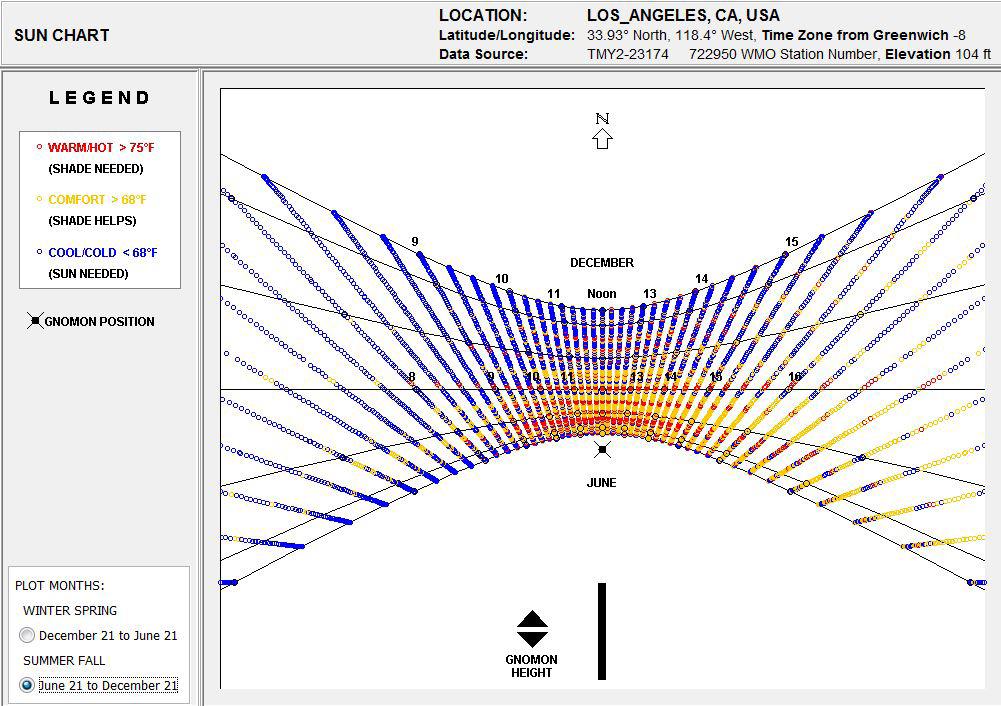
REGION|Climate Wind
Santa Ana Winds, Site Wind Patterns
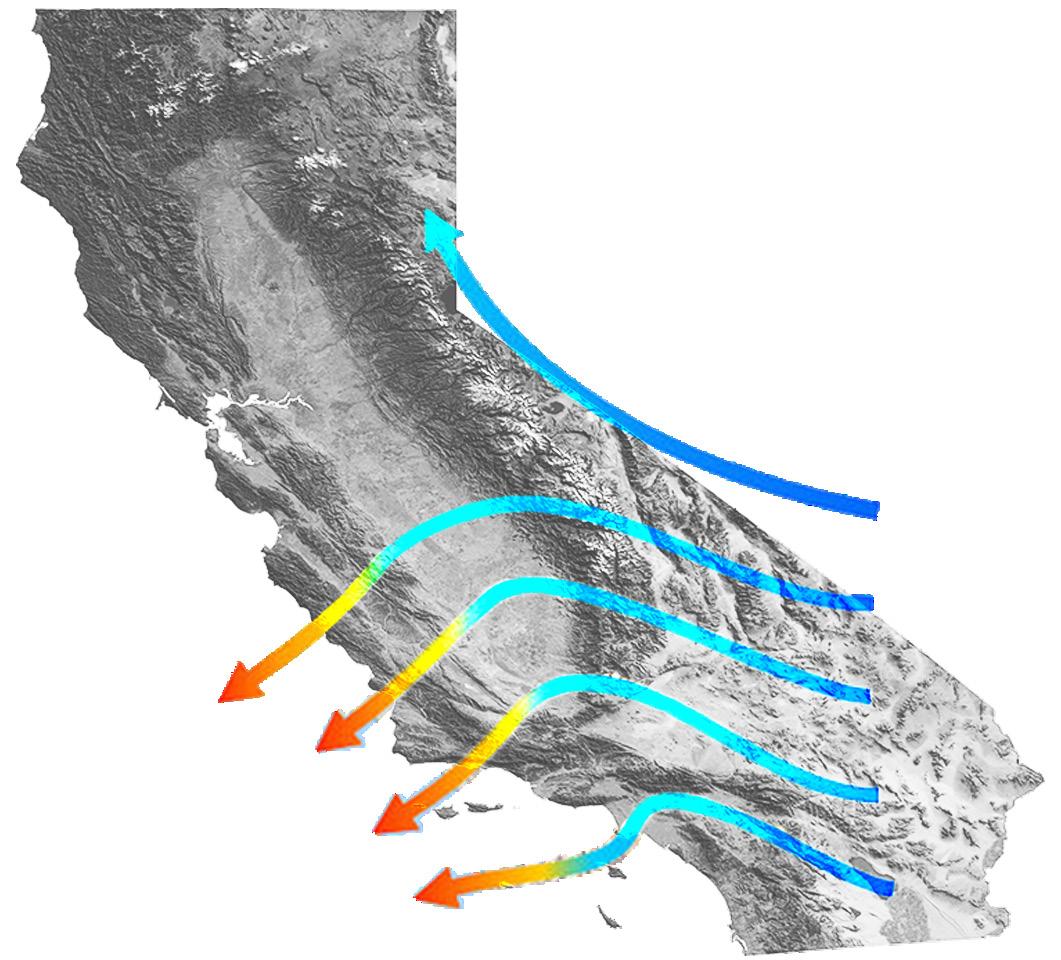
Summers are pleasantly cooled by ocean winds. Though these offshore winds bring high humidity, comfort is maintained because of the relatively low temperatures. Ocean breezes are typically strongest later in the evening, and in the winter, winds from the Santa Ana mountain range may bring unwanted heat and dust. During the winter, the wind reverses and brings hot, dry desert air known as Santa Ana winds.
Santa Ana winds are strong, warm, and dry winds that originate from the Great Basin area north east of Los Angeles. The winds are most common in the fall, when they are the hottest and most destructive. Known as “devil winds”, they are a major contributor to the infamous forest fires in Los Angeles.The winds begin northeast of Los Angeles and travel through the desert, becoming dryer and warmer along the way.
MATT SHAFRAN
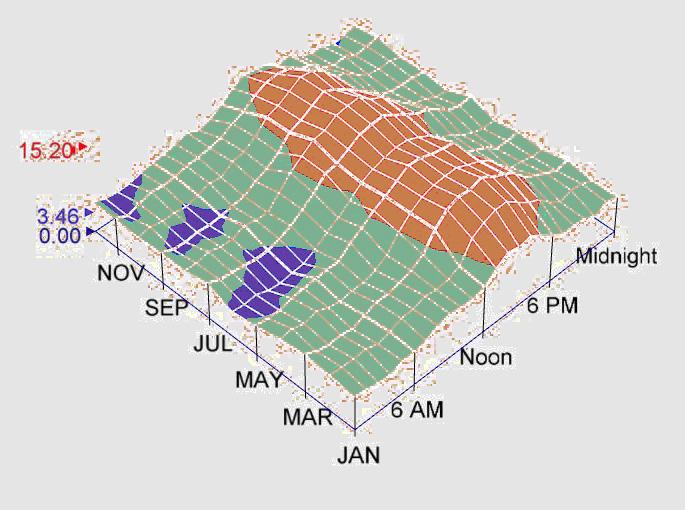
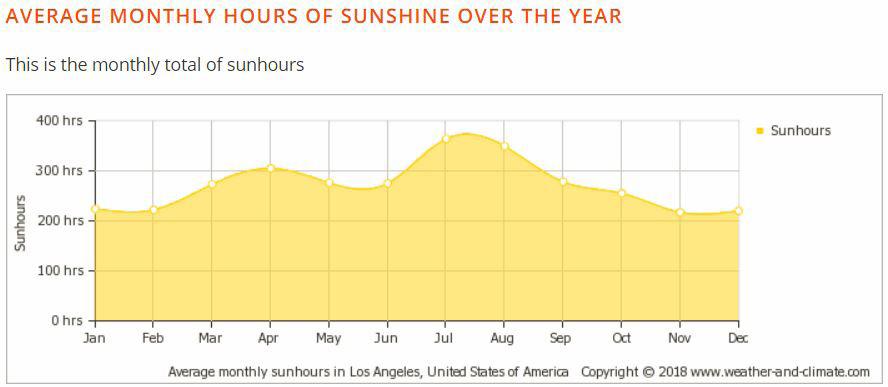
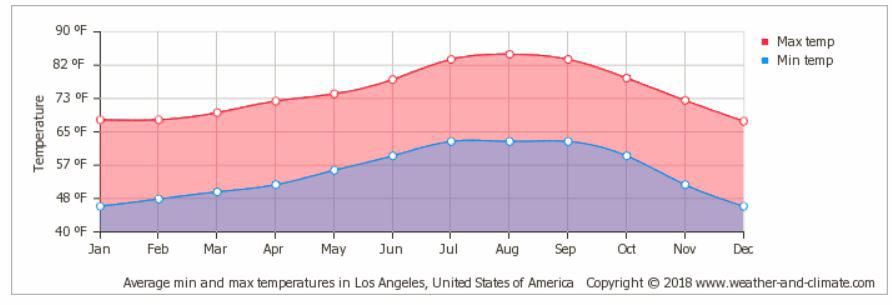
The warmest month(s) are July, August and September.
The warmest month is August.
The coolest month is December.
The average annual maximum temperature is: 75.2° Fahrenheit (24.0° Celsius)
The average annual minimum temperature is: 55.4° Fahrenheit (13.0° Celsius)
Due to the constant sun exposure in Los Angeles, solar power is a large contributor in the energy production in the state.
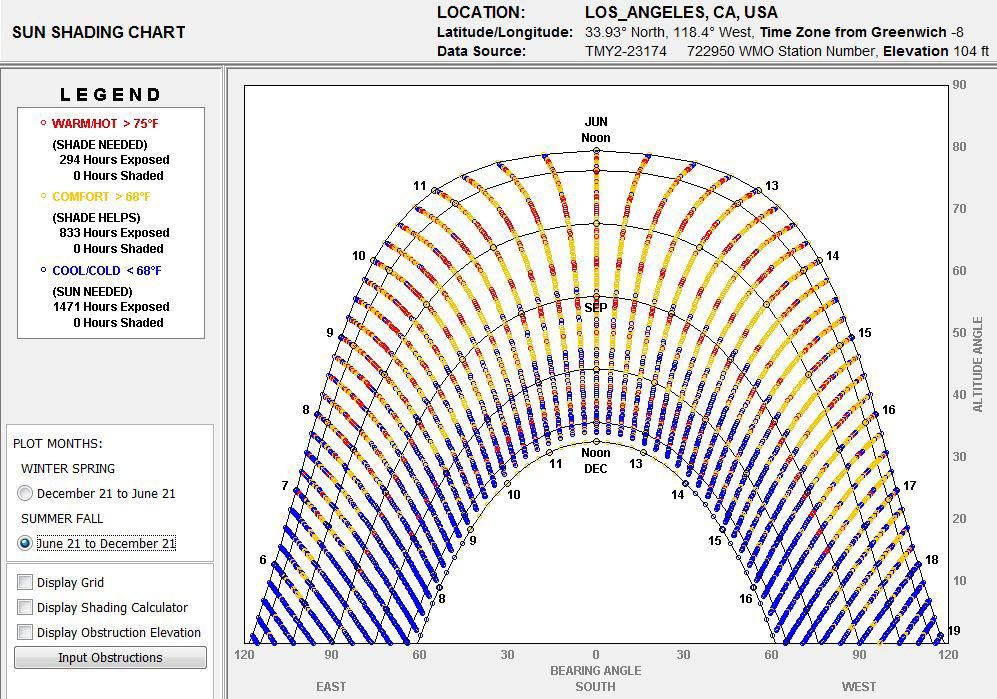
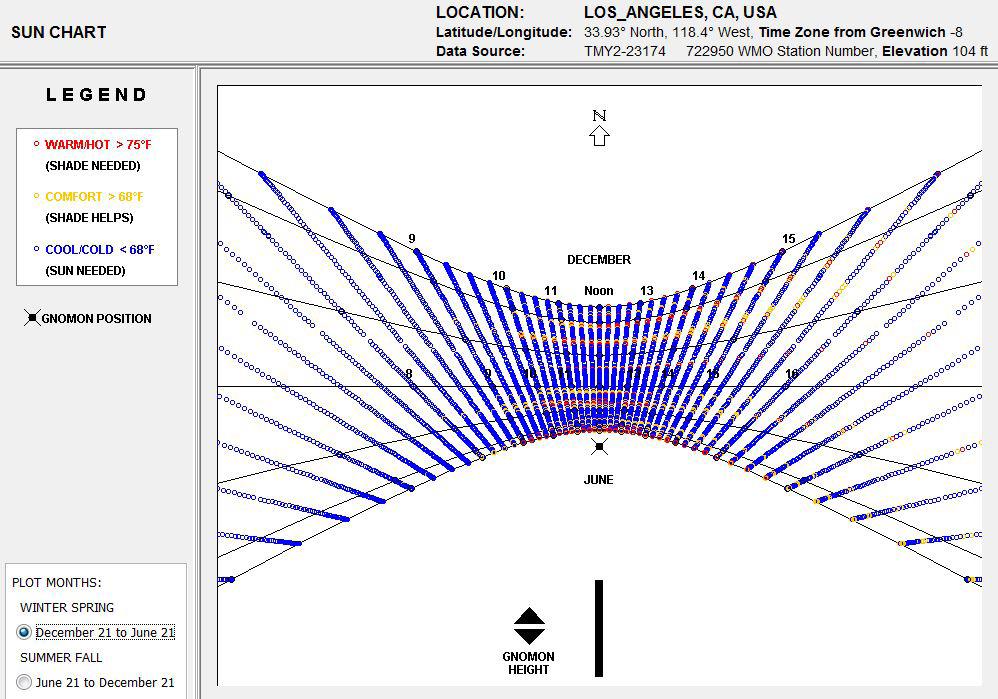
So much so that the cost of solar systems is lower here than in other areas in the country. Even residential buildings are encouraged to install a solar energy system
Summer- Fall
Winter-Spring
Summer- Fall
Winter-Spring
HARDI SHAH
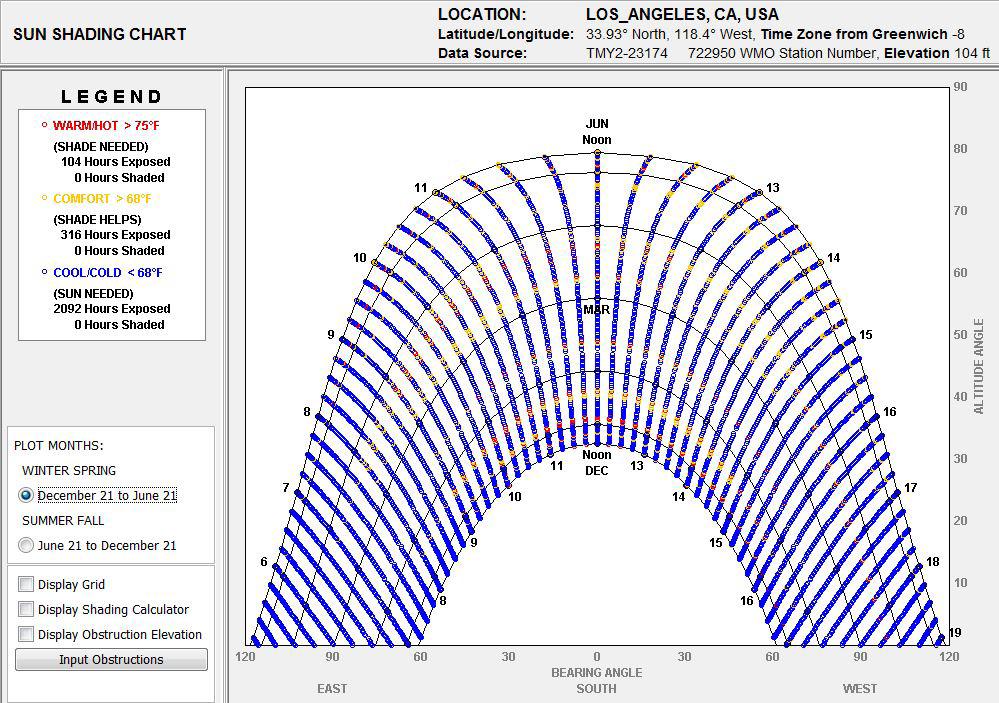
Daily Patterns, Summer/Winter Equinoxes CLIMATE| Sun and Temperature
2005-2009 American Community Survey:
White: 41.3% (Non-Hispanic Whites: 29.4%)
Hispanic or Latino (of any race): 47.5%
Black or African American: 9.8%
Native American: 0.5%
Asian: 10.7%
Native Hawaiian and Other Pacific Islander: 0.2%
Other: 25.2%
Two or more races: 2.8%
59.4% were born in the United States
0.9% were born in Puerto Rico, US territories, or abroad to American parents
39.7% of the population were foreign-born.
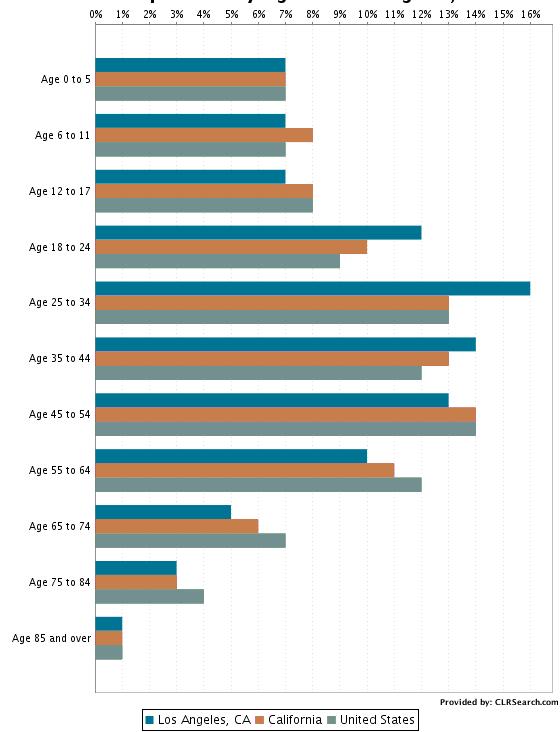
Highest: Veterans Administration at 48yrs
Lowest: Watts at 21yrs
Bel-Air currently ranks the highest with a median income of $207,938
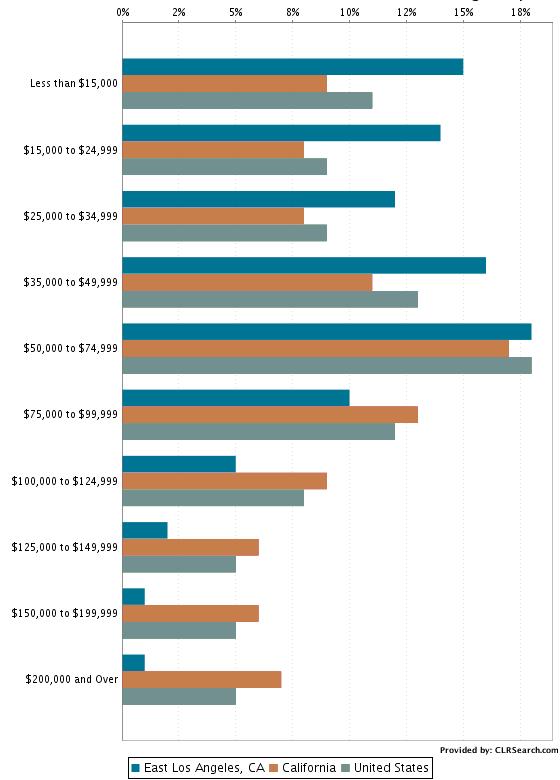
Downtown LA ranks the lowest with a median income of $15,003
MATT SHAFRAN
Ethnicity Age Median Household
Ethnicity, Age, Median Household Income
Income
SITE|Demographics
The quality of the surrounding real estate is a factor in the price and affordability of the proposed building for our site. The upcoming high-rises and residential units coupled with the existing residential options allow us to believe that the area is undergoing
HARDI SHAH
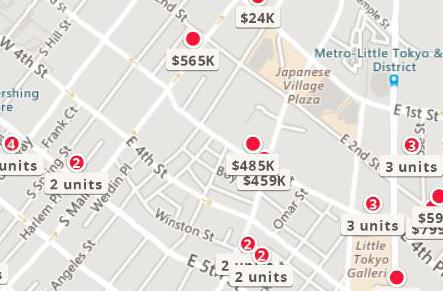
108 W 2nd St APT 909, Los Angeles, CA 90012 267 S San Pedro St UNIT 508, Los Angeles, CA 90012 420 S San Pedro St, Los Angeles, CA 90013 Address -- beds 1 bath 750 sqft 2 beds 2 baths 970 sqft -- beds 1 bath 700 sqft Unit Details 301-305 S Los Angeles St, Los Angeles, CA 90013 $565,000 $485,000 $420,000 Listed Price $753 $500 $599 A B C Price per Sq ft A B C A B C Real Estate Pricing SITE| Surrounding Properties
gentrification and with the goal of providing more residential options for young professionals.
Sale Notes
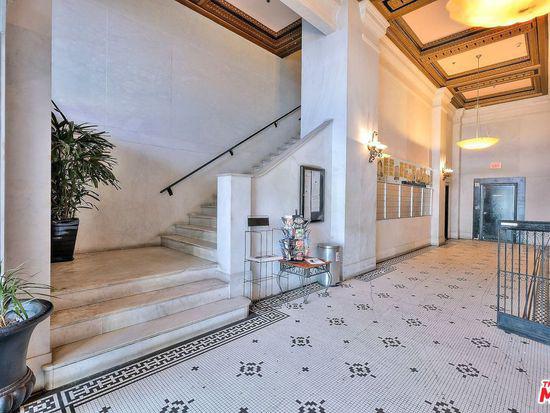
2-Story Commercial Building On Prime DTLA Corner
Gateway To The Downtown Historic Core
Frontage on E. 3rd Street and Los Angeles Street
Price: Not Disclosed
Property type: Retail
Property Sub-type: Storefront Retail/Office
Building Class: C
Sale Type: Investment
Gross Leasable Area: 8,700 SF
No. of Stories: 2
Year Built: 1920
Parking Ratio: 0.23/1,000 SF
Clear Ceiling Height: 8 FT
Zoning Description: C4
Unlimited Stories- No Max Height
Required Yards
Front: None
Side: None for commercial; For residential at lowest residential story: 10% lot width < 50 ft.; 5 ft.; 3 ft. min.; + 1 ft. for each story over 2nd, not to exceed 16 ft.
Rear: None for commercial; For residential at lowest residential story: 15 ft. + 1 ft. for each story over 3rd; 20 ft. max.
Minimum Area per Lot 5,000 sqft
Minimum Area per D.U. 400 sq. ft.; 200 sq. ft. per guest room
Minimum Lot Width 50 ft
SITE|Property Details
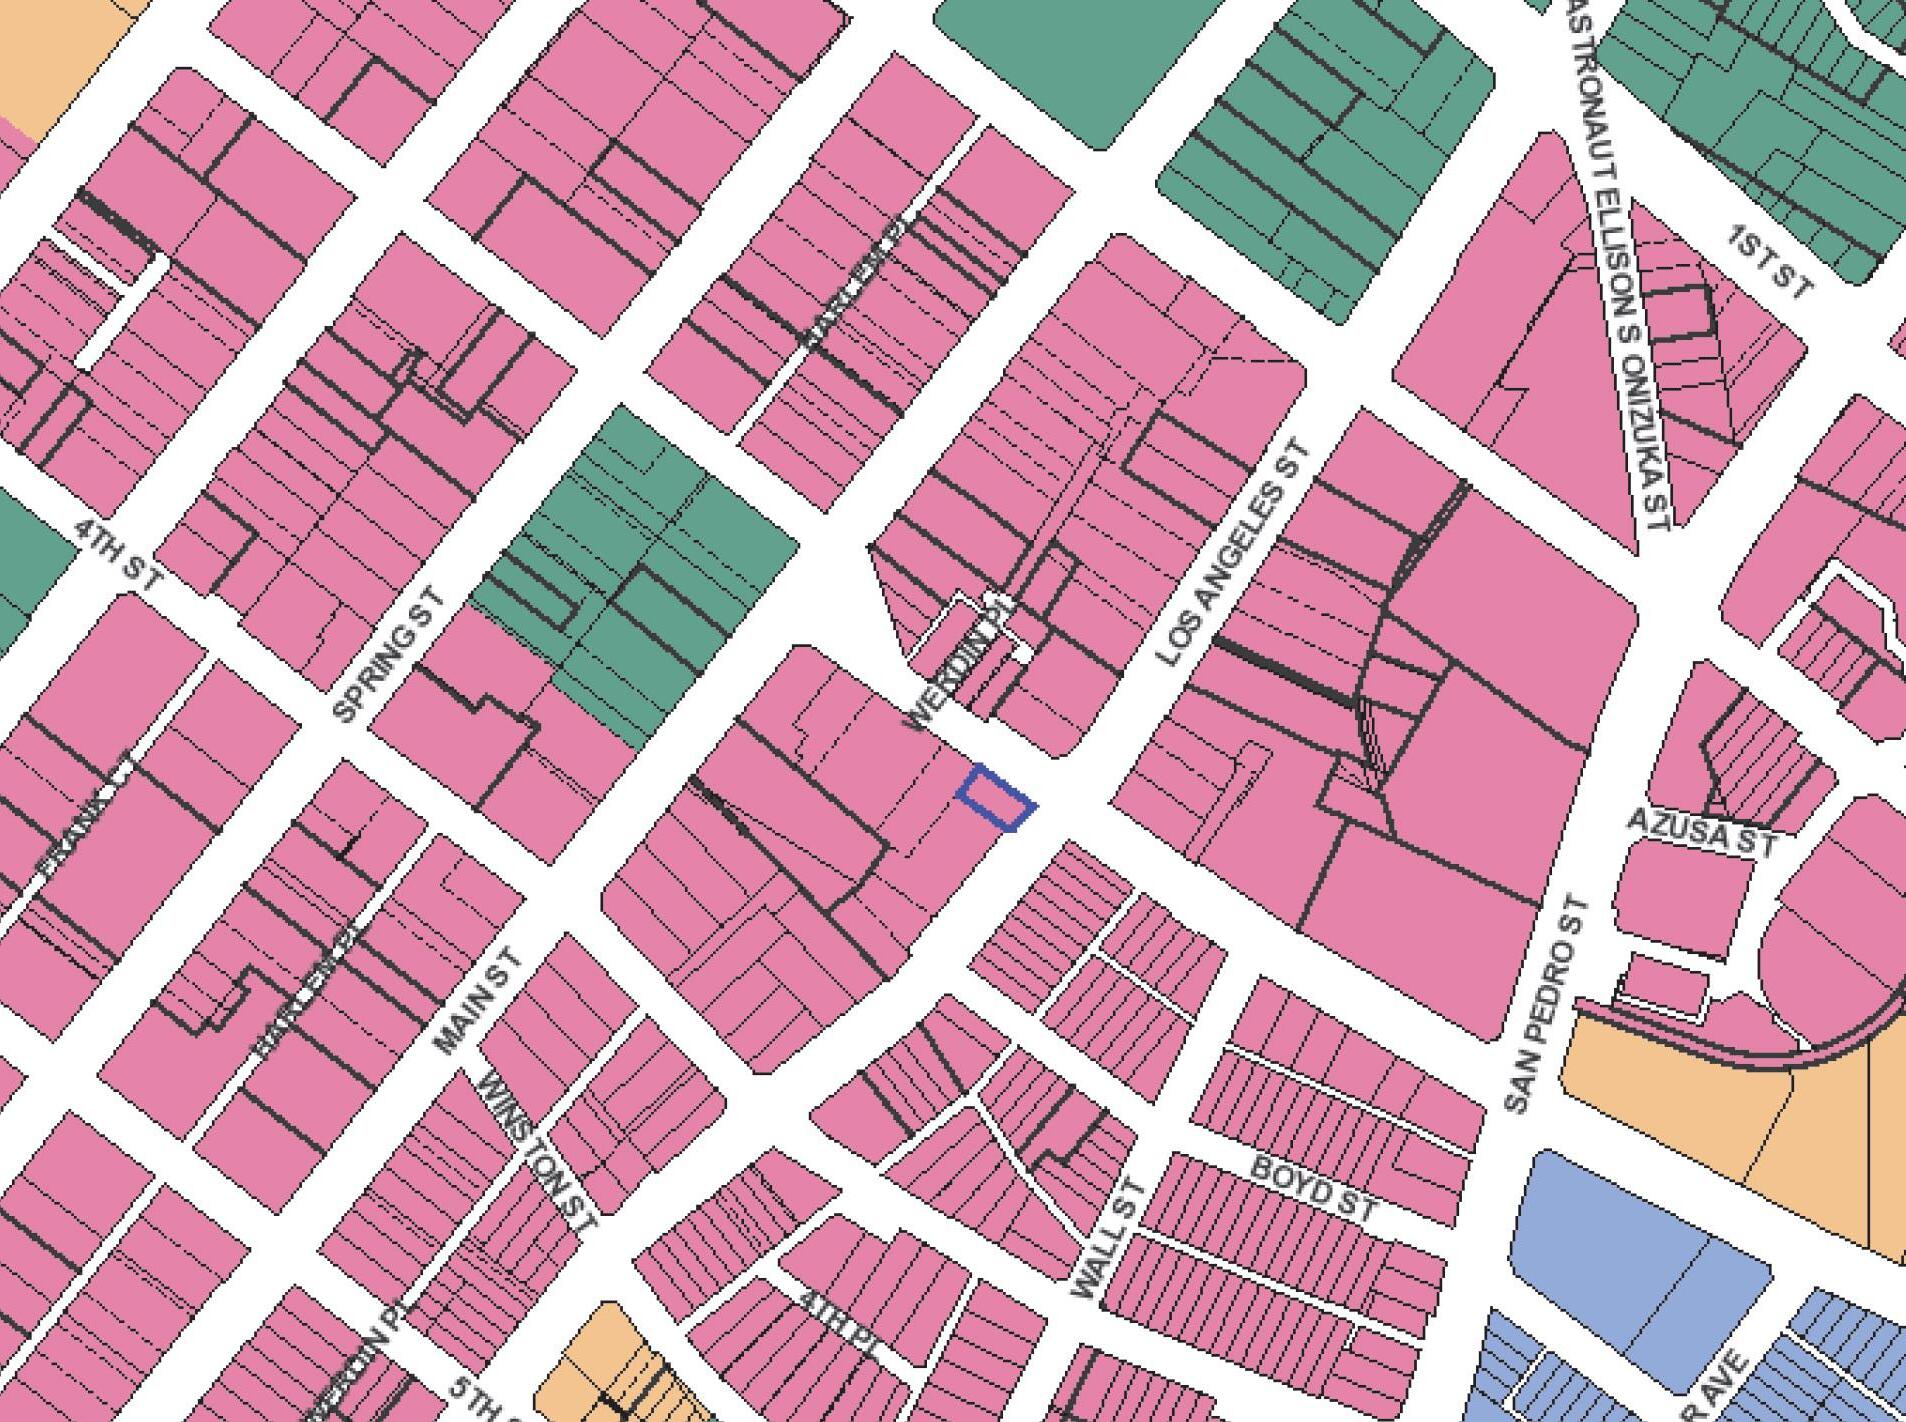
APN / Parcel ID: 5148-001-009 Zoning,
HARDI SHAH
Square Footage
820 S
90014
888 S Hope St Los Angeles, CA 90017
1133 S Hope St Los Angeles, CA 90015
900 S
St Los Angeles, CA 90015
SITE|Development
Current and Future Developments of the Area
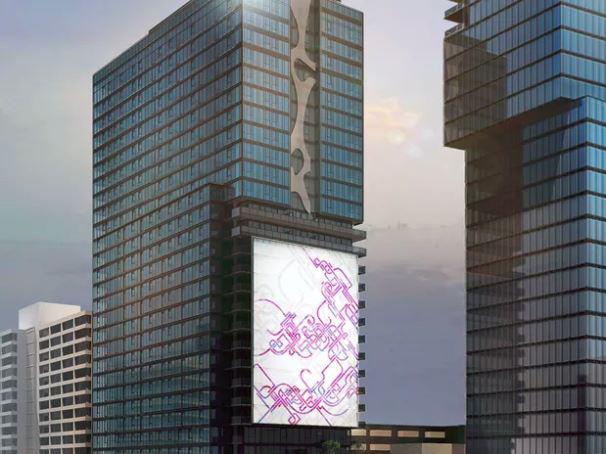
Current 20+ story buildings
Future development of 20+ story buildings
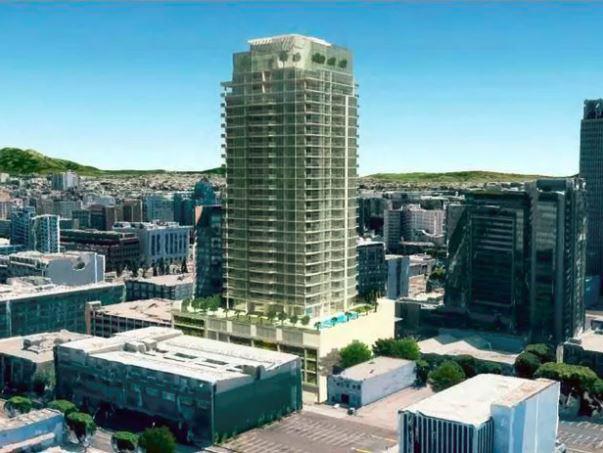
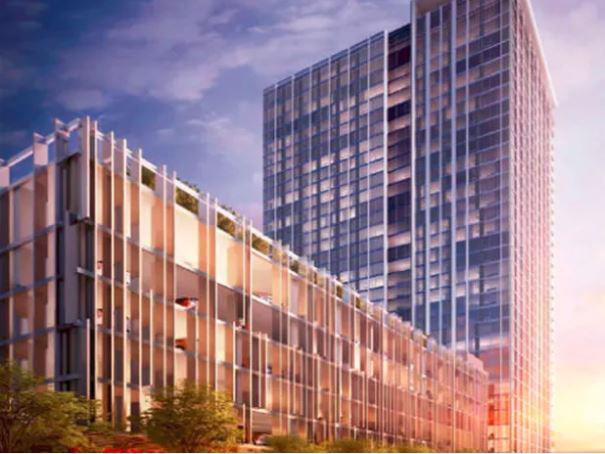
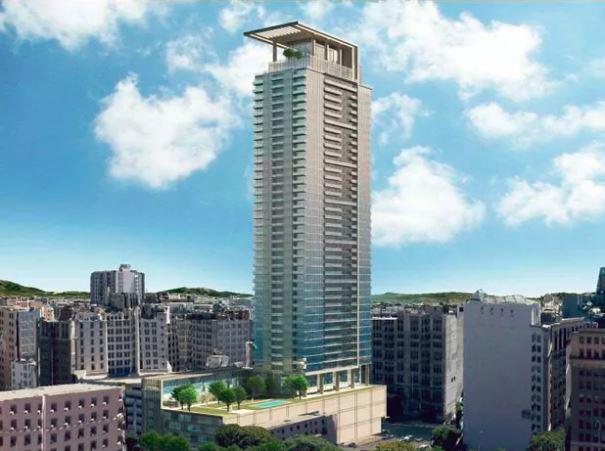
Each of these blue numbers mark a 20+ story high rise coming up in the upcoming areas of the Arts District and South Park while the green dots mark current 20+ story buildings. Buildings are being constructed at this height in the North, West, and South directions from the site. Skid row to the East is battling gentirfication as well as Little Tokyo. Both areas are small neighborhood with smaller scale residential and commercial.
HARDI
SHAH
Olive St Los Angeles, CA
Figueroa
CHOOSING THE CLIENT
Based on the unique intersection of districts and their character at our site, Nintendo was the perfect fit. It responded to the history of toys of the Toy District, the monumentality of DTLA, and the creative industriality of the Arts District.
Our site is located in an area of LA where districts and cultures merge. It is surrounded by LA’s famous Downtown area, but is immersed into the historic Japanese culture of the area. Various opportunities to respond to landmarks and culture are available here.
The immediate site is surrounded by several entertainment and toy stores, popular in the Toy District of LA. There are also numerous parking lots and garages.
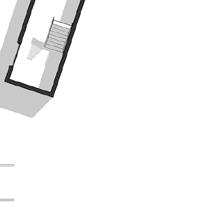
The building on site was constructed in 1920.
Construction Period: 1920s in LA
1920s- Boom in Construction in LA: 155 projects of at least 50,000 square feet were constructed from 1920 to 1929 because the city’s population more than doubled in size from 577,000 to over 1.2 million
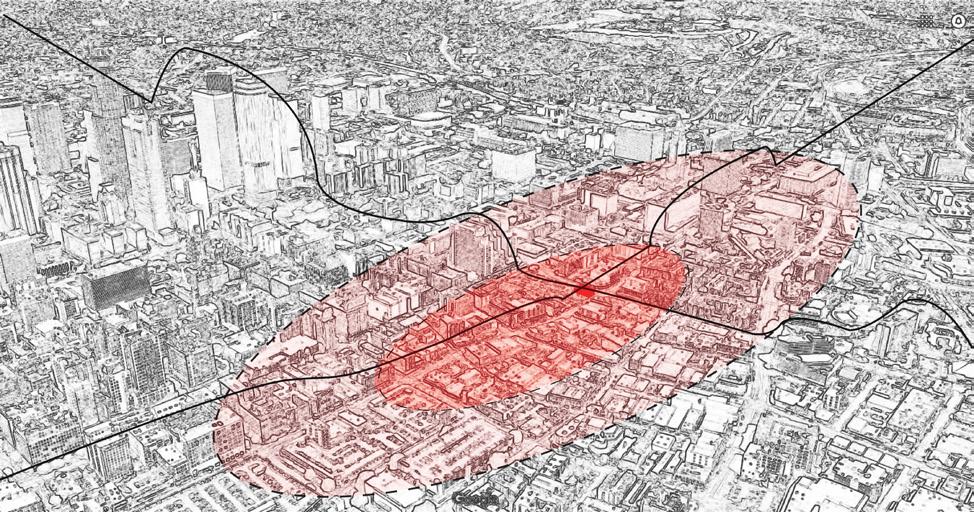
Downtown: Area which encompasses all of the following districts.
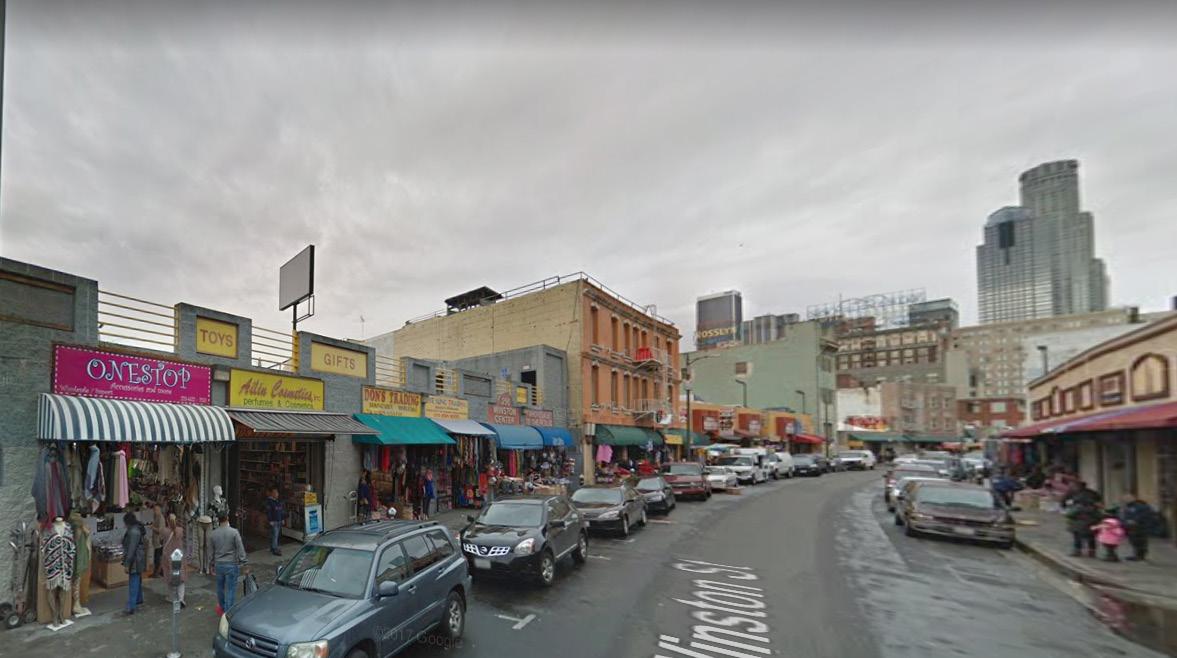
Toy District: 12-block area consisting of 1- and 2-story buildings painted in pastel shades and home to about 500 toy- and electronics-related businesses. Originally a part of Skid Row until 1980’s.
Arts District: Lies on the eastern edge of Downtown Los Angeles, known for giving new life to old industrial buildings from the early 20th century. Art galleries and museums are slowly being activated as more and more factories are being revitalized.
SITE|District Intersection
MATT SHAFRAN
Toy District, Arts District
DTLA,
DTLA Toy District Arts District 305SLosAngelesSt SMainSt E3rdSt E4thSt TOY DISTRICT TOYS GAMES SHOPS ENTREPRENEURS RETAIL ELECTRONICS ARTS DISTRICT ART CREATIVE MUSIC GALLERIES INDUSTRIAL DOWNTOWN DISTRICT PARKS TRANSIT MUSEUMS THEATER BUSINESS HIGHRISE
ARTS DISTRICT DTLA TOY DISTRICT
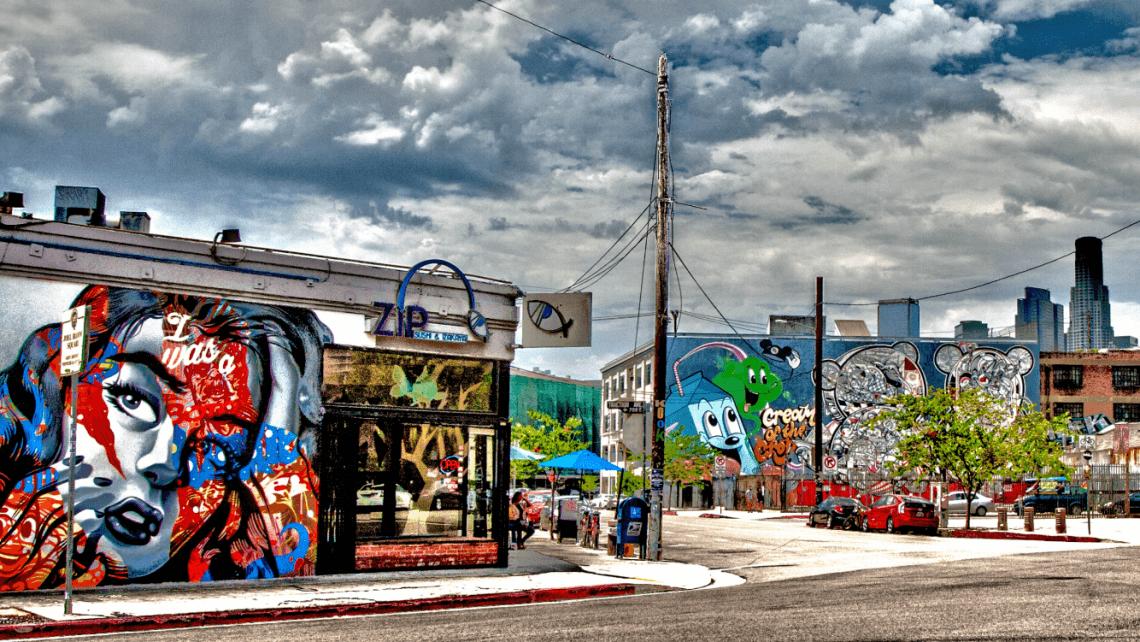
SITE|District Character
HARDI SHAH
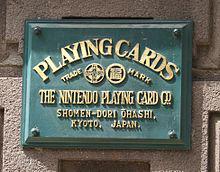
1889 | Former headquarters plate, from when Nintendo was specifically a playing card company. They manufactured and sold “Hanafuda” cards, which translates to “flower cards”, popularly used in Japan for various games.
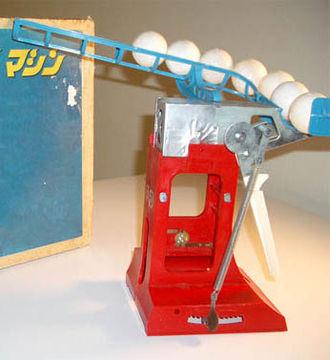
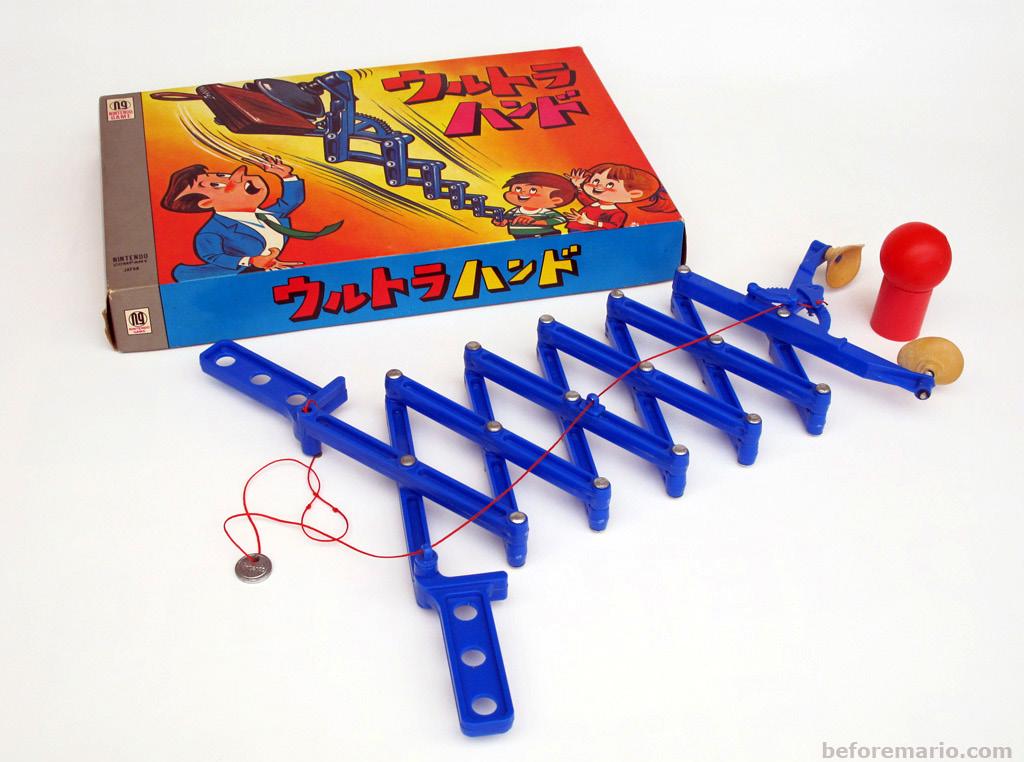
1970’s | After hiring Gunpei Yokoi, a maintenance engineer for the assembly line, Nintendo tested the toy industry, creating games such as the Ultra Machine (left) and the Ultra Hand (middle). Yokoi eventually focused his efforts on creating electronic toys which were fairly new to the Japanese market. This innovation got Nintendo its initial success and fame, which led to their first video game console release in 1972.
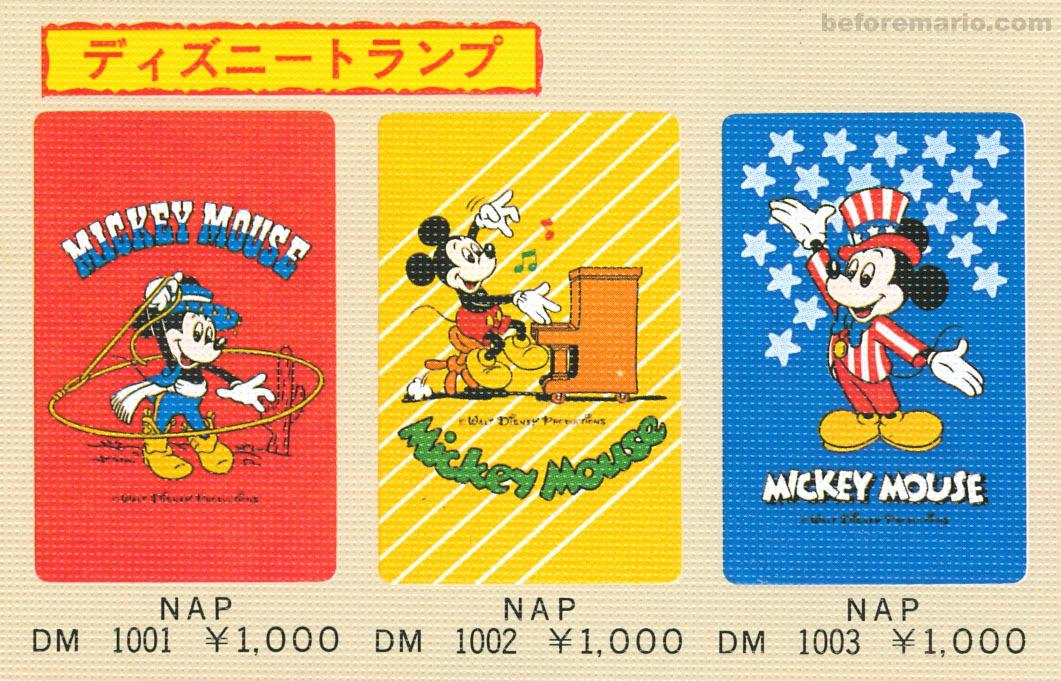
1950’s | Hiroshi Yamauchi, grandson of Nintendo’s founder, Fusajiro Yamauchi, took over the role as president of “Nintendo Playing Card Co., Ltd.” In 1956, after a meeting with the United States Playing Company, the world’s leading manufacturer of playing cards, he realized the limitations of a company whose only product is playing cards. Yamauchi struck a deal with Disney to use their characters on their playing card, broadening their market to Japanese families and households.
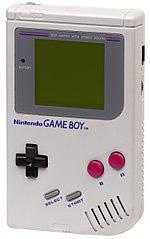
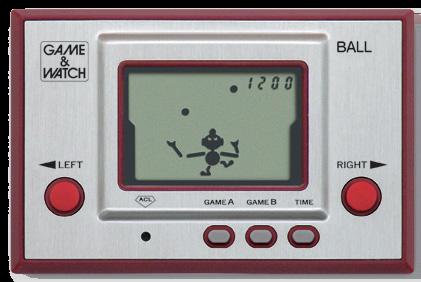
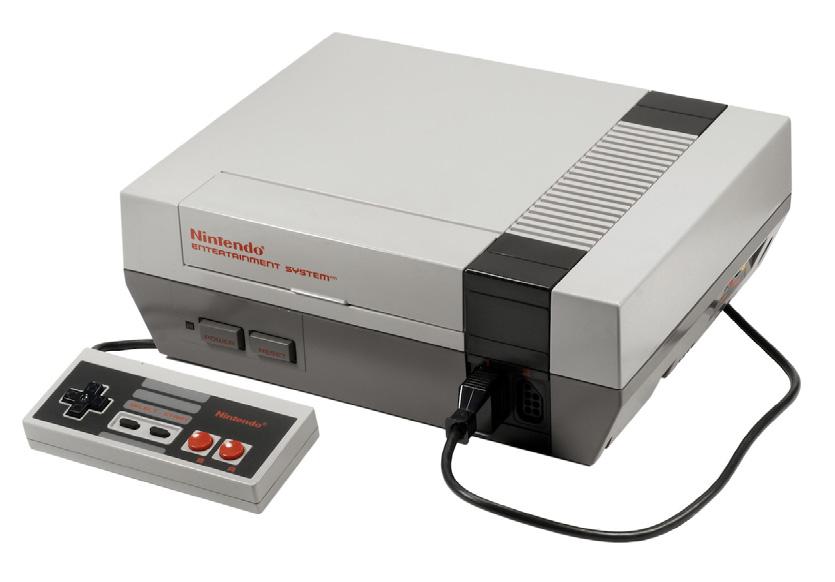
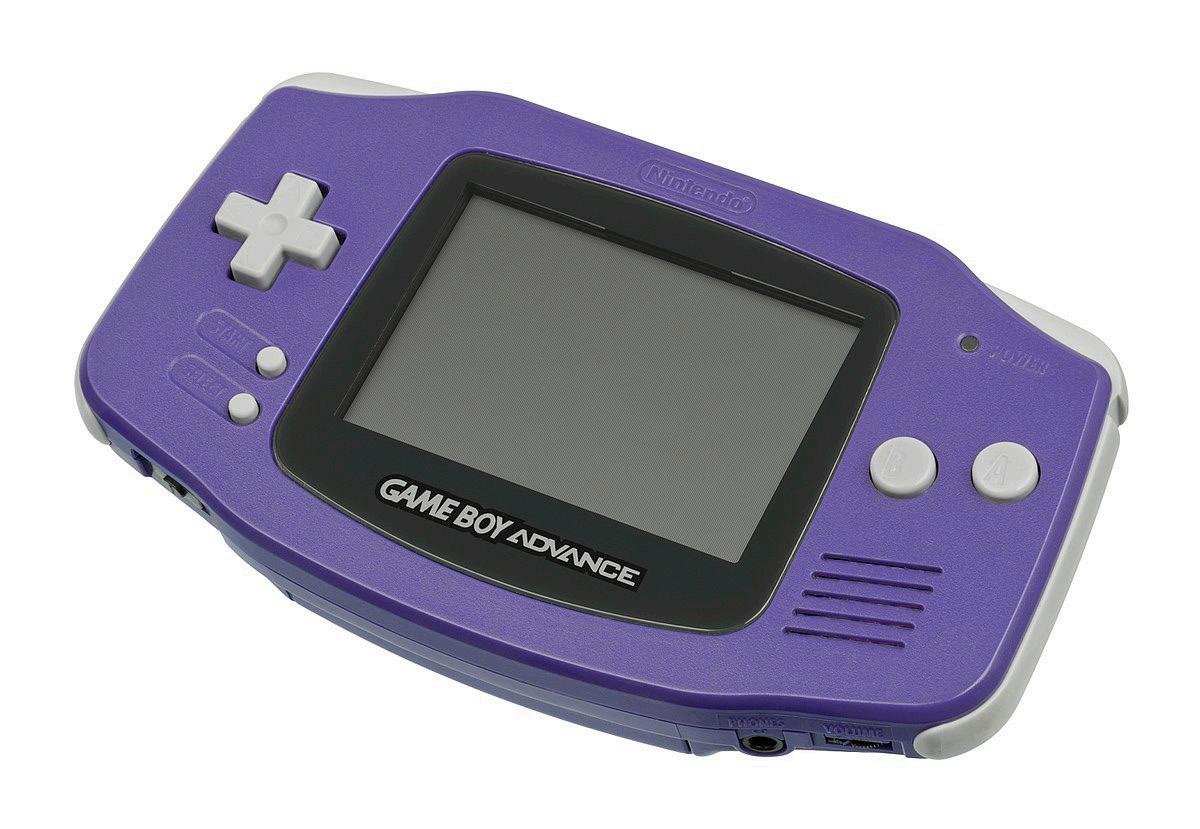
1980’s/90’s | Nintendo soon became a household name for video game consoles across the world. From 1980-1991, Nintendo produced the “Game & Watch” line of handheld electronic games (left). During that time, 43.4 million units were sold worldwide. In 1985, the Nintendo Entertainment System (NES) (middle) became one of the most popular consoles of all time. Nintendo also released Super Mario Bros in 1985, securing itself at the top of all video game manufacturers in the world. The consistent innovation of consoles, games, and characters, such as the Game Boy (right), Tetris, and Mario, Nintendo still remains the leading company in the video game industry.
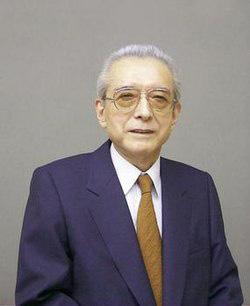
Nintendo Co., Ltd. is a Japanese electronics and video game company headquartered in Kyoto, Japan. Nintendo is one of the premier video game companies in the world, known for top-selling franchises such as Mario and Pokemon, and devices such as the Game Boy and Wii. Nintendo was founded in 1889 as a playing card company and eventually moved into the toy industry in the 1960’s. Struggling to compete with major toy companies such as Bandai and Tomy, Nintendo focused its efforts a new market: video gaming. The 1970’s brought Nintendo great success with the introduction of video game consoles and arcade games, creating company mascots such as Donkey Kong and Mario. Through the 1980’s & 90’s, Nintendo consistently produced industry leading consoles and games. In 1995, they announced they had sold one billion game cartridges worldwide, ten percent of which came from the Mario franchise. The 2000’s gave rise to the Game Boy and Wii, continuing the company’s success through the present day.
MATT SHAFRAN
History CLIENT|Nintendo
2001| Nintendo releases the Game Boy Advance, a 32-bit handheld video game console, selling 81.51 million units until its discontinuation in 2010.
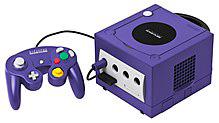
2001| Nintendo releases the GameCube, which is a home video game console that competed with Sony’s PlayStation 2 and Microsoft’s Xbox. 21.74 million units were sold until 2007.
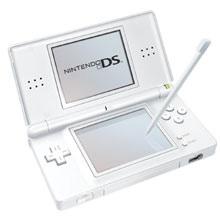
2004| Nintendo releases the DS, which is a dualscreen handheld game console featuring a touch screen, a built-in microphone, and wireless connectivity. All Nintendo DS models combined have sold 154.02 million units, which makes it the best selling handheld game console of all time.
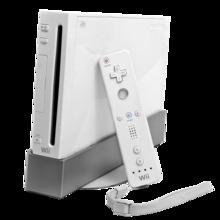
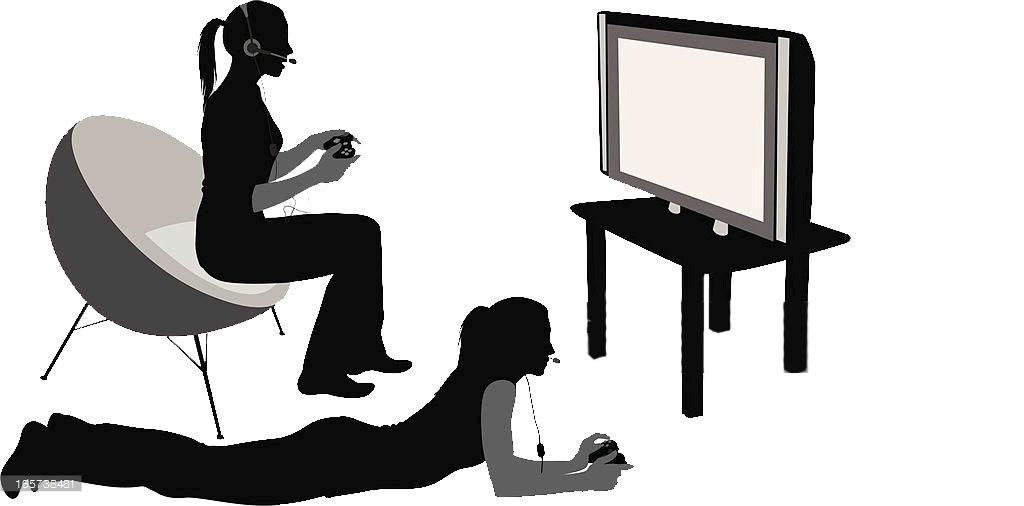
2006| Nintendo releases the Wii, the successor of the GameCube, competing with the PlayStation 3 and Xbox 360. This product targeted a larger market, introducing a handheld remove detecting movement in three dimensions. This console allowed users to become immersed in the game they’re playing.
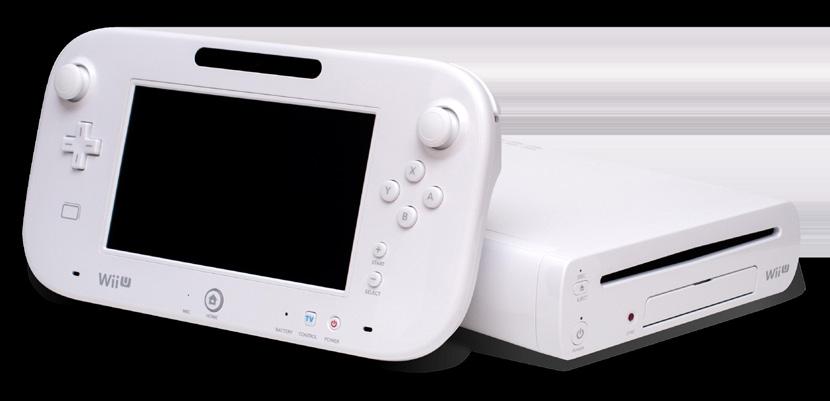
2012| Nintendo releases the Wii U, a home video game console that created some controversy. At first glance, the product images made it seem as if the Wii U had the option to become a portable device. However, the console was only meant to be a home console, not a portable one. On top of that, software and battery life issues led to a poor reaction from customers.
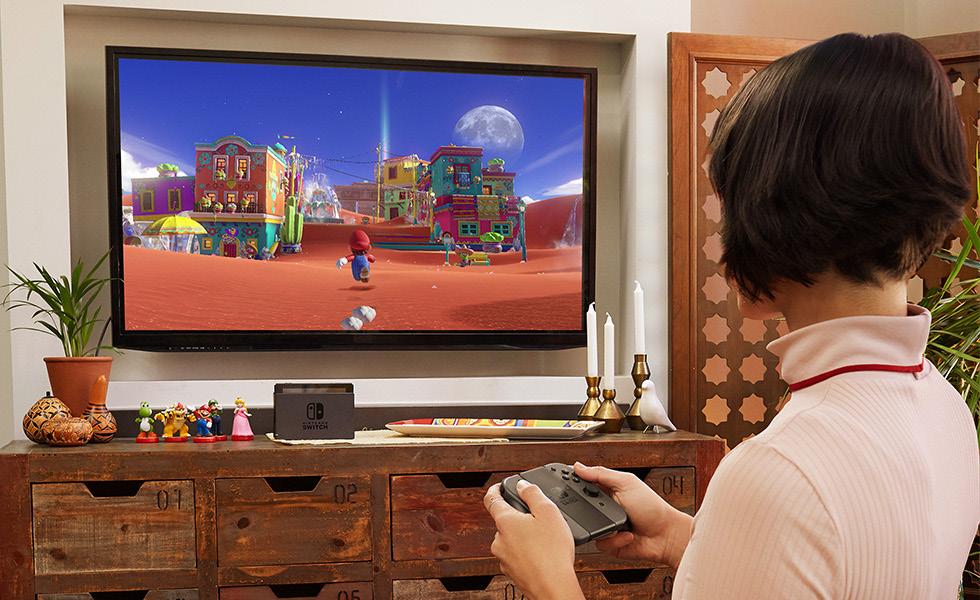
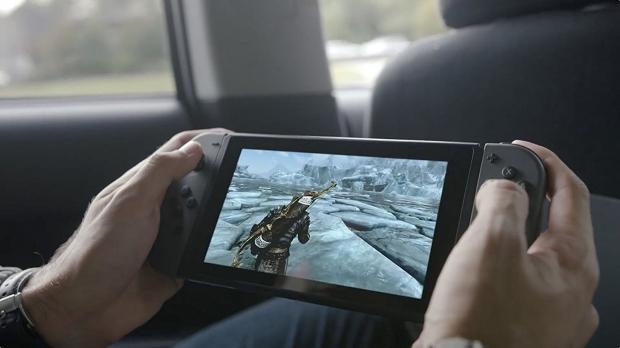
2017| Nintendo releases the Switch, which is a hybrid console with the ability to be played at home and on the go. The docking station allows the device to be plugged into a television, similar to the Wii or GameCube, and the removal of the LCD touchscreen from the docking station allows it to be handheld, similar to the Game Boy and DS. The above pictures show the consoles ability to be played in a living room and in the car.
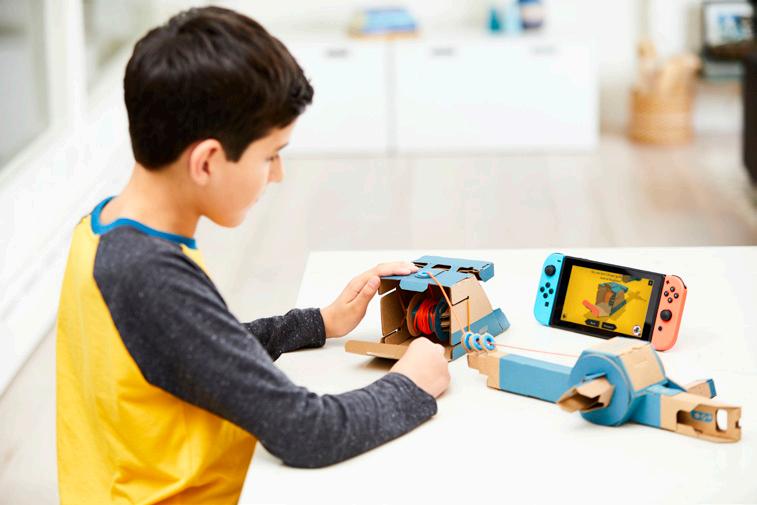
2018| Later this year, Nintendo will release a gaming and construction toy platform called Nintendo Labo, which is a line of interactive build-and-play kits for kids and for those who are kids at heart. The idea behind this DIY line of toys is to bring creativity to the video game world and allow the user to physically make their own gaming experience. Users can transform modular sheets of cardboards into creations called Toy-Con, that when combined with the Nintendo Switch, create a unique experience based on the game and creation.
CLIENT|Nintendo Current & Future
Nintendo’s success with the Game Boy and the Pokemen franchise in the early 2000’s has allowed the company to stay at the top of the video game idustry for years to come. Nintendo has maintained its success through the present day, opening offices in cities worldwide. Nintendo UK was established in 2001 and Nintendo Italia in 2002. The Game Cube, Nintendo DS, and Wii are three of the major consoles sold by Nintendo during the 2000’s.
Today, Nintendo is focusing their efforts on portability and “on the go” video gaming. The release of the Nintendo Switch competed with Play Station 4 and Xbox One due to its ability to be used with multiple players while on the go. It has become the fastest-selling video game console of all time.
Also, the Nintendo Labo combines the Nintendo Switch with DIY creations. The idea behind the Labo is to reach back to its toy-making roots and allow kids to fully immerse themselves into games by having them physically build them.

MATT SHAFRAN
USING NINTENDO’S GOAL AS OUR OWN
Nintedo has been constantly moving towards a more digitally dependent type of play but their goal for the future is to reconnect physical play to their gaming devices. This connection between the digital and physical play is what we strive to achieve in our Research & Development Center.
MATT SHAFRAN 1890 2017 1985 1970 2006 2001 1950 2018 FUTURE Playing Card Co. Disney Cards Electronic Consoles Virtual Consoles Construction Consoles Toy Industry Handheld Consoles Hybrid Consoles REAL + VIRTUAL PLAY
INACTIVE PLAY
IMMERSIVE
PHYSICAL, OUTDOOR PLAY

VIRTUAL REAL
INTERACTIVE PLAY
PHYSICAL
TRADITIONAL VIDEO GAMES

This research and development center will strive to create an immersive digital environment adjacent to a real, physical landscape and build a strong relationship between the two types of play.
HARDI SHAH


HARDI SHAH
IMMERSIVE datum
PHYSICAL VIRTUAL VIRTUAL REAL REAL INACTIVE PLAY INACTIVE PLAY TRADITIONAL VIDEO GAMES TRADITIONAL VIDEO GAMES
VIRTUAL INACTIVE PLAY TRADITIONAL VIDEO GAMES PHYSICAL, OUTDOOR PLAY PHYSICAL, OUTDOOR PLAY INTERACTIVE PLAY INTERACTIVE PLAY
REAL PHYSICAL, OUTDOOR PLAY INTERACTIVE PLAY
IMMERSIVE
PHYSICAL
IMMERSIVE
PHYSICAL
SITE & SCHEMATIC DEVELOPMENT
Current 20+ story buildings
Future development of 20+ story buildings
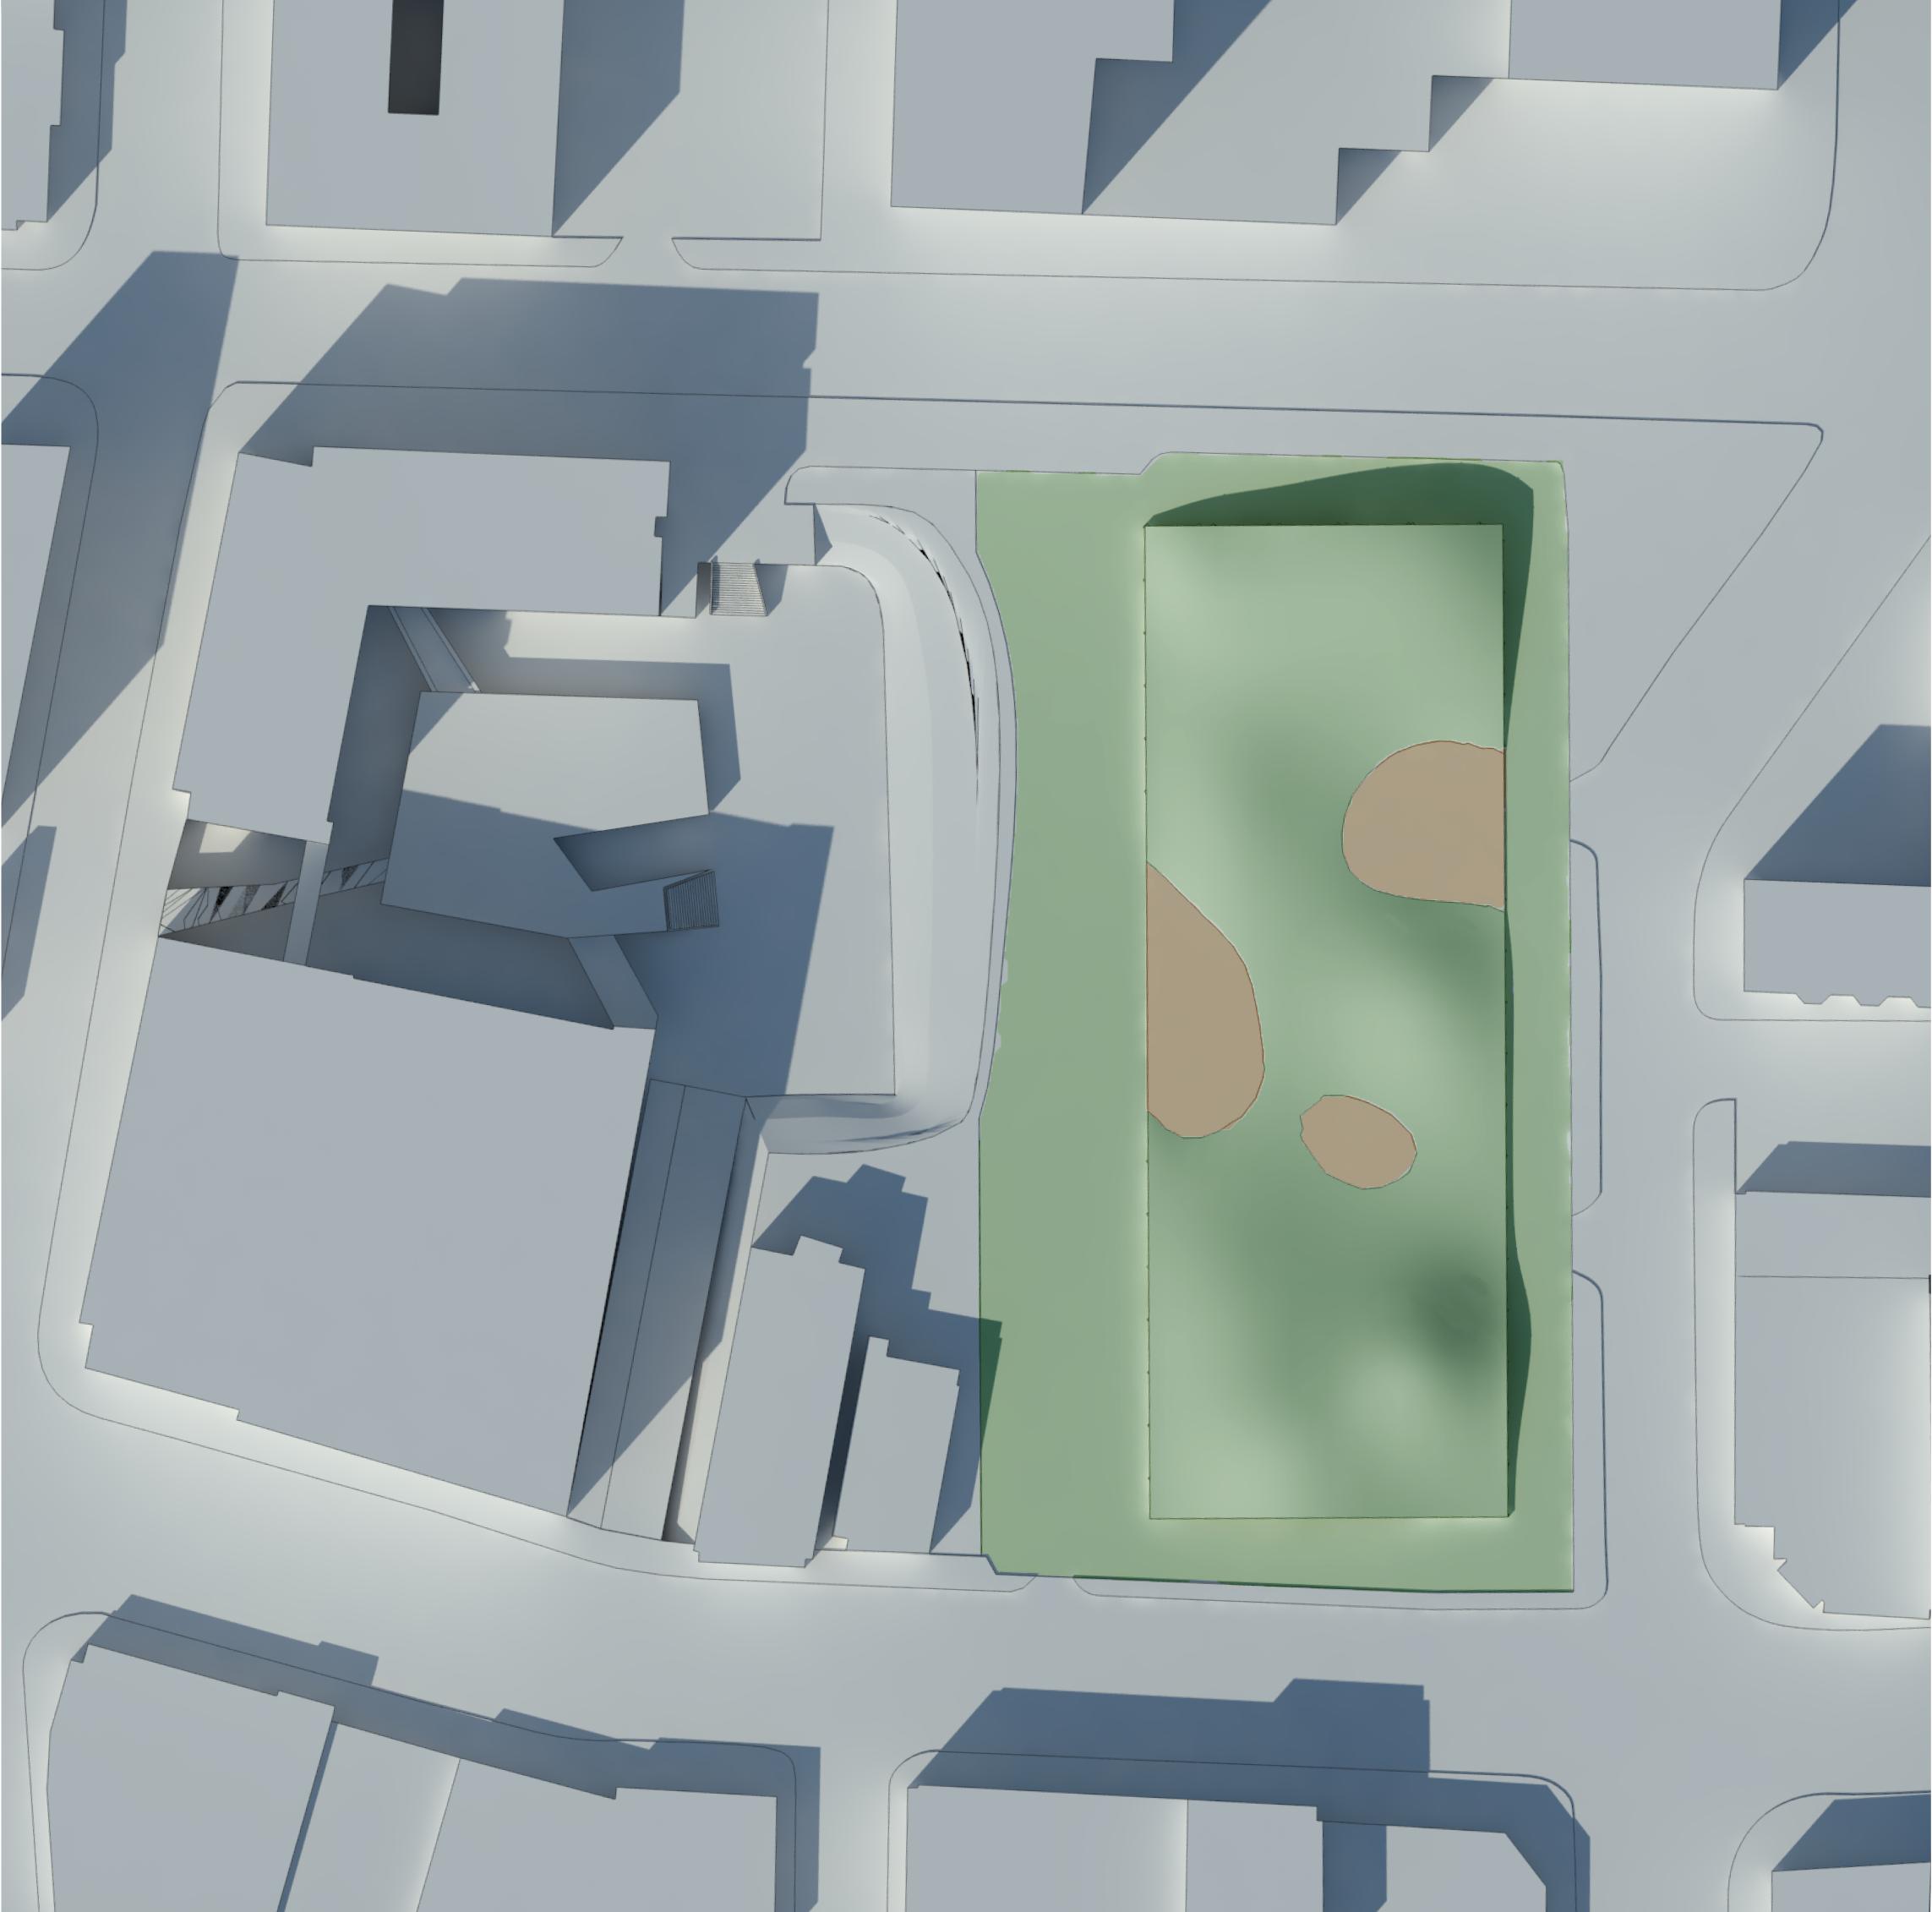
To create a focal point and an anomaly in the city which gives visitors an experience where they feel as though they have been transported to another area, we have chosen to go underground.
Doing this enables us to emphasize the uniqueness of Nintendo within a bustling city center of diverse architecture.

Site in consideration
Current Building Heights
If the site was built to 20+ stories
CONCEPTUAL|Massing
Intent to go Underground
Current
Projected
The site is in a unique part of the city where its surrounding five by five block radius is low rise buildings while past that radius buildings go up to being 20+ stories tall. The site is in somewhat of a bowl in the city. With the upcoming high-rise development this situation is going to be accentuated.
HARDI SHAH
heights of buildings around the site
10 stories 20 stories 20 stories 18 stories 20 stories 18 stories
heights of buildings around the site
Scenario 1: Scenario 2: If the site was built to -5 stories
PUBLIC PRIVATE
MATT SHAFRAN
and square- footage
Lobby Cafe Exhibit/Museum Retail Auditorium Auditorium Lobby Control Rooms Stage Bathrooms Public Product Testing Outdoor Garden TOTAL PUBLIC 500 sqft 500 sq ft 5,000 sq ft 2,000 sq ft 3,000 sq ft 500 sq ft 500 sq ft 1,000 sq ft 1,600 sq ft (4x400) 1,000 sq ft 3,000 sq ft 18,600 sq ft 2,000 sqft 2,000 sq ft 500 sq ft 2,500 sq ft 1,200 sq ft (2x600) 3,000 sq ft 1,000 sq ft 1,000 sq ft 13,200 sq ft Offices Servers/Mechanical Private Product Testing Labs
Product Testing Offices Conference Rooms Staff Residences Staff Lounge Cafeteria TOTAL PRIVATE
BUILDING 31,800 sq ft Rooms Square Footage Rooms Square Footage
Program
SCHEMATIC|Program
“Caves”,
TOTAL
HARDI SHAH Public, Private, and Circulation
Lobby Public Aspect of Program Private Elements of Program Circulation Cafe BR Exhibit/ Museum Offices Product Testing Stage Cafeteria Staff Lounge Product Testing Offices “The Caves” Auditorium Staff Residences Retail Lobby Ctrl Rooms Product Testing Conf. Room Conf. Room Storage Lobby Cafe BR Exhibit/ Museum Offices Product Testing Stage Cafeteria Staff Lounge Product Testing Offices “The Caves” Auditorium Staff Residences Retail Lobby Ctrl Rooms Product Testing Conf. Room Conf. Room Storage Public Aspect of Program Private Elements of Program Circulation Auditorium Ctrl Rooms Lobby Cafe BR Exhibit/ Museum Offices Product Testing Stage Cafeteria Staff Lounge Product Testing Offices “The Caves” Auditorium Retail Lobby Ctrl Rooms Product Testing Conf. Room Conf. Room Storage
SCHEMATIC|Program Adjacency
HARDI SHAH Lobby Light Requirements per Space Min Max Cafe BR Exhibit/ Museum Offices Product Testing Stage Cafeteria Staff Lounge Product Testing Offices “The Caves” Auditorium Staff Residences Retail Lobby Ctrl Rooms Product Testing Conf. Room Conf. Room Storage Lobby Cafe BR Exhibit/ Museum Offices Product Testing Stage Cafeteria Staff Lounge Product Testing Offices “The Caves” Auditorium Staff Residences Retail Lobby Ctrl Rooms Product Testing Conf. Room Conf. Room Storage Light Requirements per Program SCHEMATIC|Program Spatial Qualities Light Requirements per Space Min Max Stage Auditorium Ctrl Rooms
INITIAL FORM ORGANIZATION & DEVELOPMENT
From the initial strategy of dividing the site into a workable rectilinear grid, the spatial development took a less rigid form eliminating corners. The section development was based on the type of program, public/ private, number of people in the space, and lighting requirements derived from concept models.
Building Name: Location: Client: Architect:
Building Footprint:
Total Area:
Building Cost:
Groundbreaking:
Completion:
Employees in Factory: Program: Parking:
Total Complex Cost:
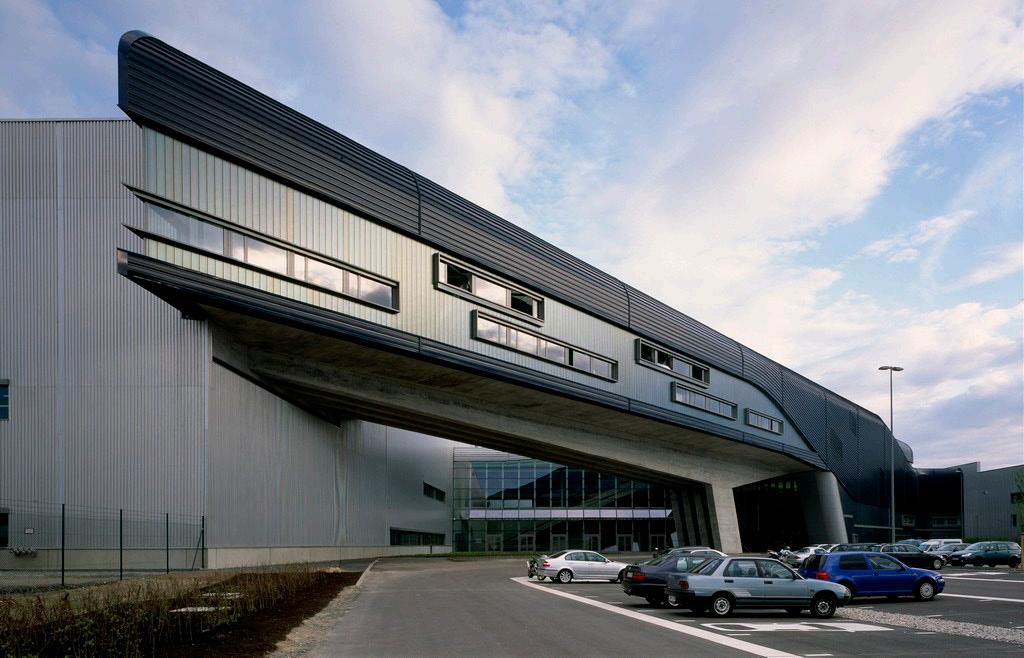
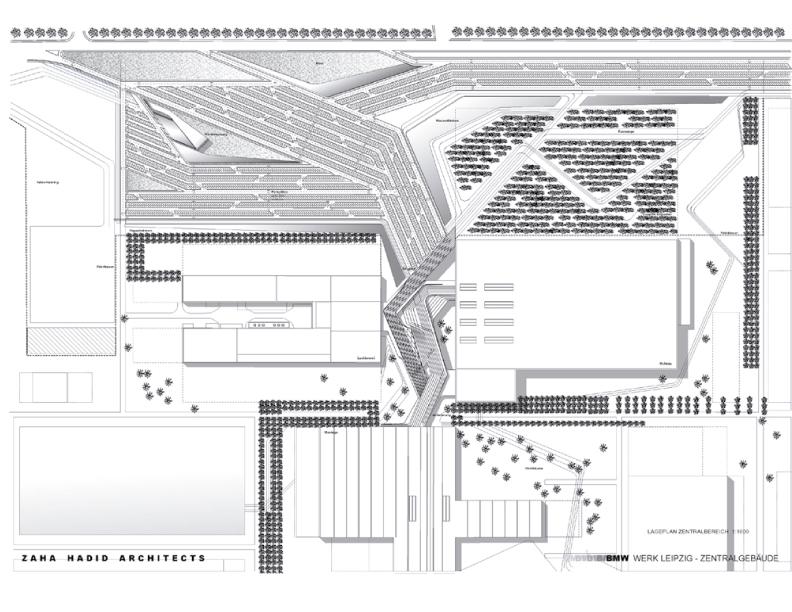
BMW Central Building
Leipzig, Germany
BMW AG, Munich, Germany
Zaha Hadid
250,000 square feet (23,000 m2)
270,000 square feet (25,000 m2)
$60 million
March 2003
May 2005
5,500
Control Functions, Offices/Admin., Meeting rooms, Cafeteria, Public Relations
4,100 Spaces
$1.55 Billion
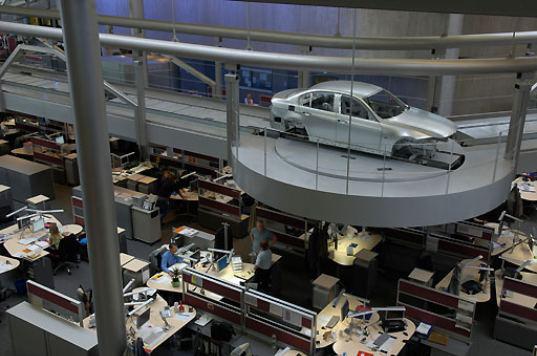
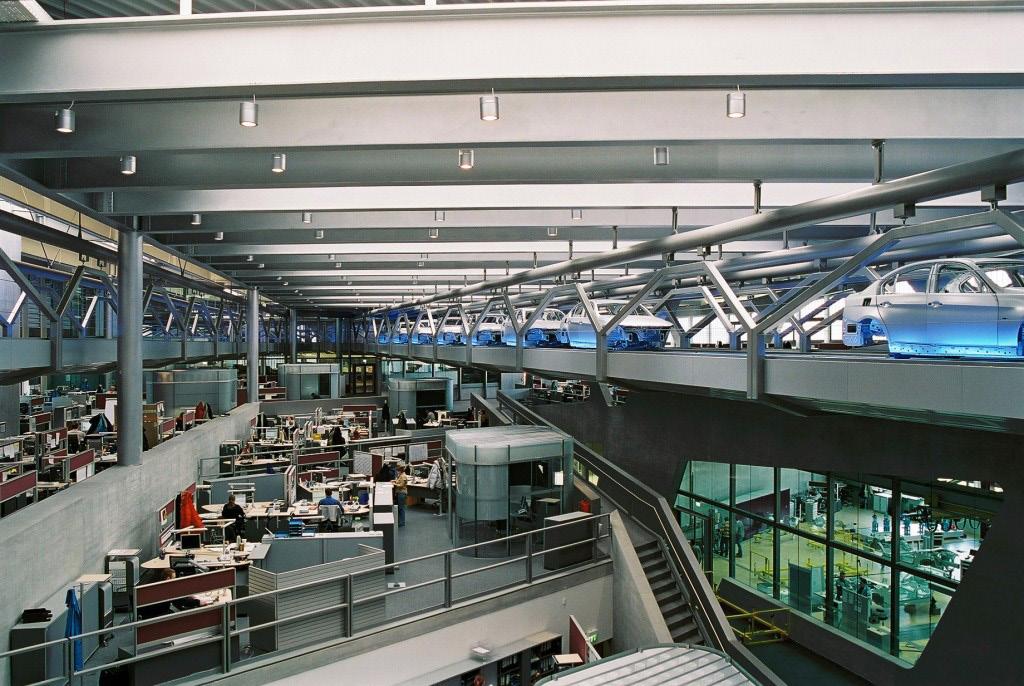
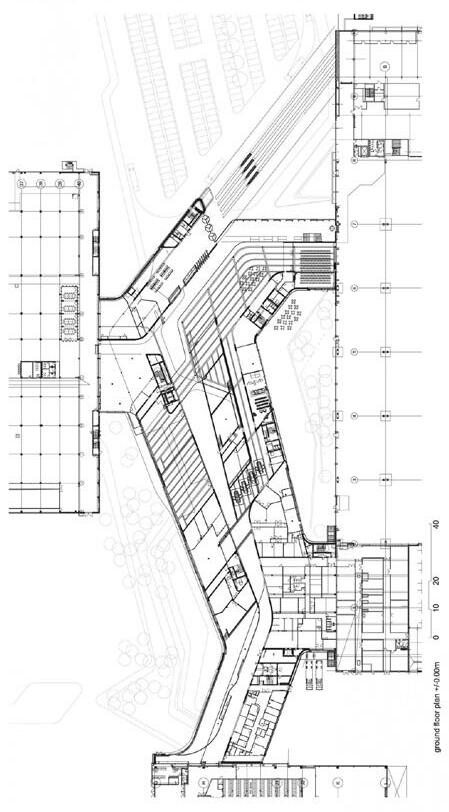
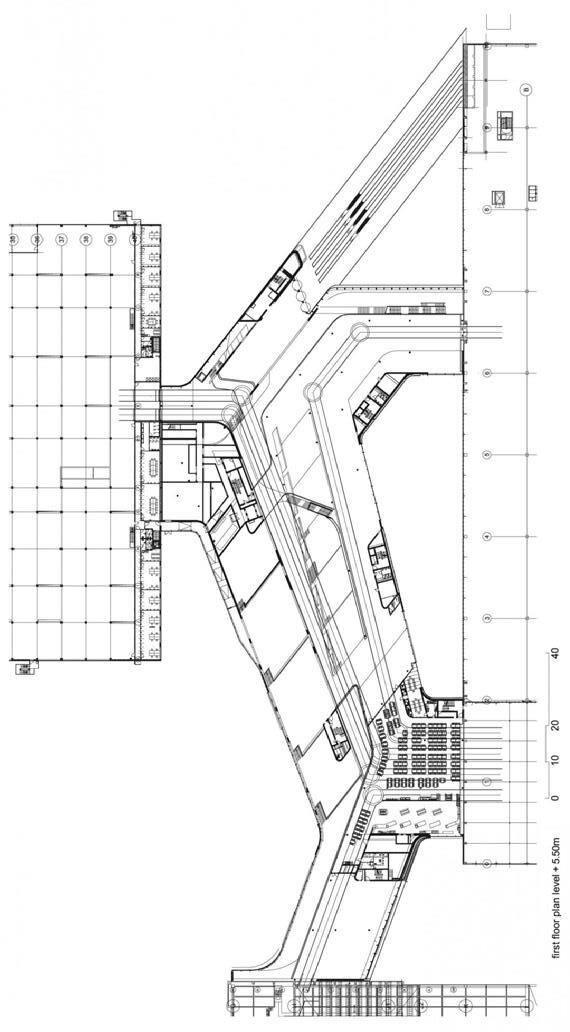
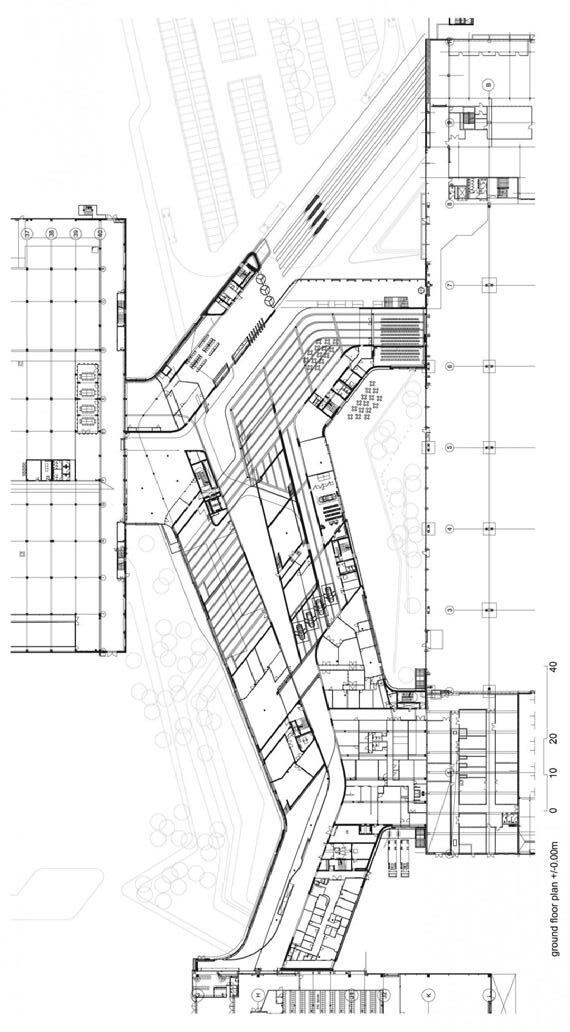
Hadid’s BMW Central Building, which was completed in 2005, connects three separate production buildings on the German car brand’s manufacturing complex in Leipzig. The building hosts offices and meeting rooms for the company’s design, management and administrative staff, but also features a large elevated conveyor that moves hundreds of cars through the building every day from one production shed to another.
The integration of the production line with management and administrative facilities broke down barriers between blue- and white-collar workers.
The building acts as the main nerve center of the plant, joining together the three main production facilities. Cars move overhead, through the main building, not only above busier visitor’s heads, but also past the desks of managers, designers and specialists. The open office space designs date back to the feel of the American 1970s. It has a positive influence on workflow, teamwork and an open exchange of ideas. Therefore the building embodies what has been called a “communication knot – funneling all movement around the manufacturing complex through a space that transcends conventional white collar/blue collar special divisions.
The movement of the assembly line broke down hierarchies. It totally blurred the boundary between making, management and designing. It was a very radical piece of design but it was also a very radical piece of thinking.
CASE STUDY|BMW Central Building
Zaha Hadid, Leipzig, Germany
HARDI SHAH
”doingsomethingthatgoesbeyondthepragmatic”
It is the amalgamation of innovation, function and comfort.


HARDI SHAH
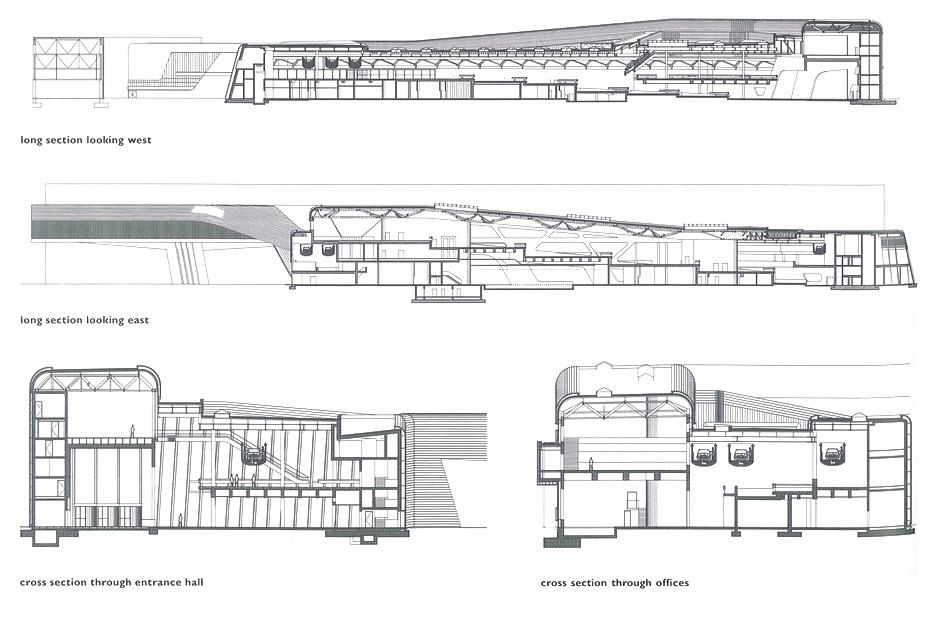
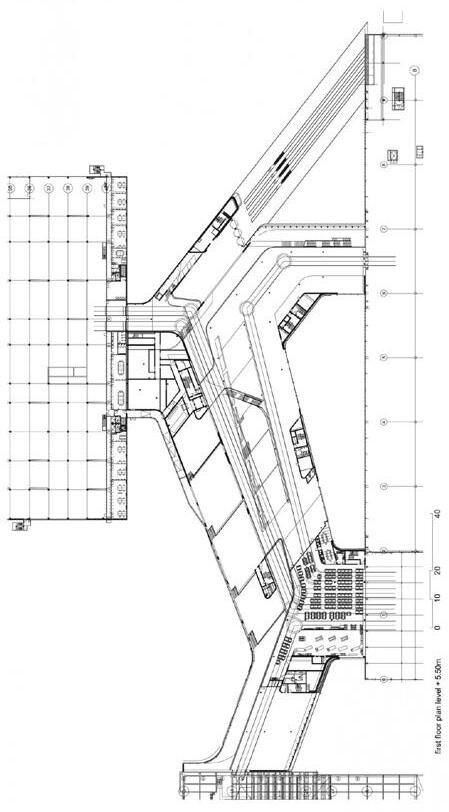
First Floor Vehicle Circulation Employee Circulation Egress Circulation Employee Circulation Ground Floor Plan Second Floor Plan Egress Circulation
Central Building
White Collar Blue Collar
CASE STUDY|BMW
CASE STUDY|BMW Central Building
Zaha Hadid, Leipzig, Germany
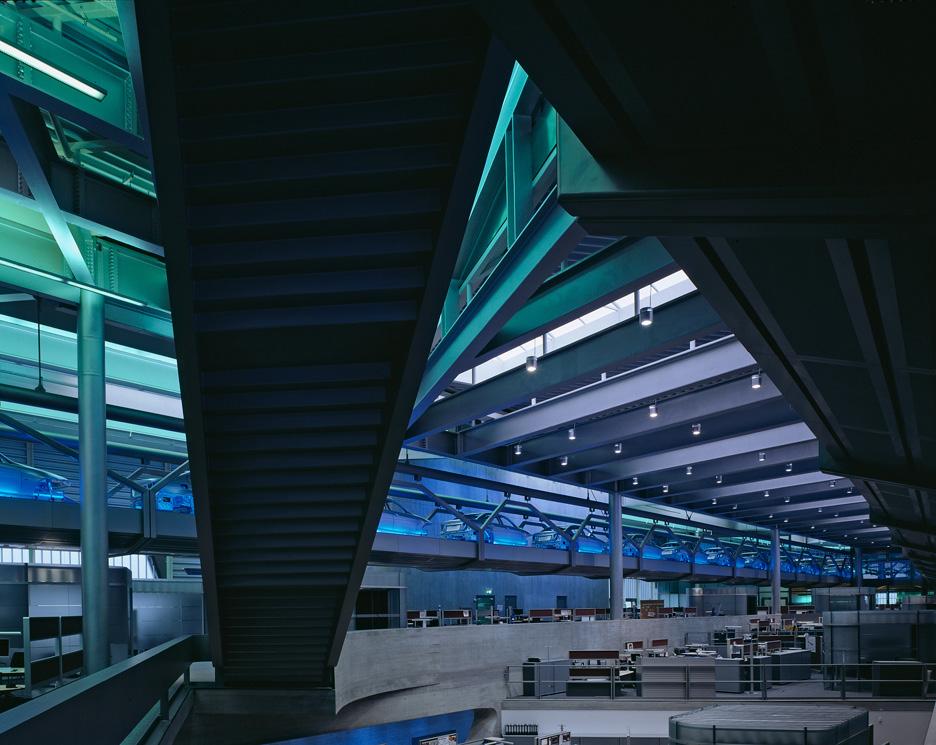
All of the load-bearing walls, floors, and office levels are made of cast-in-place concrete, while the roof structure is composed of structural steel beams and space frame construction. The facade is clad in simple materials of like corrugated metal, channel glass, and glass curtain walls.
HARDI SHAH
Complex space framing
Simple space framing
Structural steel framing of the roof
Bottom- heavy concrete pier design with Large and small scale steel framing for the roof and smaller interior spaces
Car Conveyor
Floor Levels in Axon
The heights of the wooden dowels represent the size of programmatic spaces. The ground plane becomes the datum line, which represents the distinction between Research & Recreational zones.
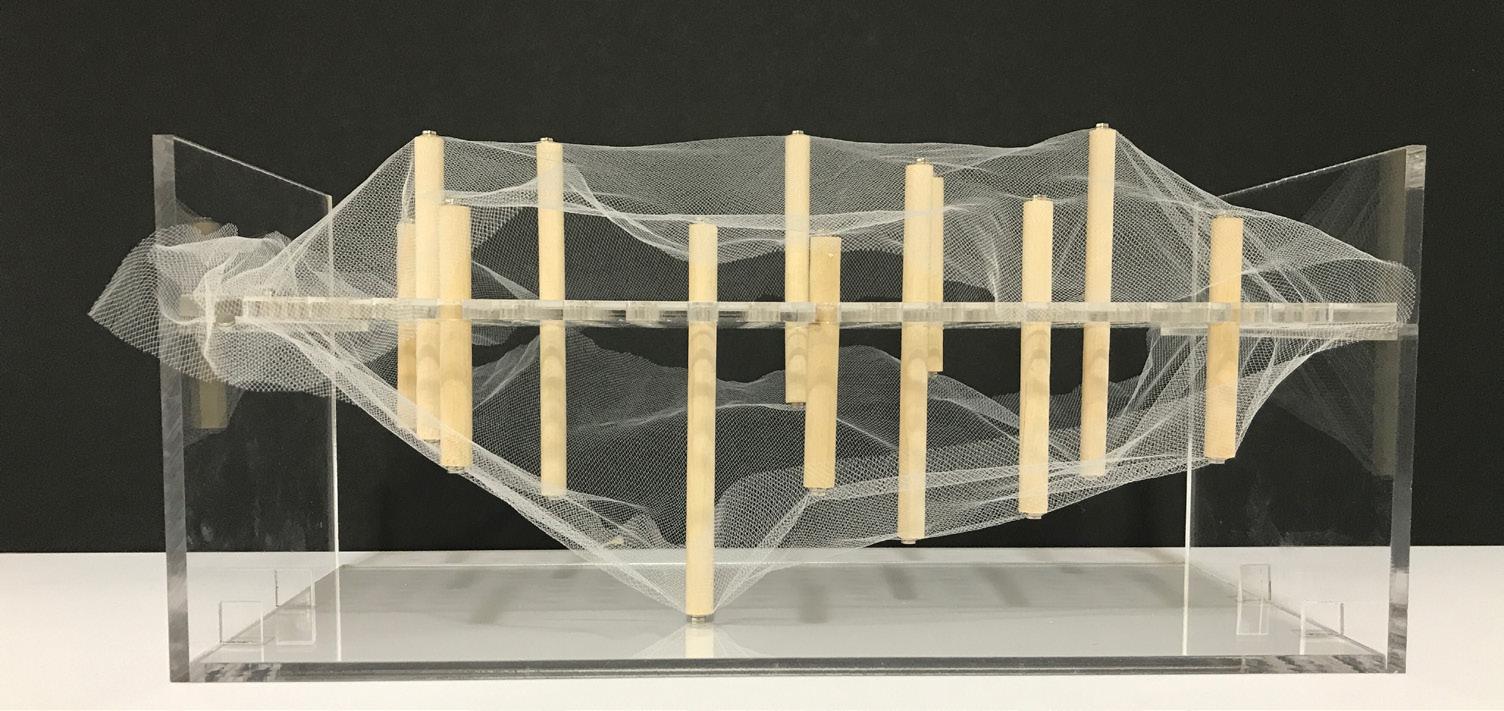
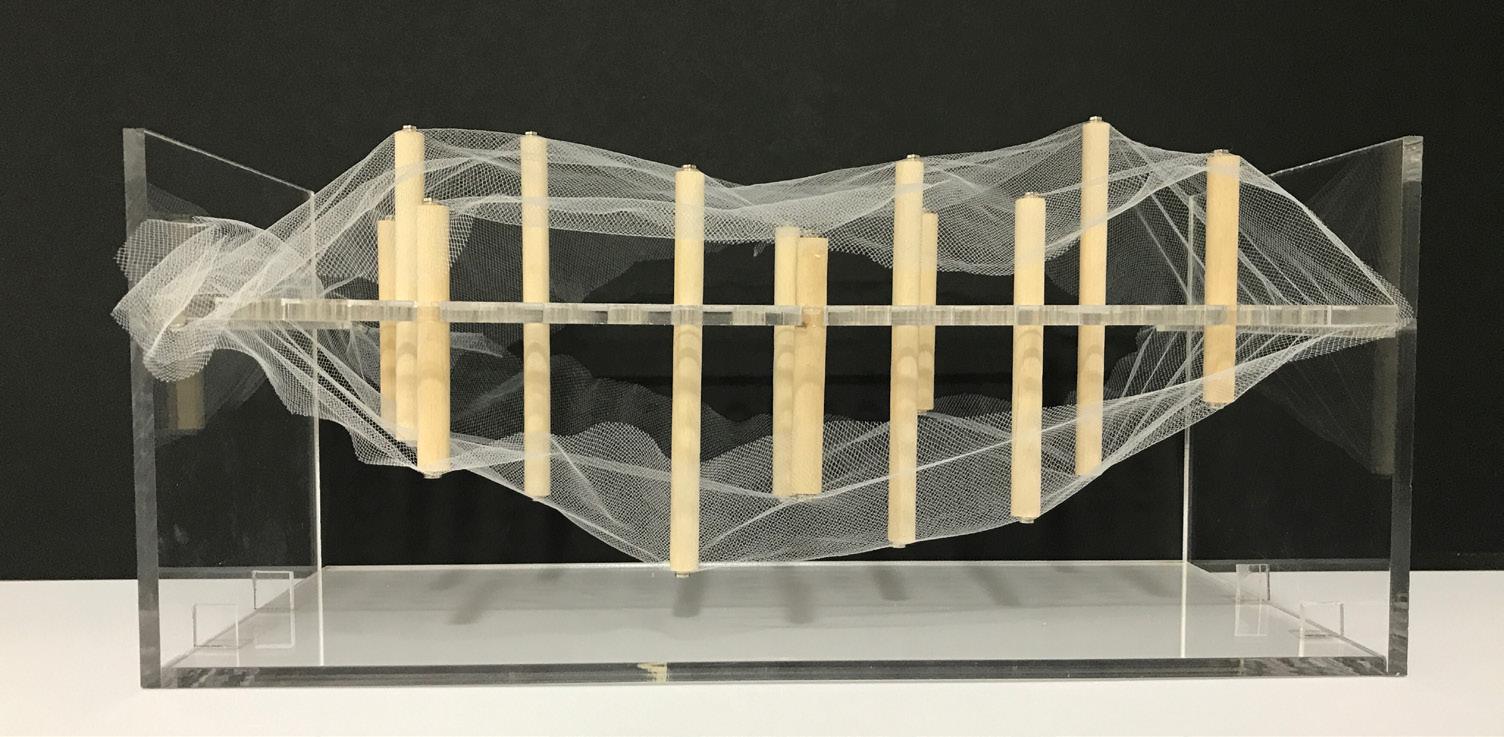
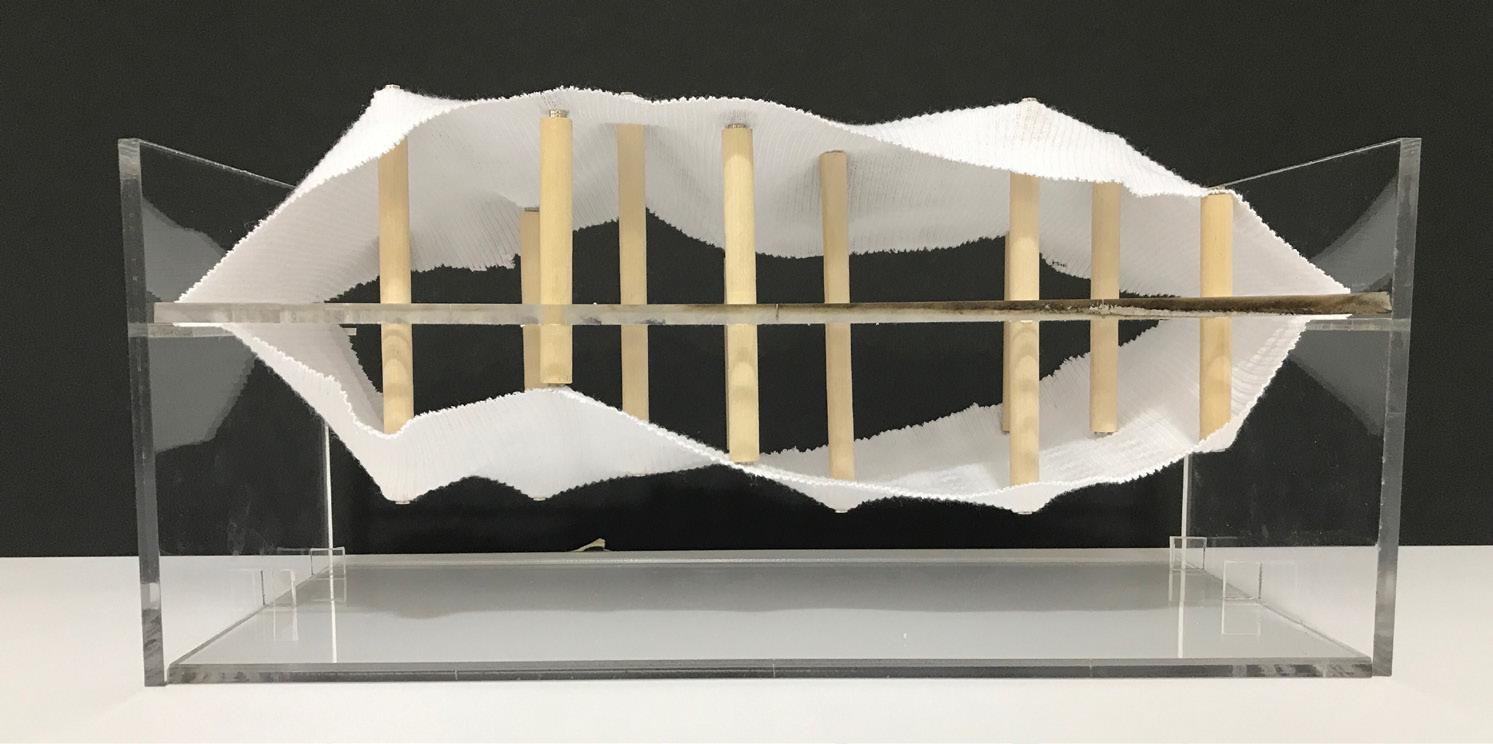
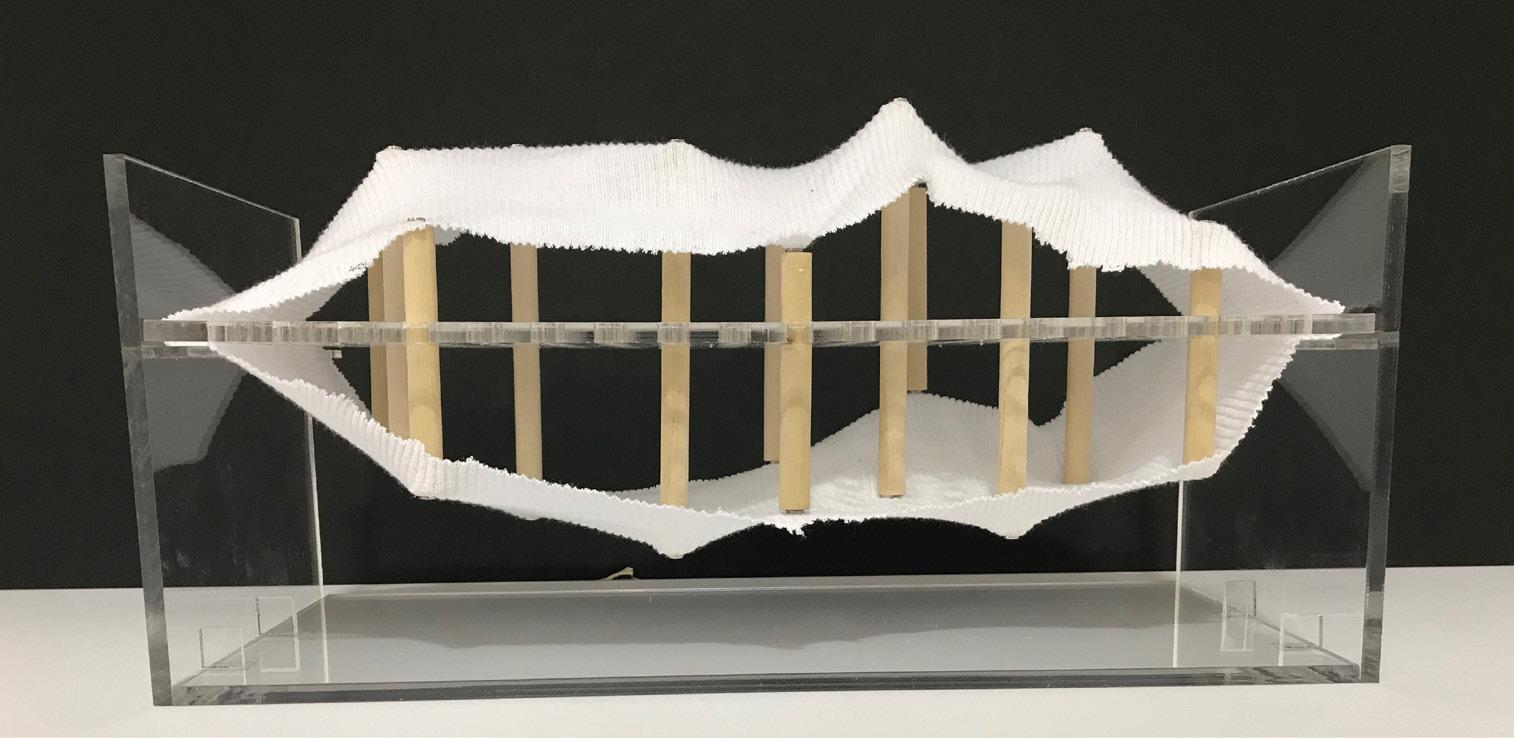
The result of this model created various options for program layout, sizes of spaces, and an organic circulation path above and below the datum line, and in between program.
Model Material 1| Ribbed fabric, creates loose shell-like form
Model Material 2 | “Tulle”, lightweight fiber netting, creates shell with transparent qualities
Model Material 3 | Nylon fabric, creates tight, more defined form
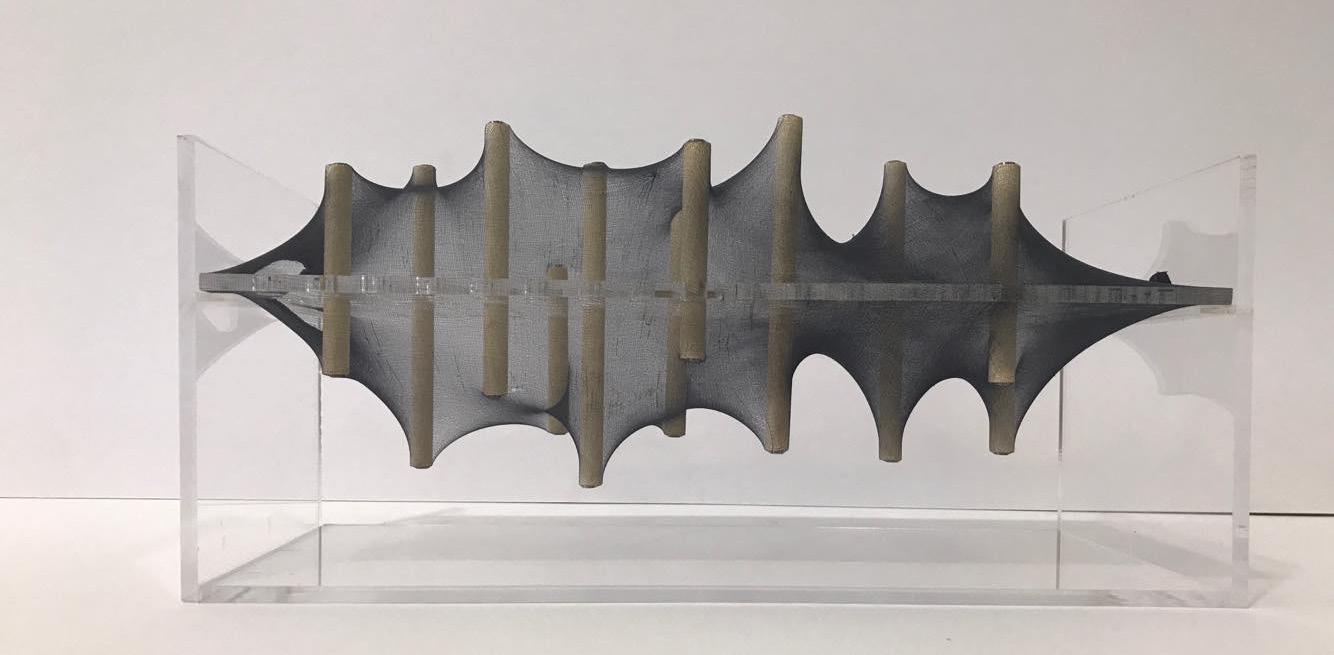
Program, Form Finding CONCEPTUAL|Study Model
Experimenting with materials, heights, & spacing to relate program to form and create a distinction between Research and Recreation
MATT SHAFRAN
PL AY LEAR N SHOP PRESEN T INVEN T
Recreation (Real)
Circulation
Ground Plane Research (Virtual)
CONCEPTUAL|Study Model
Program and square- footage
MATT SHAFRAN
Model Material 1
Model Material 2
Model Material 3
1
Parking placed
25’ Park Perimeter
The main circulation corridor runs from Toy District to DTLA.
2
Toy District
This is the direction in which the program sequence is laid out. The commercial, retail aspect of the program faces the traffic heavy DTLA while the history and presentation of the Nintendo products is oriented towards Toy District.
3
Underground Parking
SCHEMATIC|Intial Plan Development
Public, Private, and Circulation
5 Take on the Go
4 Create Your Own
3 Experience the Difference
2 Present the New
1 Learn the History
HARDI SHAH
DTLA
Pull center away from street edge by creating park buffer
underground to maximize area and reduce blacktop surfaces
Gray represents building footprint; dashed line is the roof line
HARDI SHAH Program Organization, Circulation, Public/Private
Intial Plan Development Retail Caves Viewing Platform/ Walkway Restrooms Storage Marketing Offices Exhibition Lobby Cafe Auditorium Storage Control Room Cafeteria Staff Lounge Private Product Testing Public Product Testing Restrooms Restrooms Offices Servers Conferesnce Rooms
5 Take on the Go 4 Create Your Own 1 Learn the History 2 Present the New 3 Experience the Difference
SCHEMATIC|
The R&D is divided into public and private categories along the axis of the central corridor.
Height of Roof above Program depends directly on the type of program, public/ private, number of people in the space, and lighting requirements

BEHIND THE SCENES TAKE ON THE GO
PRESENT THE NEW EXPERIENCE THE DIFFERENCE
CREATE YOUR OWN &


LEARN THE HISTORY
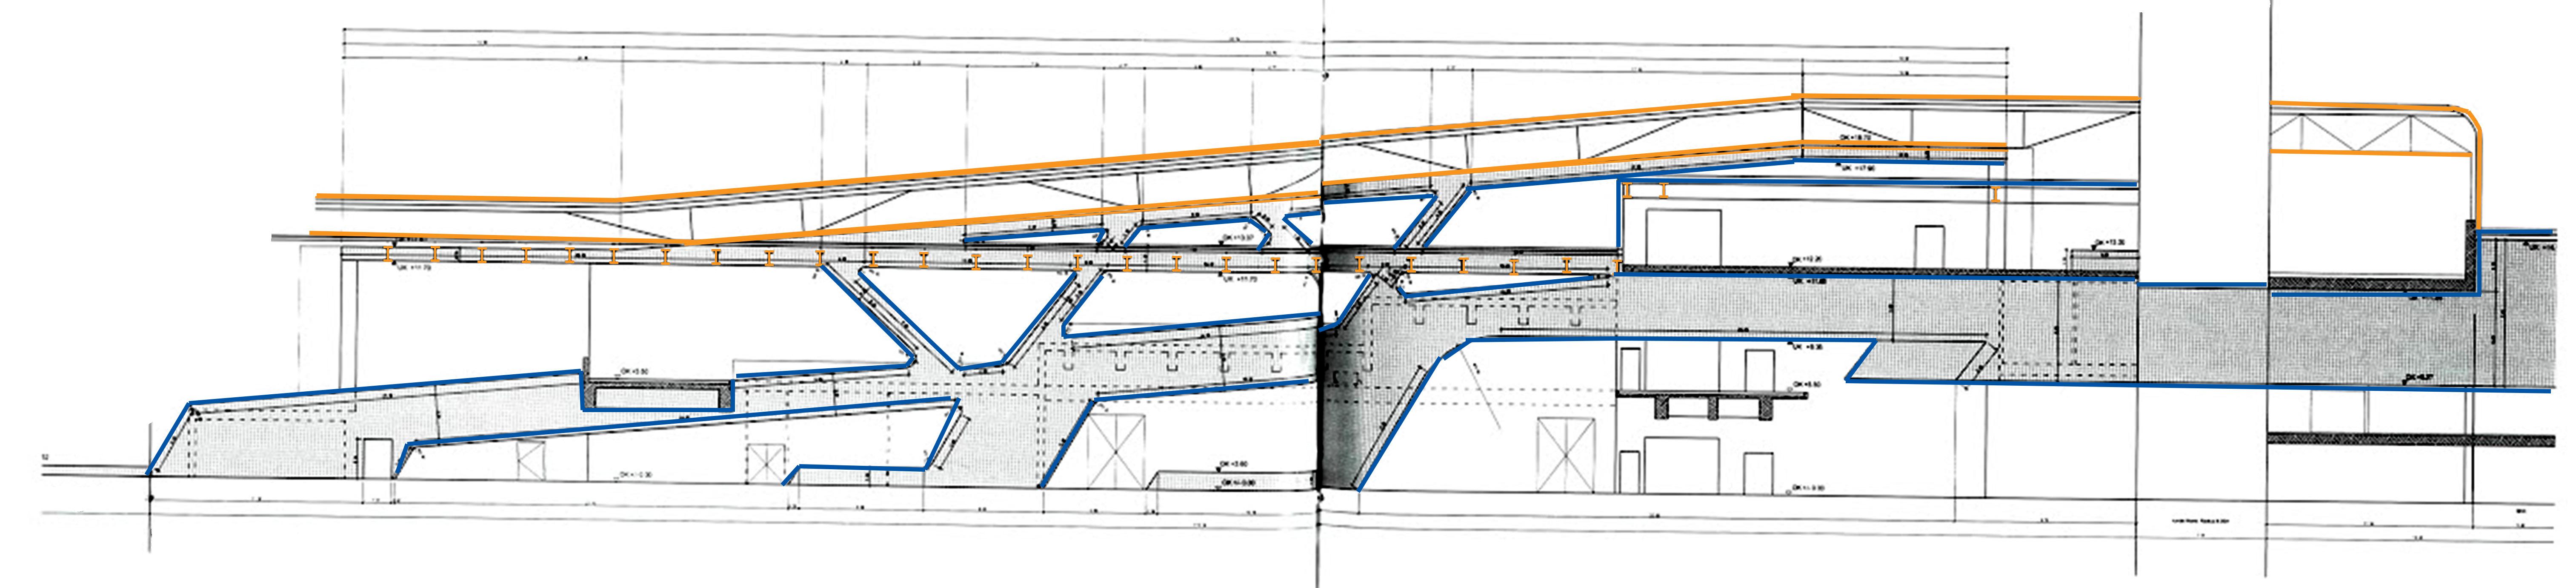
SCHEMATIC|Initial Section Development Material,
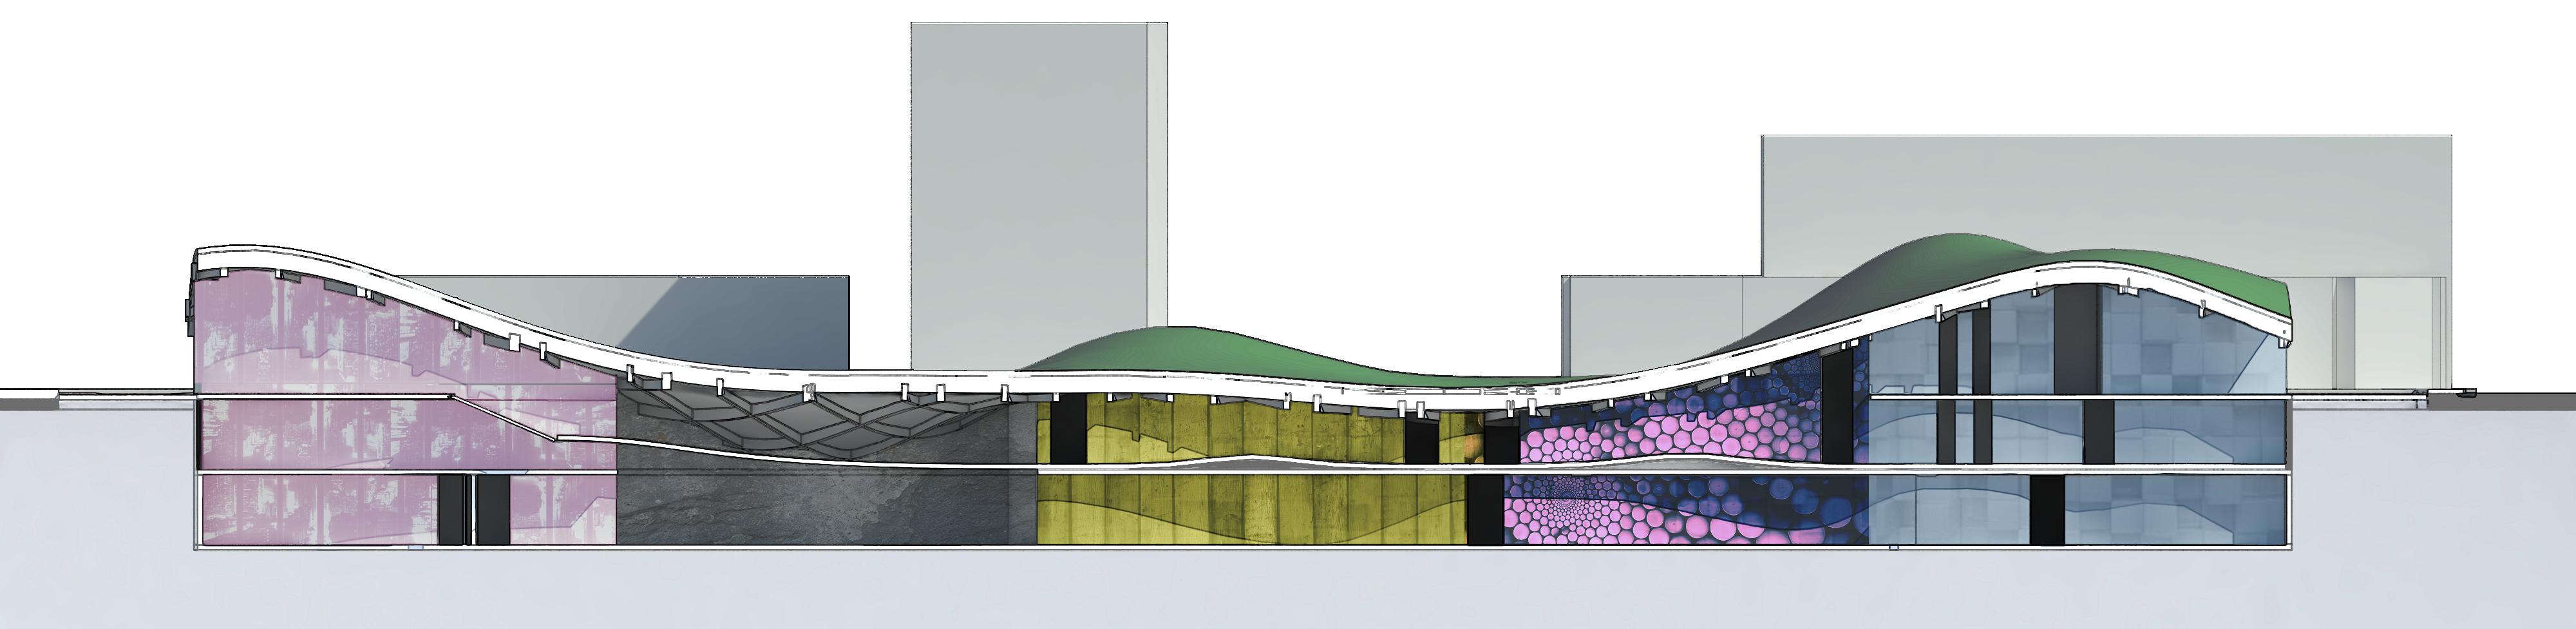
Program Experience
Each segment of the program corresponds to their respoctive colors based on Nintendo’s color scheme over the years. The transition through the circulation is framed in a finish which constantly changes materiality while retaining the same color. Nintendo’s iconic colors: yellow, red, and blue are incorporated throughout the winding circulation.

HARDI SHAH
Nintendo’s Current & Future Product Color Scheme
Nintendo’s Past Product Color Scheme
SCHEMATIC|Initial Form within Site
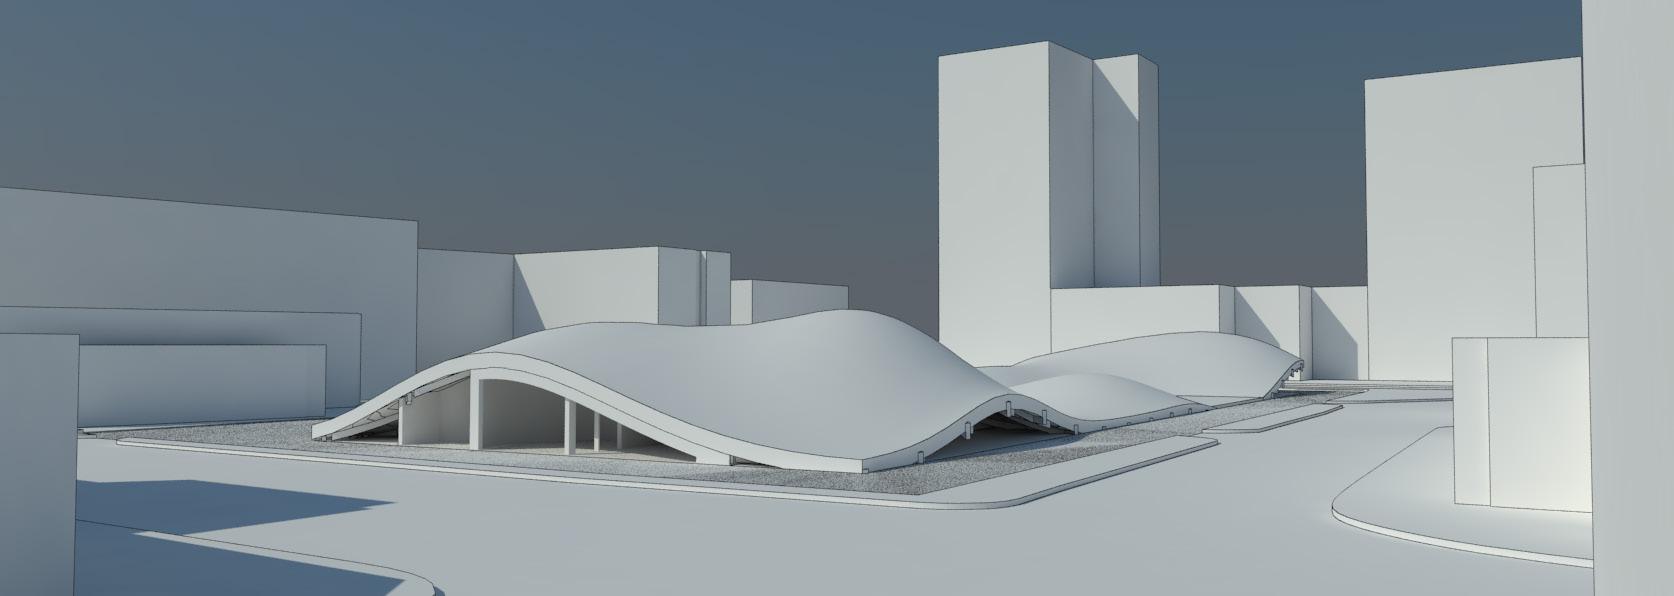
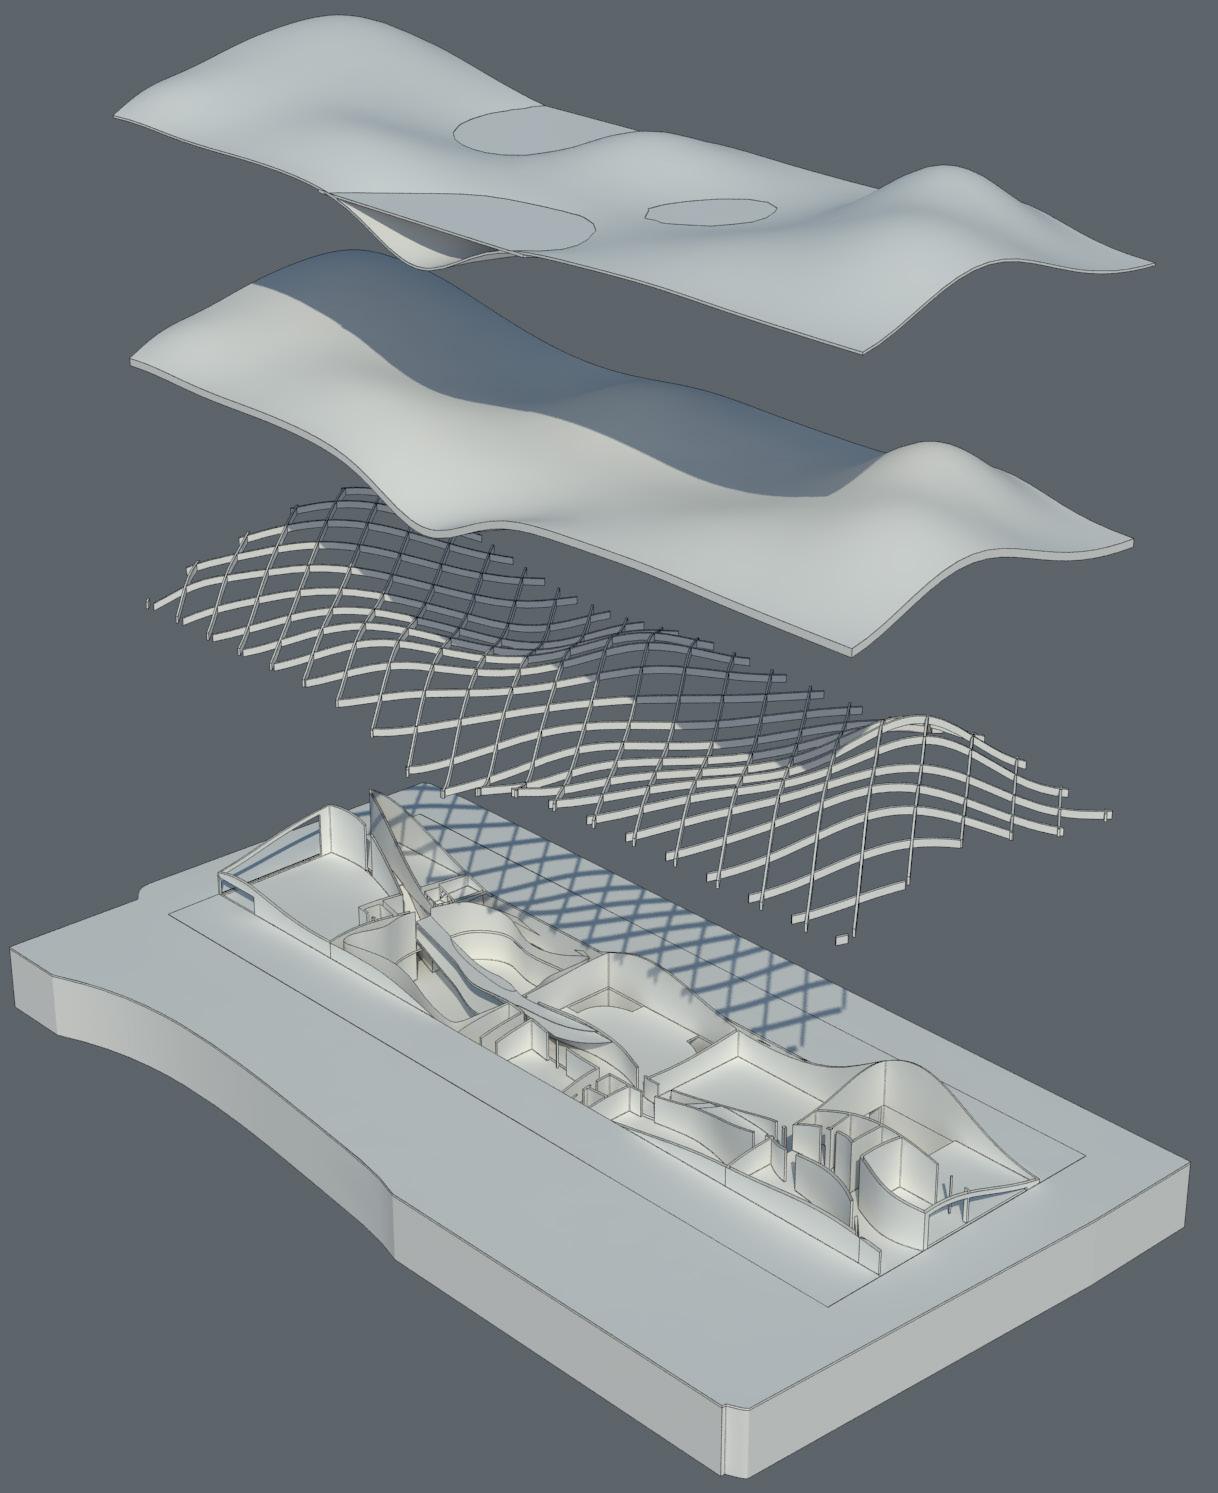
Site Context
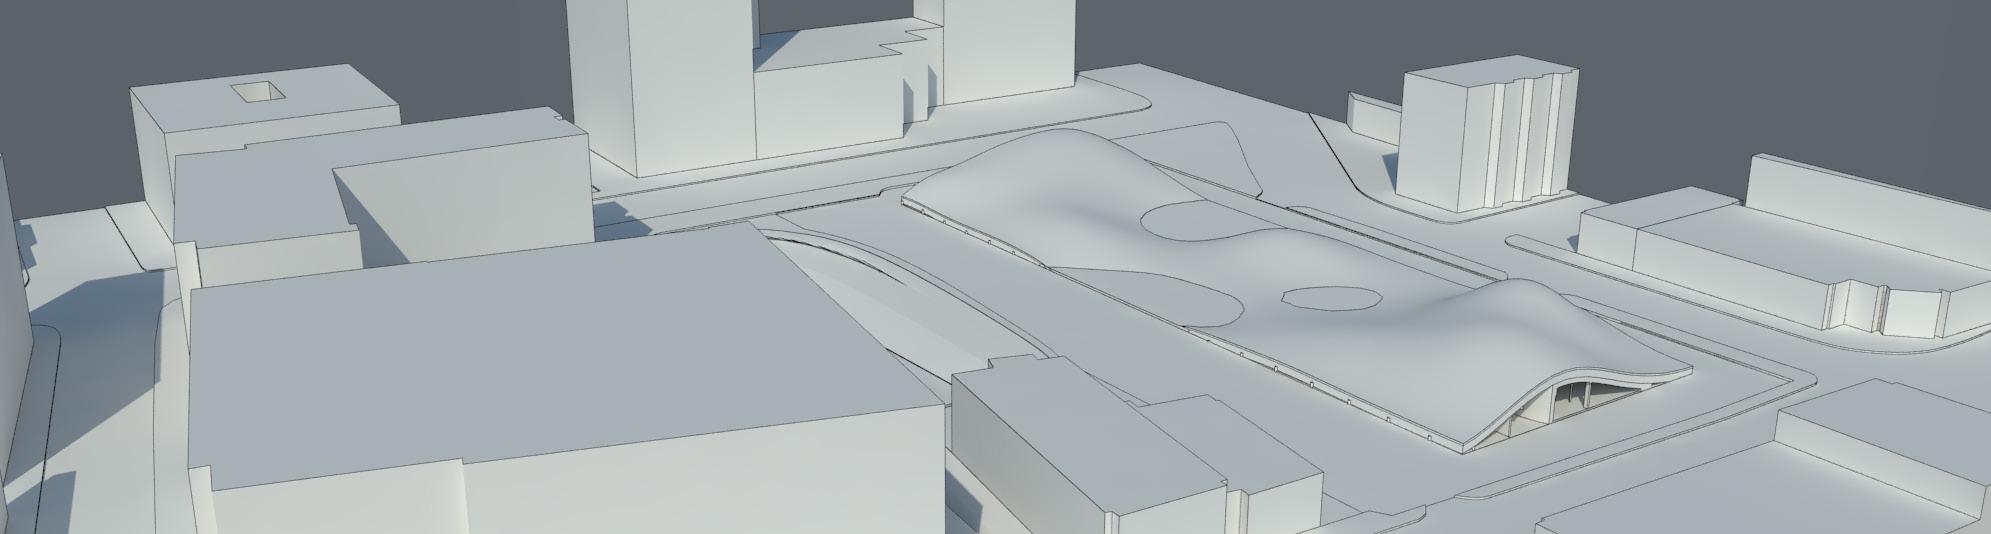
Green-scape lowering the building heat loads by decreasing blacktop and impermeable surfaces
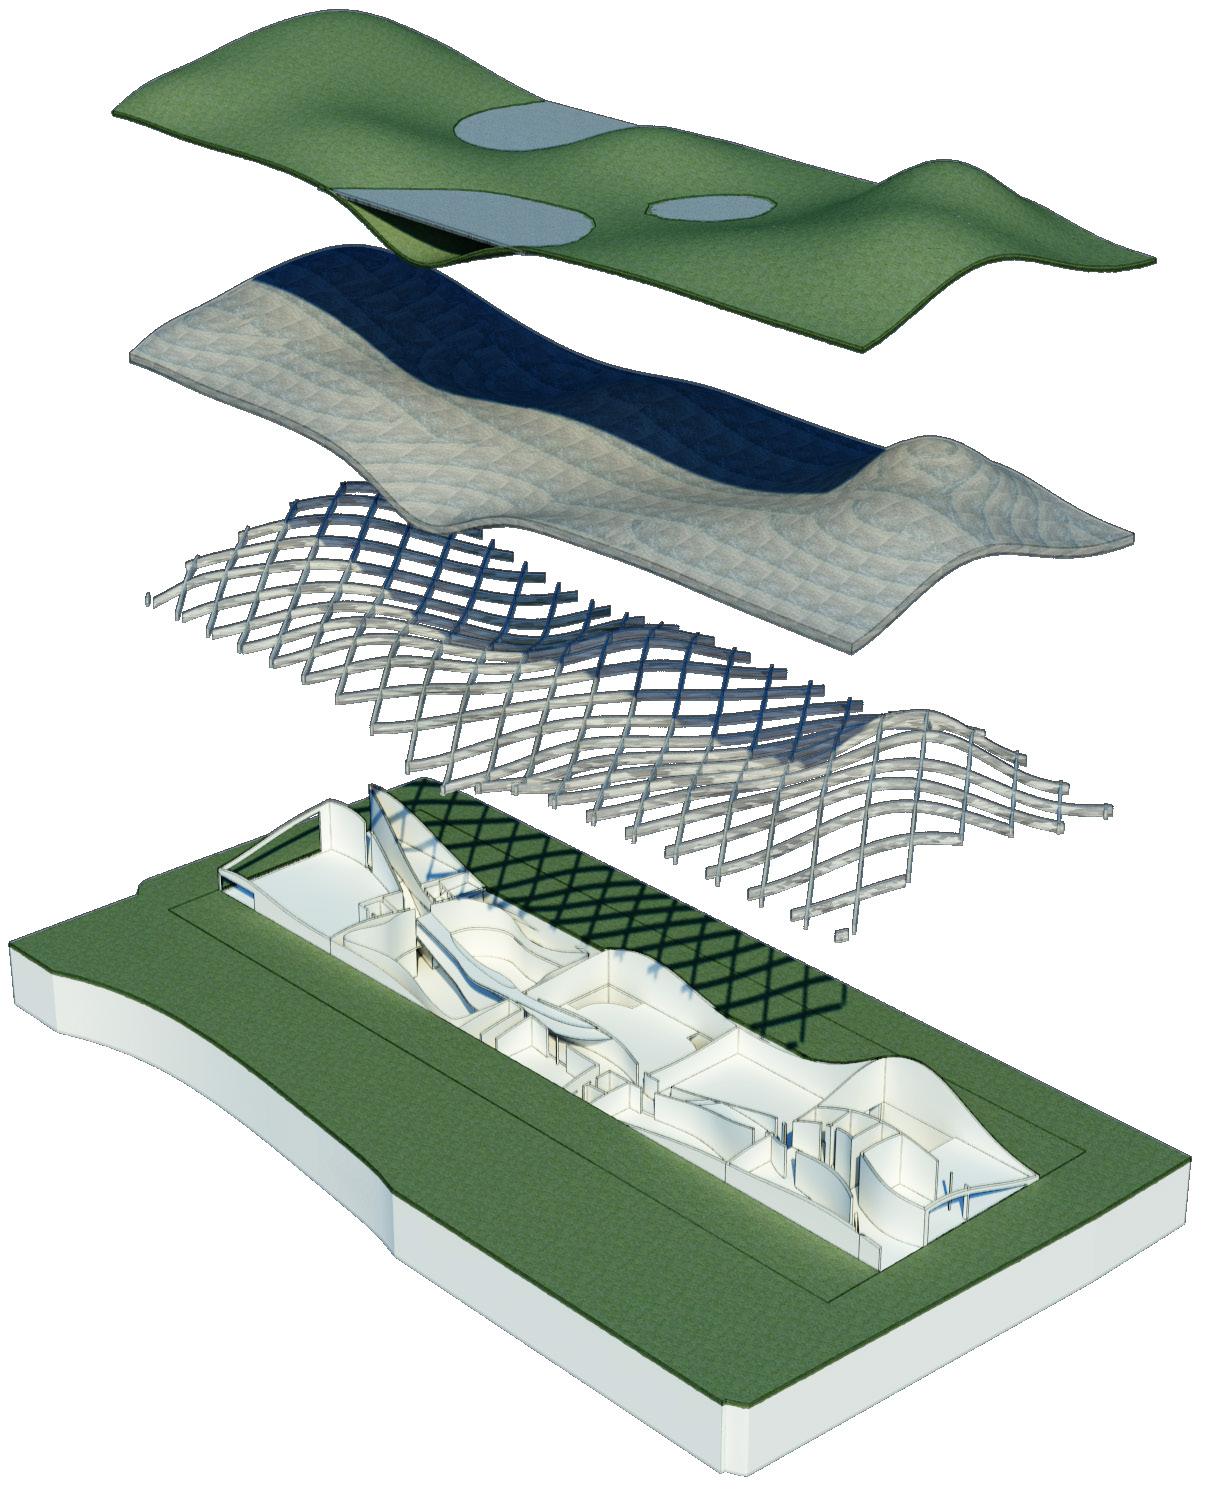
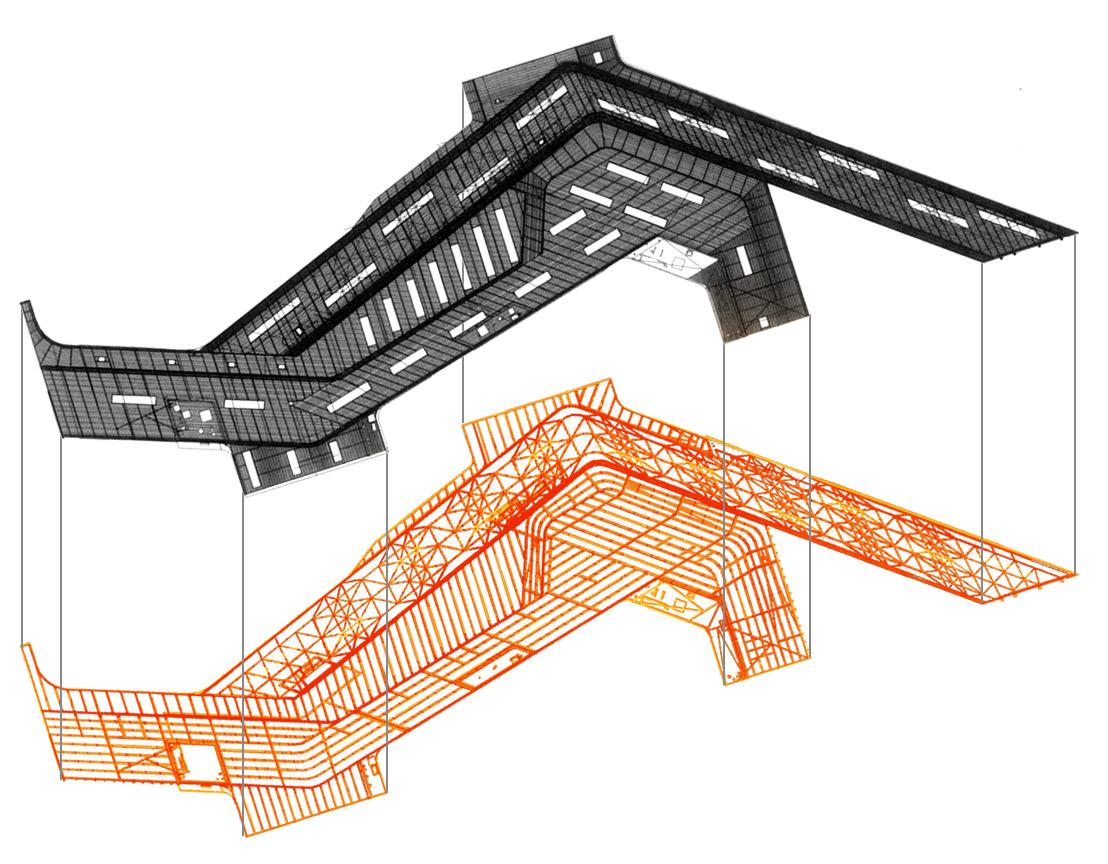
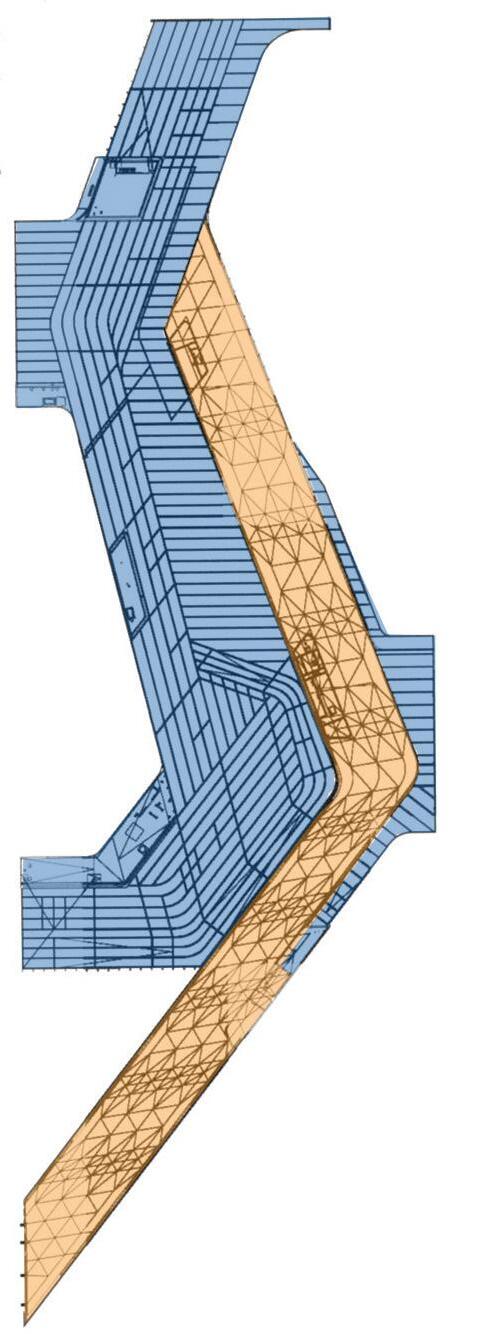
Concrete Deck needed to support the landscaping, live loads, and green roof above
Steel Lattice Roof Structure to provide flexibility and strength over the spans along the length of the site
The
Elevation heights
Min Max
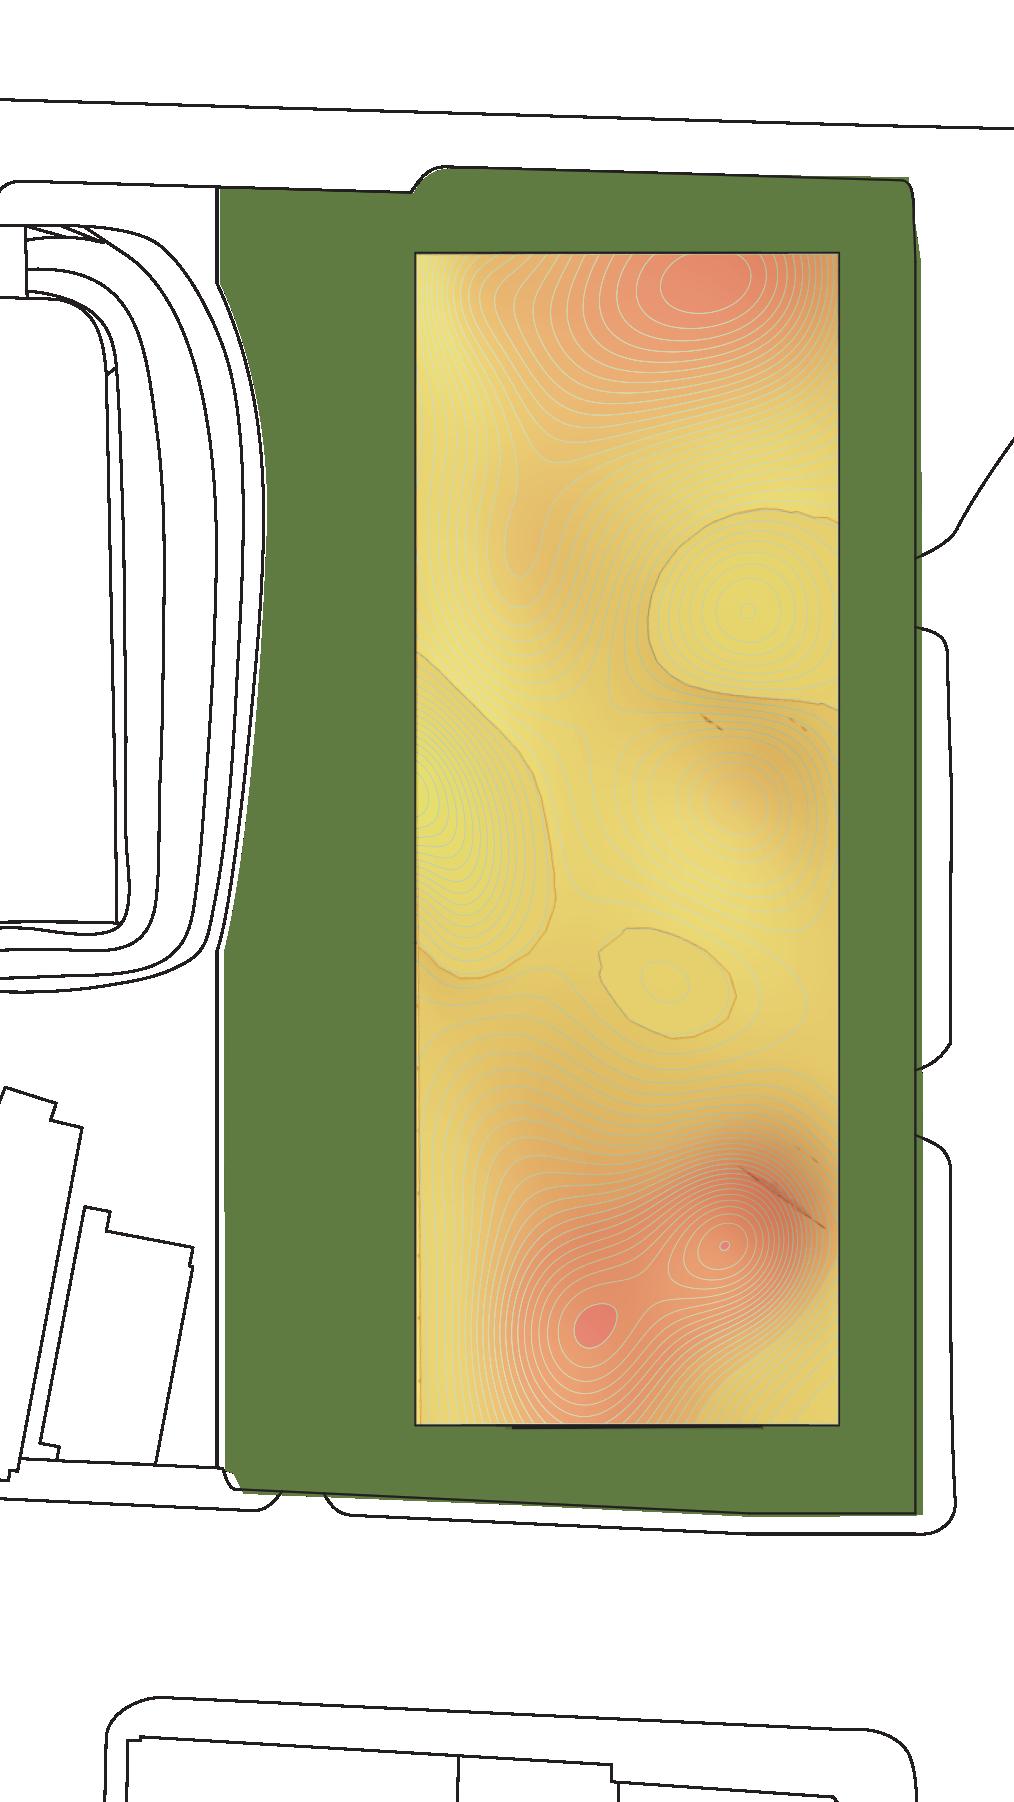
Each contour is 1’ apart
The free flowing nature of the roof allows for the heights of the spaces within to have different heights according to what type of program resides underneath.
SCHEMATIC|Intial Structural Development
HARDI SHAH
base of the R&D Center is built of concrete walls with a multi material circulation corridor
FINAL FORM ORGANIZATION & DEVELOPMENT:
From the initial strategy of dividing the site into a workable rectilinear grid, the spatial development took a less rigid form eliminating corners. The section developed further based on the changes made in the program and plan organization.
HARDI SHAH
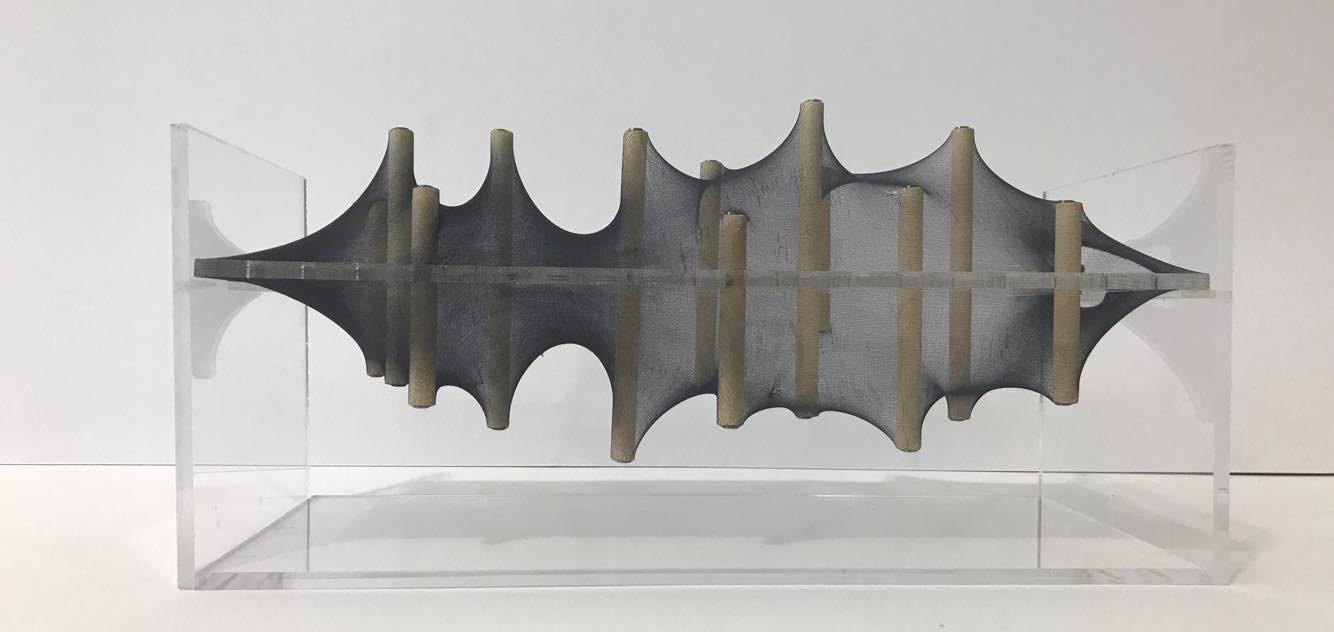
Height
Roof above Program
The heights of the wooden dowels represent the size of programmatic spaces. The ground plane becomes the datum line, which represents the distinction between Research & Recreational zones.
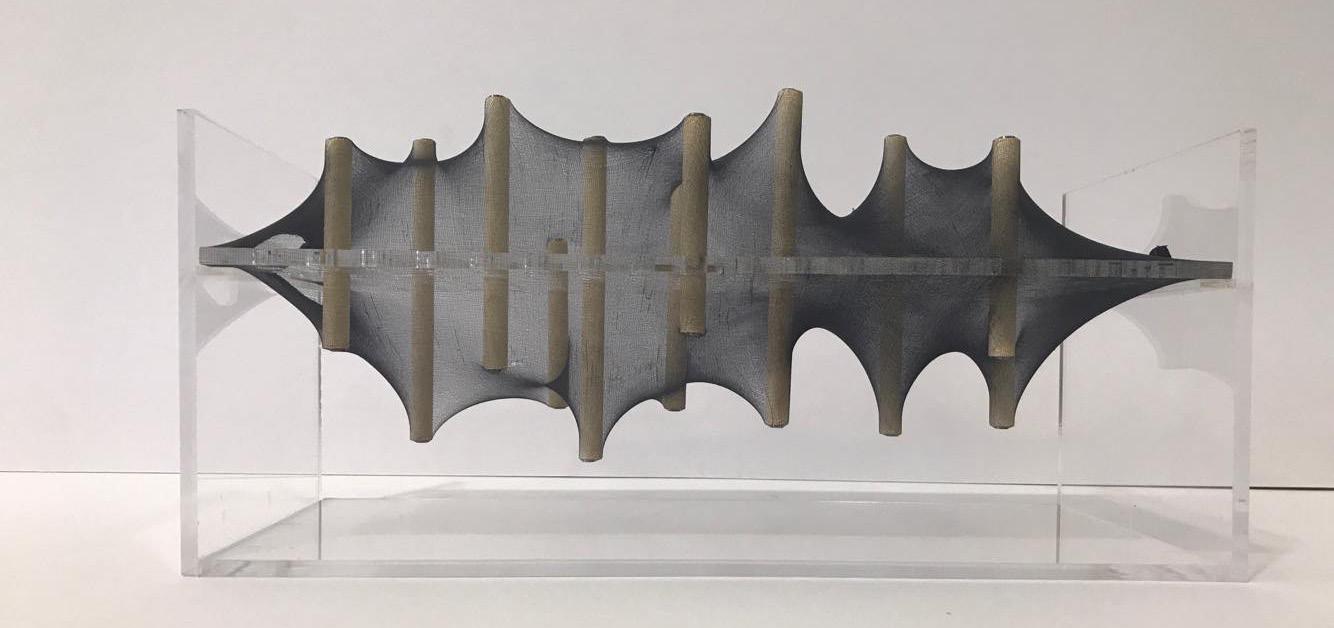
The result of this model created various options for program layout, sizes of spaces, and an organic circulation path above and below the datum line, and in between program.

SCHEMATIC | Form Finding
HARDI SHAH Culmination of Concept Model and Building Form
of
depends directly on the type of program, public/ private, number of people in the space, and lighting requirements
PL AY LEAR N SHOP PRESEN T INVEN T
Height of Roof above Program depends directly on the type of program, public/ private, number of people in the space, and lighting requirements
SCHEMATIC|Program to Roof Connection
Form Finding & Spatial Quality
HARDI SHAH Lobby Cafe BR Exhibit/ Museum Offices Product Testing Stage Cafeteria Staff Lounge Product Testing Offices “The Caves” Auditorium Staff Residences Retail Lobby Ctrl Rooms Product Testing Conf. Room Conf. Room Storage Lobby Public Aspect of Program Private Elements of Program Circulation Cafe BR Exhibit/ Museum Product Testing Stage Cafeteria Product Testing Offices “The Caves” Auditorium Retail Lobby Ctrl Rooms Product Testing Storage Lobby Cafe BR Exhibit/ Museum Offices Product Testing Stage Cafeteria Staff Lounge Product Testing Offices “The Caves” Auditorium Staff Residences Retail Lobby Ctrl Rooms Product Testing Conf. Room Conf. Room Storage Lobby Light Requirements per Space Min Max Exhibit/ Museum Product Testing Stage Cafeteria Product Testing Offices Auditorium Retail Lobby Ctrl Rooms Product Testing Storage
+
HARDI SHAH Lobby Cafe BR Exhibit/ Museum Offices Product Testing Stage Cafeteria Staff Lounge Product Testing Offices “The Caves” Auditorium Retail Lobby Ctrl Rooms Product Testing Conf. Room Conf. Room Storage Lobby Cafe BR Exhibit/ Museum Offices Product Testing Stage Cafeteria Staff Lounge Product Testing Offices “The Caves” Auditorium Retail Lobby Ctrl Rooms Product Testing Conf. Room Conf. Room Storage
AUDITORIUM
ENTRANCE ENTRANCE & RETAIL EXHIBITION GAME TESTING
RESEARCH CAVES
PARTII DIAGRAM


HARDI SHAH REAL REAL REAL VIRTUAL
IMMERSIVE PHYSICAL VIRTUAL REAL INACTIVE PLAY TRADITIONAL VIDEO GAMES PHYSICAL, OUTDOOR PLAY INTERACTIVE PLAY datum IMMERSIVE VIRTUAL INACTIVE PLAY TRADITIONAL VIDEO GAMES PHYSICAL REAL PHYSICAL, OUTDOOR PLAY INTERACTIVE PLAY
VIRTUAL
1 2 3
6 5 4
DATUM IS FLUXUATED ACCORDING TO PROGRAM AND SPACE
A WALKWAY IS IMPOSED ON THE DRAMATIC AREAS OF THE LANDSCAPE TO ENSURE ACCESSIBILITY
THE RESULT IS A PHYSICAL LANDSCAPE WITH VISUAL AND PHYSICAL CONNECTIONS TO THE IMMERSIVE, DIGITAL INTERIOR
HARDI SHAH
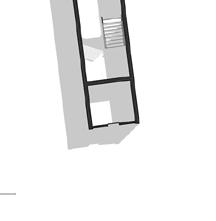
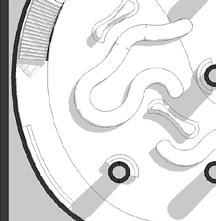
Plan Partii:


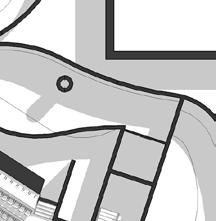
Curved walls within the interior serve to disorient and envelope the individual within the environment created underground with the skylights and clerestories being glimpses into the outside to reorient yourself within the site.
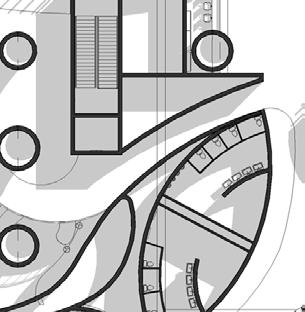


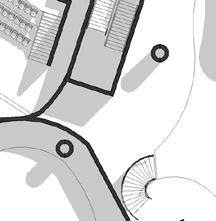
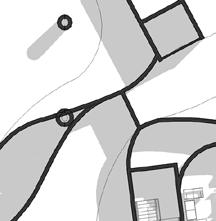


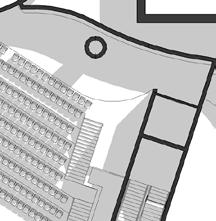


HARDI SHAH C B B A PLAN GROUND LEVEL PLAN GARAGE LEVEL PLAN LEVEL -2 PLAN LEVEL -1 1 2 2 3 4 5 6 6 7 7 8 8 11 10 12 13 9 1 2 3 4 5 6 7 LOBBY EXHIBITION CAFE RETAIL RETAIL AUDITORIUM GAME TESTING 8 9 10 11 12 13 RESEARCH CAVES CAFETERIA STAFF LOUNGE OFFICES & CONFERENCE ROOMS PRIVATE TESTING AREA SERVERS N S E W N S E W
