Report Title: Possible Health Impact of Fires at Launders Lane: Havering Cancer Incidence
Purpose of the Report:
This report is one of several looking at the possible health impacts of recurrent fires at Launders Lane
It explores and interprets cancer incidence data for the ten years 2011 – 2020 to identify any differences between residents living around the Launders Lane site compared with the rest of Havering and England as a whole
Summary of findings:
1. The incidence of lung cancer, brain cancer, haematological cancer (e.g. leukaemias) and mesothelioma in those resident near to the Launders Lane site were similar to rates in Havering as a whole.
2. The incidence of lung, brain and haematological cancers in Havering were similar to England. Havering as a whole has a higher incidence of mesothelioma than England.
3. No differences in incidence of haematological or brain cancers (the two most common childhood cancers) were seen amongst young people (aged 0-25) resident near to the Launders Lane site compared to Havering as a whole, or England.
Report Author: Samantha Westrop
Contact: samantha.westrop@havering.gov.uk
Introduction
Arnold’s Field is a 16.94 hectare area of privately owned land off Launders Lane, Rainham in the South of the London Borough of Havering. The site was formerly a sand and gravel quarry, subsequently registered as a landfill licensed to accept inert, commercial, industrial, household and solid sludge waste. The last waste was recorded as being accepted in 1965, however significant volumes of waste were subsequently deposited there without appropriate authorisation1
The site now catches fire, especially during hot weather. Residents complain about the nuisance caused by smoke, dust and odour from the fires and are concerned about potential health impacts. Local Councillors have received concerns from residents relating to diagnoses of cancers amongst the local community. Havering Council has commissioned soil sampling and comprehensive air quality monitoring
As part of the investigation into potential health risks to residents, data on the incidence of a number of cancer types, where an association with air pollution has previously been proposed, was requested from the National Disease Registration Service, NHS England2
Mesothelioma was included in this request as intrusive sampling on the site had identified asbestos, although not in a form or amount that made the land ‘contaminated’ as per the Environmental Protection Act 19903 . Nonetheless, it resulted in understandable public unease. In response the Council commissioned further air sampling to ensure that asbestos fibres were not escaping from the site and added mesothelioma to the information request made to NDRS. However, it should be noted that the latency period for mesothelioma (time between exposure to a carcinogen and diagnosis of disease) is on average 20 years4, and as such a link between cases of mesothelioma diagnosed in the period 2010 – 2020, and the fires is biologically implausible.
On 18th June 2024, the National Disease Registration Service NHS England performed an extraction and analysis of data at the request of the Public Health team, London Borough of Havering.
The data included in this report provides the number of new diagnoses and age standardised rates5 (ASRs) for the following cancers6:
Lung cancers, ICD10 C33-34
Haematological cancers, as defined here7 .
Brain cancers, ICD10 C70-72
Mesotheliomas, ICD10 C45
Whilst concerns often arise regarding “all cancers” within a population, it is extremely unlikely that several different cancer types will result from a common environmental exposure. For example, the risk factors and biological mechanism for development of melanoma (skin cancer) differ markedly from cervical cancer. If these two malignancies occurred amongst neighbours within a specific time period, there is unlikely to be a causal factor that would link these two types of cancer. As such, lung cancer, brain and haematological cancers were selected for investigation owing to
1 Ground investigation report for the land at Arnold’s Field, Launders Lane, Rainham RM13 9FL. Geo-Environmental 2023. https://issuu.com/haveringcouncil/docs/launders_lane_arnold_s_field_-_soil_investigatio?fr=xKAE9_zU1NQ
4 Cancer research UK: https://www.cancerresearchuk.org/health-professional/cancer-statistics/statistics-by-cancertype/mesothelioma/incidence#heading-Four
5 Age standardisation enables meaningful comparisons to be made between two populations that vary in age structure. More information is provided in Appendix 1 and Appendix 2 of the report.
6 International classification of diseases (ICD) revision 10 https://icd.who.int/browse10/2019/en
the possible links between environmental exposure (such as air pollution) and the cancer of interest8 As noted above, mesothelioma was included in the data request owing to local concern
Standard incidence ratios (SIRs) for haematological and brain cancers occurring in younger people (aged 0-24 years) are also investigated (See Appendix 1 for an explanation of these statistics).
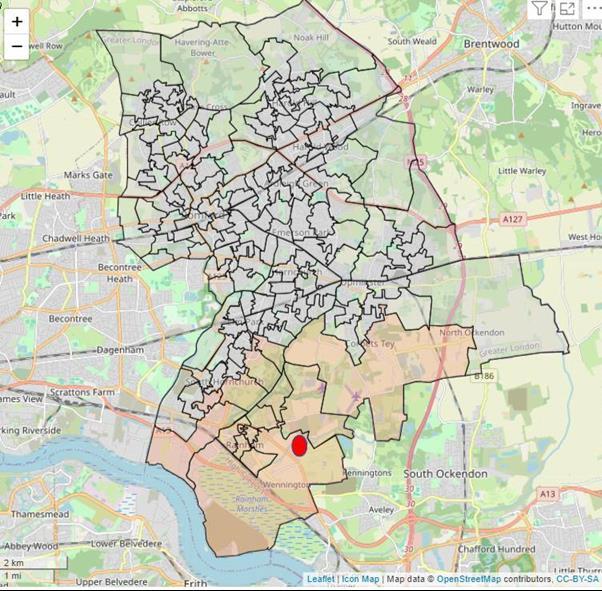
Residents living close to Launders Lane were defined as those living within the 14 LSOAs9 in Havering; home to 23,656 residents (Map 1). These LSOAs are referred to in this report as “LSOAs of interest”, and cancer incidence amongst this population is compared to rates in Havering and England as a whole.
Incident data was requested for 2011 – 2020, the most up to date data held by NDRS. During this period over 782 thousand cases of the four cancers investigated were recorded nationally Data were not requested for smaller geographical areas or shorter time periods as the very small number of cases that would result from such criteria were considered too small to identify statistically significant differences between populations.
It is common for individuals to move residential location. Given the long latency period of cancer (time between exposure to a carcinogen and diagnosis), living close or further away from Launders Lane at the time of diagnosis gives only an approximate indication of where any exposure may have occurred.
8 Craver et al. (2024) Cancer Causes Control 35(5):749-760. Air quality and cancer risk in the All of Us Research Program
9 An LSOA is a geographical area comprised of between 400 and 1,200 households and have a usually resident population between 1,000 and 3,000 persons. Statistical geographies - Office for National Statistics (ons.gov.uk)
Map 1 Fourteen Havering lower super output areas (LSOA) surrounding the Arnold’s Field site (shaded in orange).
Detailed Findings
Lung Cancers, ICD10 C33-C34
What is known already?
Smoking cigarettes is the single biggest risk factor for developing lung cancer, with 7 in 10 cases of lung cancer attributed to smoking cigarettes10 Passive smoking and use of other tobacco products (such as cigars, pipe tobacco, snuff and chewing tobacco) can also increase the risk of lung cancer and other types of cancer.
Whilst most cases of lung cancer are caused by tobacco, people who have never smoked can also develop the condition. Other known causes of lung cancer include:
Radon gas inhalation – a natural radioactive gas that comes from rocks and soils and can build up inside buildings. This is more common in other areas of the country, not in Havering.
Occupational exposure – chemicals and substances used in several industries have been linked to a higher risk of developing lung cancer. These chemicals include arsenic, arsenic, asbestos, beryllium, cadmium, coal and coke fumes, silica and nickel
Pollution – frequent exposure to diesel fumes over many years increases the risk of lung cancer
If a person smokes, the best way to prevent lung cancer is to stop smoking. Other lifestyle choices such as a low-fat, high-fibre diet and regular exercise also helps to reduce the risk of developing lung cancer11
What has this analysis found?
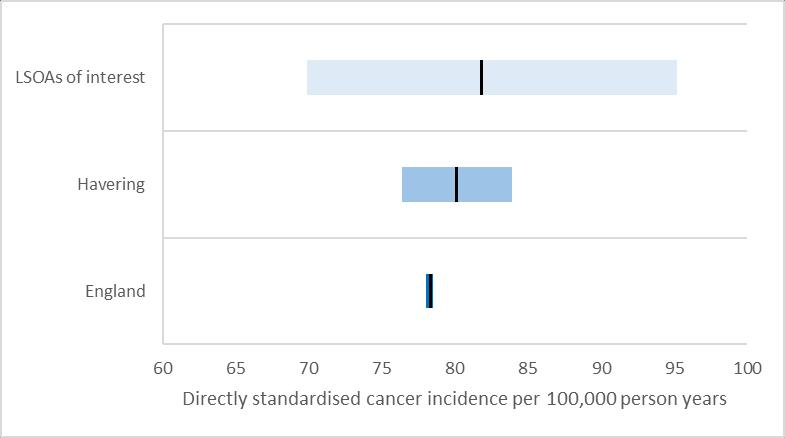
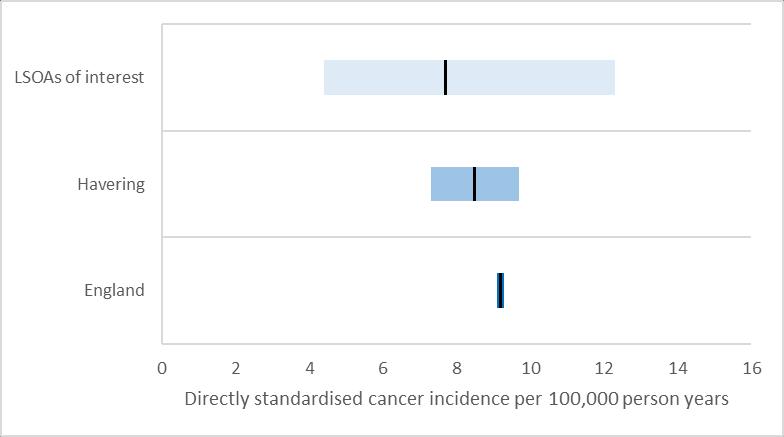
Figure 1 and Table 1 show that the rate of lung cancer diagnoses amongst residents in the LSOAs of interest, around the Launders Lane site, was not statistically different12 from the rate of lung cancer diagnoses in Havering and England.
10 www.nhs.uk/conditions/lung-cancer/causes/
11 www.nhs.uk/conditions/lung-cancer/prevention/
12 The 95% confidence intervals, shown by the blue shaded areas, overlap for all three populations measured See Appendix 1 for more details
1
standardised rates of
1 Standardised rates of lung cancer (ICD10 C33-C34), LSOAs of interest, Havering LA and England, 2011-2020
Figure
lung cancer (ICD10 C33-C34), LSOAs of interest, Havering and England, 2011-2020
Table
What is known already?
Haematological malignancies, often referred to as “blood cancers” are classified as lymphoid (white blood cells), myeloid (red blood cells) and other haematological malignancies13. Haematological malignancies include lymphomas, myelomas and leukaemias14, as well as a number of other cancers.
It is not yet clear what causes each of the different types of haematological cancer; however the distribution is not equal across the population and they are more likely to occur in some population groups than others. For example chronic lymphocytic leukaemia (CLL) is more likely to occur in older people, men or in those with a family history of the disease15 .
A recently published study from the USA16 reported an association between blood cancers and higher levels of mean annual PM2.5, with more than a quarter of cases of cancer found in the group exposed to the highest quartile of PM2.5. When differences in sex at birth, ethnicity, age, smoking status, education and BMI were accounted for there was a significant increase in risk of blood cancer with each unit increase of annual mean PM2.5.
What has this analysis found?
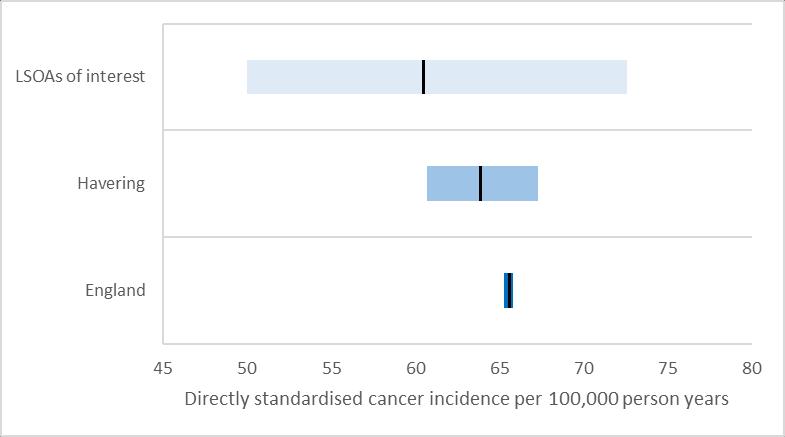
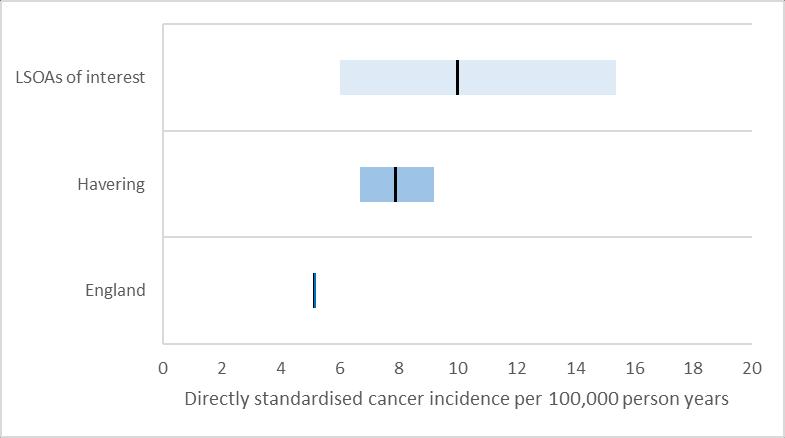
Figure 2 and Table 2 show that the rate of haematological cancer diagnoses amongst residents in the LSOAs of interest, around the Launders Lane site, was not statistically different17 from the rate of haematological cancer diagnoses in Havering and England.
The standardised incidence ratios for those aged 0 – 24 years for haematological cancers were investigated to examine the concerns from residents regarding childhood cancers. Haematological cancers are the most common tumour types (41%) of childhood cancers. No differences in standardised incidence ratios (SIRs) for those aged 0-24 years were found between the 14 LSOAs of interest compared to Havering as a whole (SIR 22.41 [0.57 – 124.80]), or when the 14 LSOAs of interest were compared to England (SIR 18.14 [0.46 – 101.10]) for haematological cancers18
13 Get Data Out: Haematological malignancies (cancerdata.nhs.uk)
16 Craver et al. (2024) Cancer Causes Control 35(5):749-760. Air quality and cancer risk in the All of Us Research Program
17 The 95% confidence intervals, shown by the blue shaded areas, overlap for all three populations measured See Appendix 1 for more details.
18 A standardised incidence ratio (SIR) is often used to determine if the occurrence of cancer in a relatively small population is high or low. If the ratio differs significantly from 100 (confidence intervals do not include 100) it means that there are either more (ratio higher than 100) or less (ratio less than 100) cases than would be expected.
standardised rates of haematological cancer (ICD10 C81-C96), LSOAs of interest, Havering and England, 2011-2020
Table 2 Standardised rates of haematological cancer (ICD10 C81-C96), LSOAs of interest, Havering LA and England, 2011-2020
Geography
Figure 2
Brain Cancers, ICD10 C70-C72
What is known already?
There are many types of brain tumour that occur in different areas of the brain. Brain tumours can be primary (begin in the brain) or secondary (spread to the brain from elsewhere in the body).19 Currently, Cancer Research UK estimates that only 3% of brain tumours in the UK are preventable; these are tumours linked to previous exposure to medical radiation (1%) and those that are caused by being overweight or obese (2%)20 .
A recently published study from the USA21 reported an association between brain cancers and higher levels of mean annual PM2.5, with more than a quarter of cases of cancer found in the group exposed to the highest quartile of PM2.5, however when the relationship was explored by unit increase in annual mean PM2.5 with sociodemographic differences taken into account, there was no statistically significant association found.
What has this analysis found?
Figure 3 and Table 3 show that the rate of brain cancer diagnoses amongst residents in the LSOAs of interest, around the Launders Lane site, was not statistically different22 from the rate of brain cancer diagnoses in Havering and England.
The standardised incidence ratios for those aged 0 – 24 years for brain cancer was investigated to examine the concerns from residents regarding childhood cancers. Brain cancers are the second most common tumour type (20%) for childhood cancers. No differences in standardised incidence ratios (SIRs) for those aged 0-24 years were found between the 14 LSOAs of interest compared to Havering as a whole (62.37 [1.58 – 347.50]), or when the 14 LSOAs of interest were compared to England (52.72 [1.34 – 293.70]) for brain cancers23
21 Craver et al. (2024) Cancer Causes Control 35(5):749-760. Air quality and cancer risk in the All of Us Research Program
22 The 95% confidence intervals, shown by the blue shaded areas, overlap for all three populations measured See Appendix 1 for more details
23 A standardised incidence ratio (SIR) is often used to determine if the occurrence of cancer in a relatively small population is high or low. If the ratio differs significantly from 100 (confidence intervals do not include 100) it means that there are either more (ratio higher than 100) or less (ratio less than 100) cases than would be expected
3
standardised rates of brain cancer (ICD10 C70-C72), LSOAs of interest, Havering and England, 2011-2020
Table 3 Standardised rates of brain cancer (ICD10 C70-C72), LSOAs of interest, Havering LA and England, 2011-2020 Geography
Figure
What is known already?
More than 2,700 people are diagnosed with mesothelioma each year in the UK24 and it is almost always caused by exposure to asbestos, usually occupational exposure25 This exposure is often as a result of working in an industry such as factories where workers were processing or manufacturing asbestos based products and goods, railway and vehicle production, and the building or construction industry, particularly from the 1950s to the 1990s. National data shows men as more often affected than women owing to the higher proportion of men working in the occupations associated with exposure. This type of cancer typically develops more than 20 years after exposure to asbestos20, and consequently most cases are diagnosed in people aged 75 and over. The peak rate of new mesothelioma diagnoses in 2016-18 was in the 85-89 year age group26. Data of incidence rates over time show a peak of incidence occurring between 2008 and 2013, (20-30 years after the first UK bans on imported asbestos came into effect)27. After 2013 rates of mesothelioma diagnoses have continued to decline, and are predicted to decline further in future28, largely owing to the ban on the use of asbestos-containing materials in houses built from the year 2000 onwards, and the ban on asbestos manufacturing in 1990.
The Health and Safety Executive (HSE) has previously reported that Havering has the 8th highest female mesothelioma death rate in the country, and nearby Barking and Dagenham the highest29. Havering was ranked 21st for the mesothelioma death rate amongst males, whilst nearby Barking and Dagenham was ranked 11th out of 363nationally30, 31
Given the information above, in particular the timescales of fires occurring at Arnold’s Field and the development of the disease; the link between any cases of mesothelioma in residents living in the LSOAs of interest and the fires seems biologically implausible, however this data was still investigated owing to concern of local residents.
What has this analysis found?
Figure 4 and Table 4 show that the rate of mesothelioma diagnoses amongst residents in the LSOAs of interest, around the Launders Lane site, was not statistically different32 from the rate of mesothelioma diagnoses in Havering as a whole. The rates in both Havering and the LSOAs of interest are statistically significantly higher than England33, as is expected based on previous publications by the HSE.
If the Arnold’s field site on Launders Lane was a source of asbestos attributable to mesothelioma in the residential population, we would expect to see an increase in incidence rates of mesothelioma in those living in the LSOAs of interest compared to other areas of Havering. Our findings show the rates of mesothelioma in the LSOAs of interest, and the rest of Havering are not statistically different We therefore believe that the increase rate of mesothelioma in Havering as a whole (compared to England) is likely as a result of a higher proportion of Havering residents working in
24 Cancer research UK: https://www.cancerresearchuk.org/health-professional/cancer-statistics/statistics-by-cancertype/mesothelioma/incidence#heading-Four
25 https://www.nhs.uk/conditions/mesothelioma/
26 Cancer research UK: https://www.cancerresearchuk.org/health-professional/cancer-statistics/statistics-by-cancertype/mesothelioma/incidence#heading-Four
32 The 95% confidence intervals, shown by the blue shaded areas, overlap for LSOAs of interest and Havering as a whole. See Appendix 1 for more details
33 The 95% confidence intervals, shown by the blue shaded areas, do not overlap between England as a whole and both the LSOAs of interest and Havering. See Appendix 1 for more details
exposure-prone professions, such as factory work and construction. This pattern is also seen in nearby boroughs; mesothelioma mortality rates are even higher in Barking and Dagenham (males and females) and Newham (females)
The timelines for the development of mesothelioma following asbestos exposure do not support a plausible link with the fires at the Arnold’s Field site. This analysis has replicated the findings of previous HSE reports that found Havering as a whole has a higher incidence of mesothelioma – most likely due to a higher rate of employment in occupations that resulted in greater exposure to asbestos. However, as asbestos has been found at the site, there is legitimate concern regarding its potential release. In response, the Council has commissioned additional sampling to look for the presence of air-borne asbestos fibres. This will be shared with residents when complete.
4 Standardised rates of mesothelioma cancer (ICD10 C45), LSOAs of interest, Havering LA and England, 2011-2020
Figure 4
standardised rates of mesothelioma cancer (ICD10 C45), LSOAs of interest, Havering and England, 2011-2020
Table
Conclusion
The National Disease Registration Service NHS England reported that the incidence rates (number of newly diagnosed cases of cancer per resident) of three cancer types with plausible links to exposure to air pollution (lung cancers, haematological cancers and brain cancers) did not differ in the LSOAs of interest around the Arnold’s Field site compared to the rest of Havering and England as a whole.
Rates of mesothelioma were higher in Havering as a whole compared to England, and it is thought that this Havering-wide increase reflects historic occupational exposure to asbestos. Additional air sampling around the site to investigate the presence of air-borne asbestos fibres, at both times of a fire and when there is no fire, will be carried out.
It is extremely difficult and unusual to be able directly attribute cases of cancer to a specific environmental source. Cancers are known to arise through an accumulation of potential carcinogenic exposures over a life time; the impact of each exposure varying from person to person in part due to genetic differences. Throughout life behaviours, places of residence and work often change, and so it is extremely rare to be able to attribute causation to a single point source, even when investigating populations as presented here
Appendices
Appendix 1 Data source, analysis and presentation
Data held by the National Disease Registration Service (NDRS) NHS England34 includes all cancer diagnoses made between 2011 and 2020 inclusive. The data in this report spans the full ten years as a long time-frame is most appropriate owing to the relatively long latency period of cancers. The earliest fires occurring on the Launders Lane site have been reported as 201235, and a site survey performed in 2012 found elevated levels of lead and benzo(a)pyrene in the soil36. As such, the entire time frame available from the National Cancer Registry (2011-2020) was investigated.
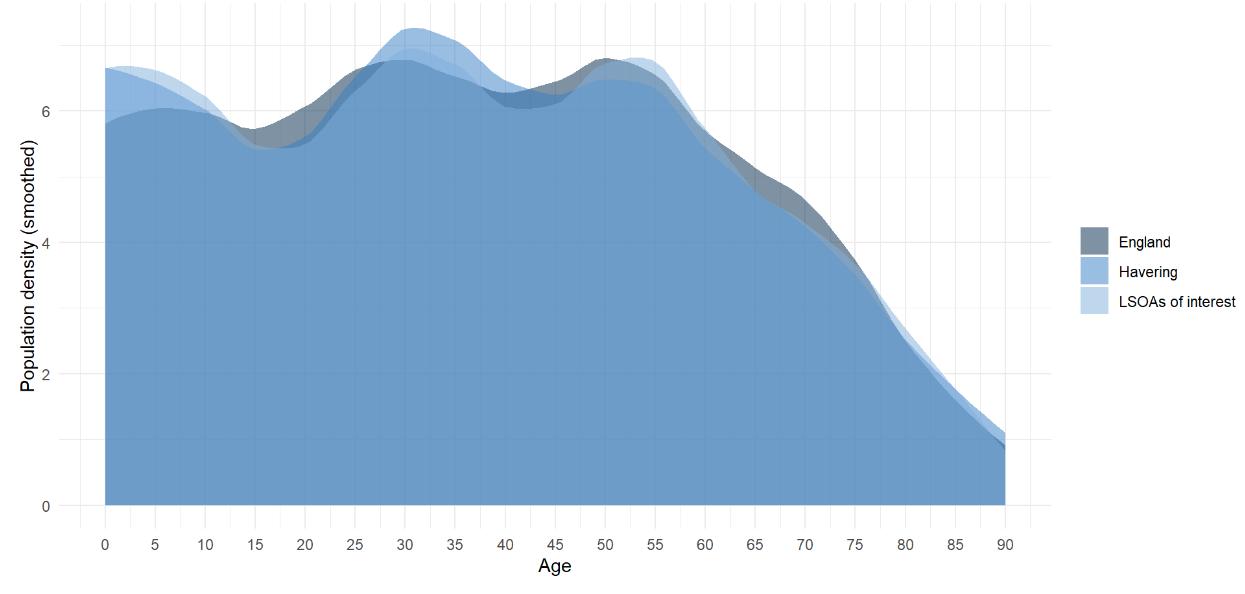
Age standardisation enables meaningful comparisons to be made between two populations that vary in age structure. This is particularly important when comparing rates of cancer as cancer incidence is very strongly associated with age. Without the use of age-standardised rates (ASR) comparing an older population to a younger one may be misleading as there appears to be a higher rate of cancer possibly owing to an external factor (such as air pollution), when in fact it is due to an older population living in the area in question. Figure 1 shows the age distribution of residents in the LSOAs of interest, Havering and England; demonstrating the differences in the agestructure of the three populations.
Similar to age-standardisation, sex-standardisation allows comparison to be made between two populations with different proportions of females to males. This is particularly important as life expectancy of females is longer, and so in older populations there is a higher proportion of women than men. It is also important as some cancer types more commonly occur in men compared to women and vice versa.
Ethnicity data of individuals diagnosed with cancer is collected by NDRS, however when investigating small-geographies (such as the LSOAs of interest) the number of cancer cases is small, and the population data regarding ethnicity is not available. It was therefore not possible to account for differences in ethnicity as part of this analysis.
A standardised incidence ratio (SIR) is often used to determine if the occurrence of cancer in a relatively small population is high or low It is a way of presenting the difference between the observed number new cases in the population of interest compared to the number of cases that would be expected. SIRs are based on the age- and sex-specific incidence rates in the general population (e.g. England). If the ratio differs significantly from 100 it means that there are either more (ratio higher than 100) or less (ratio less than 100) cases than would be expected.
Confidence intervals are used when presenting data to indicate the variation that occurs in any dataset by chance alone. The single number presented as the “standardised rate” of each cancer type is referred to as a “point estimate” and sits at the centre of the confidence interval. When the data set (sample) from which the “estimate” is calculated is larger (e.g. England), the confidence intervals are narrower as the uncertainty around the estimate is less. This is because calculation of an estimate from a larger sample of data gives increased confidence that the estimate represents the true value. Similarly, when a smaller data set is used (e.g. LSOAs of interest) the confidence intervals around the point estimate will be larger.
34 National Disease Registration Service: https://digital.nhs.uk/ndrs
36 Ground investigation report for the land at Arnold’s Field, Launders Lane, Rainham RM13 9FL. Geo-Environmental 2023. https://issuu.com/haveringcouncil/docs/launders_lane_arnold_s_field_-_soil_investigatio?fr=xKAE9_zU1NQ
The accepted statistical standard is to use “95% confidence intervals” around a point estimate. This can be interpreted that there is 95% certainty that the true value lies within the specified range. Practically, when comparing rates from two populations (e.g. Havering compared to England) if the 95% confidence intervals from each estimate overlap the two rates are not significantly different from one another. An example of this overlap of confidence intervals can be seen in Figure 1 Whilst the blue bar on the graph show that the point estimate is highest for the LSOAs of interest, 95% confidence intervals (a statistical method of describing the statistical variation around an estimate) overlap between LSOAs of interest, Havering and England. This means we have been unable to find (with 95% confidence) a significant difference between the LSOAs of interest and Havering or England as a whole.
Appendix 2 Age profile
Figure 5 demonstrates the differences in age profile of the three populations being compared (LSOAs of interest, Havering and England). For example, the LSOAs of interest have a higher proportion of children under 13 years old compared to Havering and England as a whole. These differences in age profile illustrate the need to use age-standardised rates when comparing cancer incidence
Figure 5 Age distribution of population-years, LSOAs of interest, Havering LA and England, 2011-2020