14 minute read
Corn silage harvest timing in your pocket
Mike Rankin
by Matthew Digman, Jerry Cherney, and Debbie Cherney
Advertisement
RESEARCH advocates for harvesting corn at a defined maturity and moisture content for optimal storage, utilization, and milk per acre. As corn plants mature, they increase in dry matter, and starch accumulates, displacing sugar, fiber, and ash. A study at the University of Illinois observed that corn silage harvested at 30% dry matter (DM) resulted in 7% to 25% less milk per acre when compared with silage harvested at an optimum DM content of about 35%.
Determining when to harvest can be time-consuming and expensive. Likewise, relying on visual observations can be deceiving. Stay-green hybrids and field variability can also limit the effectiveness of sampling (see Photo 1). As a result, most producers rely on collecting representative samples to determine whole-plant moisture content.
Sampling plants generally involves a trip to the field, collecting and chopping whole plants, and then drying in a microwave, Koster tester, air fryer, food dehydrator, or forced-air oven. This limits how many samples can be managed and the time between collecting data.
While hand-held and on-harvester near-infrared reflectance spectrometers (NIRS) are effective, they haven’t been widely adopted and are expensive. There are positive independent research data backing NIRS offerings from multiple vendors (see our previous article, “In-hand forage quality,” in the April/May 2018 issue of Hay & Forage Grower). Additionally, moisture varies significantly, and the NIRS technique is strongly influenced by sample moisture content. In fact, samples are routinely dried to use NIRS to predict other chemical components such as protein, fiber, and starch.
MATTHEW DIGMAN
Digman (pictured) is an agricultural engineer at the University of Wisconsin-Madison. Jerry Cherney and Debbie Cherney are the extension forage agronomist and an animal science professor, respectively, at Cornell University.
NIRS goes mini
pocket and use to check corn plants? Does this sound like science fiction?
The miniaturization of NIRS technology is beginning to enable such a scenario. With funding from the New York Farm Viability Institute, we set out to investigate one such device pictured in Photo 2.
The SCiO device was developed by Consumer Physics (Tel-Aviv, Israel) and utilizes a patented technology to glean a spectrum from 740 to 1,070 nanometers (nm). These instruments work on the principle of illuminating the sample and measuring light absorbance. But how do you measure the light that’s not there?
We measure the light that’s not absorbed (reflected) and assume that the missing light was absorbed. The light absorbed by the sample is related to several physical characteristics and chemi-
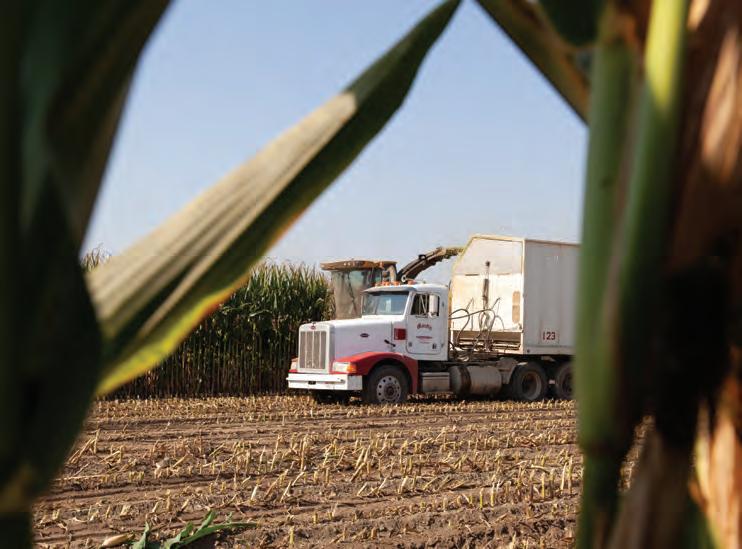
Photo 1. On the same day and farm, the corn on the left measured in at 67% moisture content, and the corn on the right was at 63% moisture, only 4 percentage points lower.
Photo 2. Attachment to SCiO NIRS instrument to maintain a precise distance between the scan window and corn ear surface and exclude external light. The goal was to relate ear moisture to whole-plant moisture.
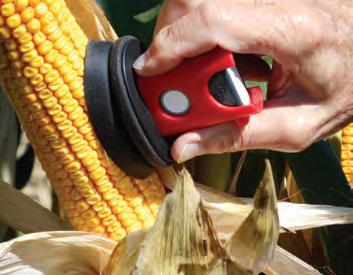
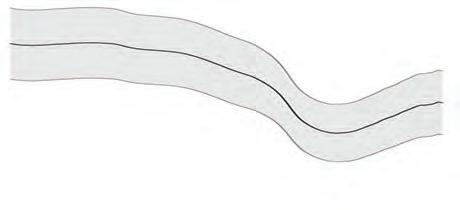
Figure 1. Mean and plus/minus 1 standard deviation of spectra collected from ears using the SCiO device and scanning accessory.
70 65 60 55 50 45 40 35
Drier samples
Generally wetter samples
750 800 850 900 950 1000 1050
Wavelength (nm)
cal species, but here we are counting on that some is due to the water content. The numbers 740 to 1,070 are the wavelengths of light the instrument is sensitive to. In the visible spectrum, violet light is about 400 nm, and red is about 700 nm. Note that the device operates outside of the red, in the infrared.
To evaluate the SCiO device and the accompanying calibration, we scanned over 700 ears of corn throughout New York state. We collected the entire plant to determine whole-plant moisture by drying in a forced-air oven.
Still not there

So, did it work?
Look at the data collected with the SCiO, which is presented in Figure 1. Note the wavelength range at the bottom of the chart. Also, note there is a depression around 970 nm. This is a known absorbance peak for water. It looks like there is promise for this approach.
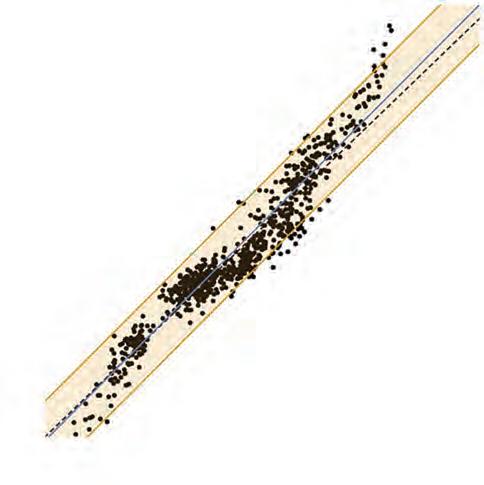
On the downside, we had less success when we compared the oven-dried moisture content to that predicted by the SCiO. Figure 2 depicts each observation as the actual moisture content on the x-axis and predicted on the y-axis. Perfect agreement would be a 1-to-1 ratio, which is represented as a dashed black line. The orange bands represent the 95% prediction band, where we would expect the results to lie 95% of the time with repeated observations. This band was quite large (+/- 6.85% moisture), and in our opinion, the SCiO would have little value in making harvest decisions. Notably, this is just the error associated with predicting the moisture of the ear; additional error will likely result from relating these data to whole-plant moisture.
Is the dream of the pocket-sized spectrometer just that . . . a dream?
Our team doesn’t think so. If you recall, the light spectra in Figure 1 showed only one water peak. There are alternative spectrometers, with a much larger wavelength range that venture further into the near-infrared region. These instruments can provide richer information about the chemical properties of the ear.
We have one season of such data under our belt, and the results look promising. In the meantime, I would suggest looking at one of the hand-held NIRS devices described in our previous article or investing in a Koster tester. While you will still need to collect and chop the whole plant, you will have a reliable indication of when to harvest. • Figure 2. Relationship between laboratory ear moisture (determined by oven DM procedure) and SCiO ear moisture using a Consumer Physics calibration.
90
80
Predicted ear moisture 70
60
50
40
30
30 40 50 60 70 80 90 Actual ear moisture
Blue regression line dashed black 1:1 relationship and shaded 95% confidence bands based on single observations.
November 16–18 Reno, NV
2021 Western Alfalfa & Forage Symposium A comprehensive and educational program on important issues related to alfalfa and forages. Exhibitor and sponsorship opportunities available!
calhaysymposium.com
Corn silage two-minute drill
PICTURE yourself with the playbook in your hands as several key decisions loom while coaching your team in the final minutes of the game. Your team is relying on you to put them in the right position to score and succeed.
Each year, corn harvest for silage is very similar. There are numerous teammates that need to be organized and coordinated for a successful season. The conditions may dictate different decisions made this year relative to last. Hence, you need to be ready to make the call as circumstances change.
Numerous real-time measurements can play into your decision-making process, and it may help to have them organized like a playbook in front of you. Then, after the final ton of chopped corn is packed into the silo, we can review the season’s successes based on different metrics. This annual growing and harvest season review can be thought of like watching a game tape to find opportunities for the next competition.
Make the right call
Many different growing conditions and agronomic practices affect how and when corn should be harvested for silage. Often, I overhear a producer comment, “Oh, we’ll just take that corn for silage” in reference to harvesting poor-looking corn. Grain or silage corn is far too valuable to ignore opportunities in fertility, crop protection, or harvest management as the season winds down.
During the growing season, working with an experienced agronomist can help determine which fertility and crop protection applications are warranted. These decisions affect the growing crop and contribute to the season’s success, just like making the right adjustment in the middle of a game. As harvest comes into focus, crop health and contamination, grain maturity, whole-plant moisture, chop length, and kernel processing need to be monitored with the same intensity as the weather forecast.
Beyond nutritive measures, some producers are checking yeast, mold, and mycotoxin levels in green-chopped corn. Sometimes, allied industry representatives take these samples to help manage the harvest. If your farm makes these measures, anticipate high yeast levels and interpret the results with caution. This outcome is to be expected because wild yeasts are relatively abundant in nature with temperate growing conditions. The concern level here is relatively low, recognizing that a successful fermentation will greatly reduce the yeast load. Mold and mycotoxin measures can be more variable. Mold is less concerning than mycotoxin load, as the latter causes harm to animals.
Most of the common mycotoxins we measure are derived from the field. Mycotoxins such as deoxynivalenol (DON) or T-2 toxin are likely to subsist through the ensiling process. Historic research shows that mycotoxin concentration is relatively stable in fermented forages; however, recent research from the University of Wisconsin suggests that DON levels can actually rise in well-fermented silos.
Beyond our control
After recognizing mycotoxin contamination, many producers have wondered what they should have done differently. The answer in most cases is nothing. Regional mycotoxin contamination is often beyond our control and due to environmental conditions during the season. If your team measures substantial mycotoxin contamination with freshly chopped corn, make every effort to ferment the crop quickly and efficiently. Consider a research-backed two-stage inoculant or preservative that promotes stability later when the crop is opened up to feed out.
In addition to monitoring contamination, ensure whole-plant moisture and kernel maturity are evaluated. Strive for 65% moisture and half-milk layer kernel maturity with most storage systems. In some situations, the moisture and kernel maturity do not fully align. Next, consult with your nutritionist regarding the desired kernel processing and particle size requirements. In most cases, complete kernel destruction and a freshly chopped corn kernel processing score of 65 or greater are desirable. Kernel processing score will likely rise five or more points in storage as the silage ferments and starch in the grain softens and breaks down.
Review the game tape
After the corn is in the silo or under plastic and fermented, it’s important to also review the season’s successes and pain points. Here is where feed-out mold and yeast measures can be helpful to pick up silage stability opportunities that you won’t be able to see with your naked eye.
You may also opt to check your silage density. Newer recommendations focus on as-fed density instead of dry matter density. As-fed density accounts for moisture, which is important. Other crop review points include fermentation measures such as pH, lactic and acetic acid, and alcohols such as ethanol. These help determine how effectively your crop was conserved. In most cases, we expect to measure a pH of less than 4, lactic acid above 3%, and a lactic-to-acetic acid ratio of at least 3:1 for most bacterial inoculants. For reference, roughly 70% of Rock River Laboratory database corn silage samples met the first two thresholds; however, only 30% met the lactic-to-acetic acid ratio threshold over the past five years.
If your farm used a research-backed two-stage bacterial inoculant with Lactobacillus buchneri, then the acetic acid content will be intentionally elevated to promote aerobic stability. In this case, the ratio to lactic acid holds less value.
With an average dairy diet in the U.S., a 500-cow dairy will have roughly $250,000 invested in corn silage from the soil to the silo. Time and effort spent preparing your game plan for harvest and reviewing the tape after the silage season is over will uncover opportunities for next year. •
JOHN GOESER
The author is the director of nutrition research and innovation with Rock River Lab Inc, and adjunct assistant professor, University of Wisconsin-Madison’s Dairy Science Department.
IS THAT RESIDUAL OR RESIDUE?
Mike Rankin
SOMETIMES I get confused when people talk to me about their grazing practices. Within grazing science, there are certain terms used to describe very specific concepts or conditions. Some people use words rather carelessly in my view, while I take them more seriously. I think my particularity about words is because I spent so many years in research, teaching, and editing papers. Words mean specific things to me.
Here is an example. After a pasture has been grazed, the green living material left behind is called residual. Specifically, it is the “postgrazing residual.” Those green, living leaves and stems are the photosynthetic factory that drives the regrowth in the pasture. Rate of recovery is tied directly to the level of residual. More leaves left after grazing means the plant is less dependent on stored carbohydrates for regrowth and the pasture recovers more quickly.
Residue is dead plant material on the soil surface. Residue is synonymous with litter or duff. In rangelands, we more often say “litter,” while in classic pasture science residue is more commonly used. Residue on the soil surface is very important to a functioning water cycle. Residue also moderates soil temperature, which is beneficial to many microbial processes in the soil.
Someone calls me up on the telephone with a grazing question and they say, “I’m leaving a lot of residue behind.” How am I supposed to interpret that? Does it mean they are trampling a lot of material to death and leaving it on the surface, or do they really mean they left 6 inches of standing leaf after grazing? You can see that is two very different outcomes, and we would expect to see very different recovery response to those two scenarios.
Location dictates strategy
In productive environments, including high natural rainfall or irrigated pastures, leaving appropriate residual is key to maintaining high pasture growth rate and production levels. Leaving taller postgrazing residuals is also a way to enhance daily forage intake by grazing livestock. Managing residual level is a key piece of the above-ground aspects of grazing management.
In rangeland environments, we put a lot more focus on increasing the residue or litter layer on the soil surface. Plant available water in the soil is usually the first limiting factor to rangeland productivity. Poor water cycle function is the weak link on most rangelands around the world.
The first step to creating a more functional water cycle is enhancing surface residue. Surface residue, or litter, slows overland flow of water, creates a sponge effect to hold water in place, insulates the soil to reduce evaporation, and ultimately contributes to improved soil organic matter levels.
How do we create more surface residue? One of the main avenues is by leaving more residual. If 80% of the above-ground vegetation is removed with grazing, there is little opportunity to create residue. If we only remove 20% of the above ground vegetation, there is much greater opportunity to create residue.
Since my undergraduate college days, I have heard the grazing adage of “Take half, leave half.” For a long time, I thought that was a very appropriate grazing management guideline. It is simple and seemingly straightforward. Or is it?
A lot of people interpret the “half” to be based on height. That is, if the pasture is 12 inches tall, we graze off 6 inches and leave 6 inches. As it turns out, the “half” is based on biomass, not height. In a typical mixed cool-season grass-legume mixture, half of the biomass is in the upper 60% to 65% of the height, and the residual half is in the lower 35% to 40%.
When we were in the productive, high-rainfall environment of Missouri, I tried to be a “Take half, leave half” grazier. Harvesting half of the biomass on each grazing cycle with the livestock seemed perfectly reasonable. We could run a half-dozen grazing cycles a year, and each time we tried to remove half of the standing biomass. By doing so, we still added residue to the soil surface.
In fact, range scientists who were saying “Take half, leave half” actually meant that the total removal of biomass by livestock, wildlife, insects, wind damage, and so forth should not exceed 50%. Often, they do grazing budgets only allowing 25% for livestock grazing. Suddenly, the adage takes on a new meaning.
Over the 17 years that I have now lived and worked in the semi-arid West rangeland, I have come to have a very different view of appropriate use of rangelands using management-intensive grazing (MiG). The lower the total range dry matter yield, the lower the allowable utilization should be. In other words, the lower the standing biomass, the greater the percentage we must leave as post-grazing residual. Leaving more residual is the only way we can create more residue. •
JIM GERRISH
The author is a rancher, author, speaker, and consultant with over 40 years of experience in grazing management research, outreach, and practice. He has lived and grazed livestock in hot, humid Missouri and cold, dry Idaho.


