41 minute read
Dewing it the small way
by Mike Rankin
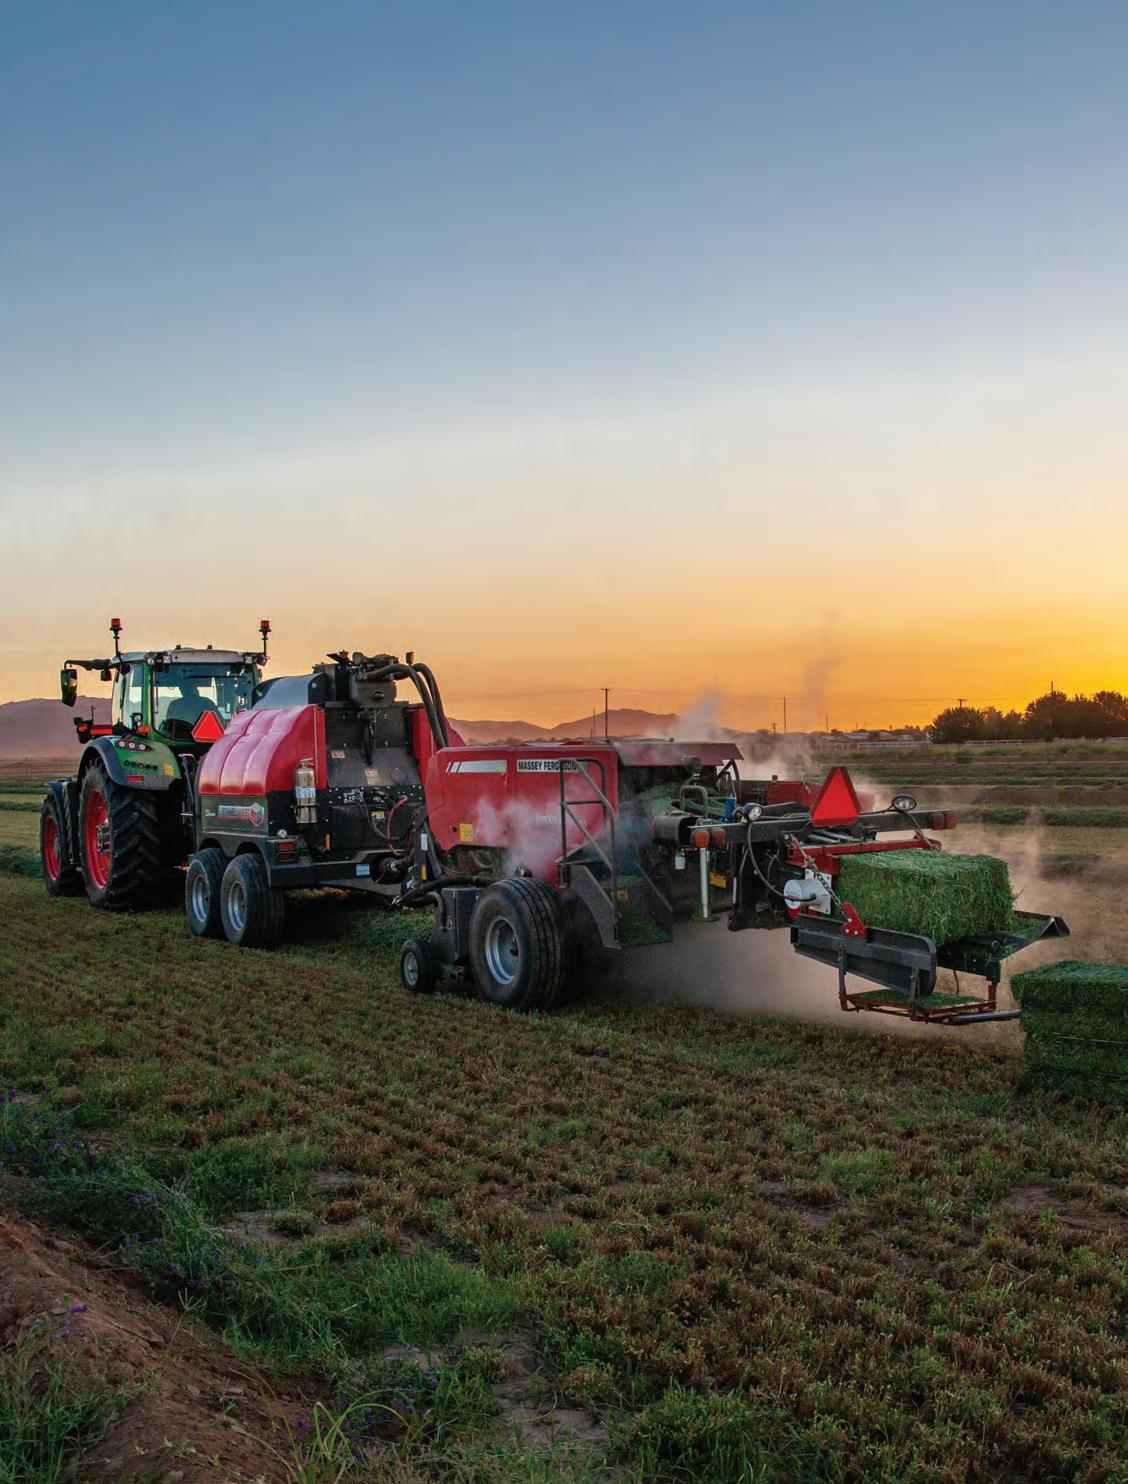
Bales Hay in Buckeye, Ariz., is one of the first farms in the U.S. to adopt steaming technology for small bales.
Advertisement
ONE-pass hay steamer technology is nothing new to Western haymakers, at least those who make and market large square bales.
But what about hay operations that fight the same arid conditions and make the 90- to 100-pound three-tie bales or lighter two-tie bales? Their options have been limited . . . until now.
Bales Hay is a family-run operation near Buckeye, Ariz., just southwest of the Phoenix metro. Steve Bales, his son, Trevor, and cousin Brian Turner form a trio that farms over 2,000 acres of owned and leased land, consisting mostly of flood-irrigated alfalfa. They sell much of their hay direct-to-consumer or to retail outlets. Horse owners make up a large part of their clientele.
“We need our hay to be nutritious, but it’s also essential that it be visually appealing,” Trevor noted. “Our hay has to retain leaves and look good or our customers won’t buy it, regardless of how it tests.”
In the past few years, Trevor’s reputation as a haymaker has spread beyond the Arizona desert. In fact, he’s become somewhat of a social media sensation with postings on Instagram, YouTube, and Facebook. It’s through these channels that Trevor brings the hayfield to living rooms throughout the world. It’s also how Bales Hay Sales became one of the first operations in the U.S. to test drive the Staheli West DewPoint 331 hay steamer for small square bales.
Staheli West, based in Cedar City, Utah, had been manufacturing its larger DewPoint 6210 machine for over 10 years but was in the later development stages of testing a smaller, less expensive version for small square balers.
“On social media, I’ve noticed how everyone just highlights their best products and successes,” Trevor said. “Last year, I decided to point out that we’re no different than everybody else, and there are times that we have to bale when the hay is too dry, and we lose too many leaves. I demonstrated what I was talking about and mentioned that it sure would be nice if Staheli West would send a steamer our way to use. Then, two or three days later, I got a phone call from the company, and they wanted to send us a steamer to demo.”
Testing the water
for the use of a larger tractor because none of Bales’ had enough horsepower (HP) to pull and operate the steamer and baler train. The DewPoint 331 remained on the farm for about a week, then came the difficult task of decision-making.
“Of course, I thought it was cool, but at that point, I really put it on our field manager, Brian, to crunch the numbers and make any kind of final decision,” Trevor explained. “I told him it was up to him 100%. I would have been happy if we decided to run four power takeoff (PTO) balers or two steamers.”
This proved to be a tough decision on several levels. First, only one steamer wouldn’t work. It had to be two or none. “Our baling window isn’t wide enough for one steamer, and if that steamer breaks down, then you still have to keep three or four balers as backup,” Trevor said.
In addition, the Bales crew would also need to purchase two larger tractors to pull the steamer and the baler. The minimum power needed on their flat, desert ground was 125 HP.
Two new steamers, tractors, and balers would not be the end of the expenditures. Trevor noted that a reverse osmosis system for water used in the steamer was also needed to ensure that clean water be used to create steam. This meant an additional $20,000 investment.
On the plus side was a wider window for baling in the arid desert environment. During the extreme heat of mid-summer, they still wouldn’t be able to bale all day, but they could bale during the otherwise dewless nights and into mid-morning. Running two steamers would also mean a reduction in labor. “Finding good labor is becoming more difficult, and with the steamers, we only need two baler drivers instead of four or five,” Trevor noted.
It took several months for Brian to make a final decision. Weighing heavily into the decision was the fact that the farm had four motorized balers that were near the end of their useful life and would soon have to be replaced, steamers or not. Also, two of their current baler tractors needed to be upgraded.
The question boiled down to if the farm would run four new PTO-driven balers or two new balers with steamers. “It would have been a harder decision to make if some of our current equipment didn’t need to be replaced,” Trevor asserted.
Ultimately, Brian recommended the operation bale with two steamers.
“There are a lot of farms making
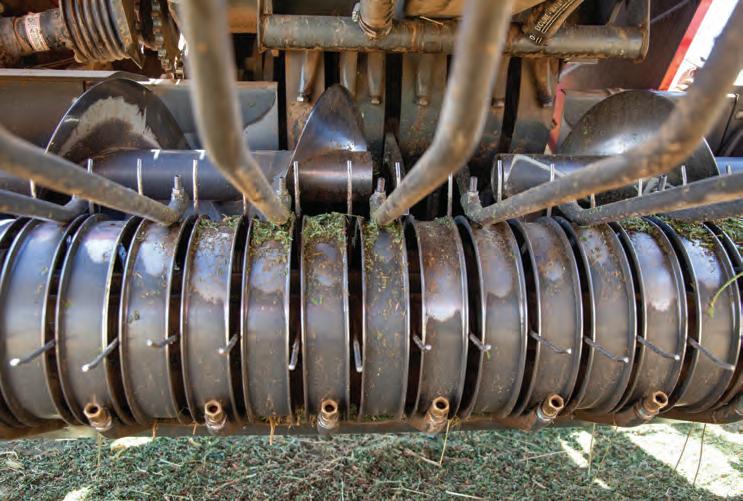
Steam is transferred to the baler through hoses. It’s then applied to the windrow as it enters the baler via three manifolds (see arrows). The amount of steam coming through each manifold is controlled by the operator.
big square bales that have been using steamers with good success, so that made the decision a little easier,” Trevor said. “It wasn’t like we were going to be the first. The only difference is that we make small square bales.”
Trevor, Brian, and two employees attended a school this past year in Utah for those who had purchased a steamer. “They did a really good job of showing you how to troubleshoot the machine,” Trevor said. “They also thoroughly go over the owner’s manual with you.”
Up and running
The two DewPoint 331s arrived on the farm in early May. The Bales ultimately settled on two, 140 HP Fendt tractors to power the baling train. They wanted a little more horsepower than the minimum recommended for their conditions.
The farm uses a 5,000-gallon storage tank for water. For every 3 gallons of salty, desert water that goes through the water system, only 1 gallon of clean water is generated. The other 2 gallons of salty water are used for dust control on the farmstead.
The steamers, loaded with over 600 gallons of water, are heavy, weighing about 8 tons. For that reason, the units have their own set of trailer brakes. Comprised with what is essentially a low-pressure boiler (about 15 pounds per square inch), the DewPoints are equipped with numerous safety features.
The steamers will operate from three to five hours before needing to be refilled with water. Operational time depends on the amount of steam being released through the manifolds on the baler. Steam is applied to the hay windrow as it is picked up by the baler. The three separate manifolds are located below the pickup, above the pickup, and in the bale feed and packing chamber.
The operator has full control as to the amount and percent of steam being released among the manifolds. For example, if the top of the windrow is still wet from dew but the bottom is dry, the top manifold can be shut off or reduced, and steam is only applied to the drier bottom. The interactive touchscreen in the tractor cab makes the adjustments relatively simple and fast.
Out of the baler, the steamed bales are still hot. In fact, it’s recommended that they not be accumulated and stacked for 30 minutes.
Brian explained that there are some differences between the larger DewPoint 6210 and its younger, smaller brother. The big square steamers have a diesel generator/burner combination on board that powers all the components and heats the water. The small one also uses diesel but derives all its power from the tractor’s electrical and hydraulic systems. “There’s really very little maintenance with these,” Brian said. “There’s not a lot of moving parts.”
“Nothing can beat natural dew, but those nights and mornings when it’s windy and there’s no dew, that’s when the payback comes,” said Trevor of their experience this summer. When there is dew, or if baling bermudagrass, the Bales still pull the steamers but just don’t generate any steam.
“One thing about the steamer is that it makes an awesome flake,” Trevor noted. “When you cut the strings, those nice, uniform flakes just fall apart from each other but stay intact. Surprisingly, I get a lot of complaints about bales that don’t maintain a flake when they’re cut open. I think our customers will really notice a difference with the steamed bales,” he added.
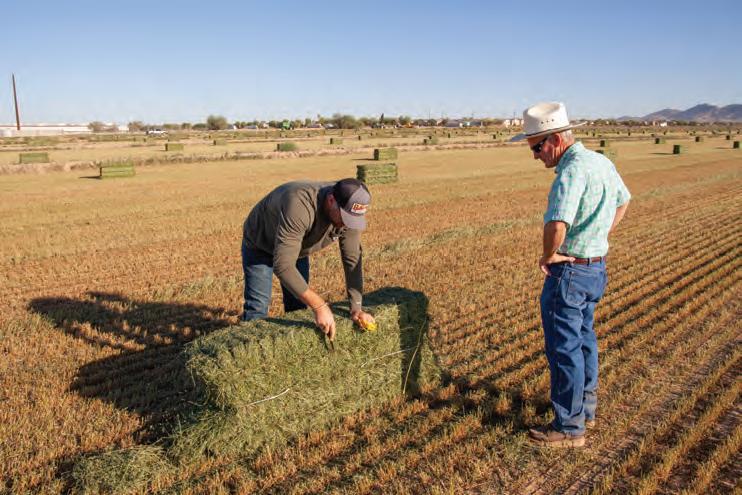
“One thing about the steamer is that it makes an awesome flake,” Trevor Bales said. Trevor (left) and Brian Turner routinely inspect bales once they cool in the field.
Deep steamer roots
The current version of the DewPoint 331 has been in development for about four years.
“Ironically, we originally started with a smaller version in the 1990s when Dave Staheli first invented the steamer,” explained Logan Staheli, who serves as the director of marketing for Staheli West. “When we decided to bring the units to market in 2009 and 2010, the big baler had become popular, and that is was what we were using on our farm. So, we came out with the big bale steamer.”
Staheli West has been testing the DewPoint 331 for the past three years in Utah. In 2020, they released six units for beta testing. This year, the small steamer is in limited production status. By the end of the year, the company expects to have 40 operating units on 20 different farms. Next year, the unit will reach the full production stage.
“There have been some minor issues with the small steamers since releasing them this year, but we are working really hard to get all the issues resolved so that we are ready to move into full production,” Staheli said. “We are confident that we have some pretty good solutions and updates that are going to fix the quirky bugs some of our customers are seeing. Luckily, we haven’t had any major issues that have shut our customers down for any extended period. Our customers really like them so far.”
Included in that group is Bales Hay. “We’ve been happy so far; it does what it’s advertised to do — save leaves,” affirmed Brian when asked for his firstyear assessment. •
Small grain silage under a broad lens
READING about small grains for silage in the middle of the summer might seem untimely; however, a post-season evaluation of small grains for silage is always good for adjusting future management and making better decisions.
Several questions typically arise when planning small grains for silage. How can annual winter grasses fit in a double-crop rotation? What species should be planted? When should small grains be harvested?
To address these questions, we planted several winter-annual grasses in a plot study that was replicated in three different regions of Virginia. These included Blacksburg (Site 1), which is located in the Blue Ridge Mountains and has an elevation of approximately 2,000 feet (the coolest environment); Blackstone (Site 2), which is located in the Southern Piedmont region and has an elevation of approximately 450 feet (the hottest environment); and Orange (Site 3), which is located in the Northern Piedmont region and has an elevation of approximately 500 feet (an intermediate environment).
In each of these regions, we planted four varieties of triticale (TT), two varieties of rye (RY), and two varieties of barley (BA) in triplicates. All these varieties were harvested at the boot and soft-dough stage of maturity.
Heat drove maturity
As expected, it took fewer days to reach harvest time in the hottest environment and more days in the coolest environment, and this was the case for all three species. Even though the results seem obvious, it is worth highlighting that fitting double-crops in the rotation will be more challenging in cooler areas and, therefore, some additional attention is needed for species selection and harvest timing.
If the priority is to release the field early for a subsequent summer crop, then rye or barley could be the best options when harvesting at the boot stage. However, such a decision might result in lower dry matter yields (see graph). When a balance between early release of the field and dry matter yield is needed, perhaps triticale silage, harvested at the boot stage, might be the best option.
There are several harvest timing observations to highlight. The most obvious one is the difference in dry matter yield between small grains harvested at the boot stage and those harvested at the soft-dough stage (see graph). In most cases, harvesting at the soft-dough stage more than doubled the dry matter yield compared to a boot stage harvest. Therefore, if dry matter yield is a priority, then rye or triticale at the soft-dough stage might provide the best options.
If a balance between dry matter yield and early release of the field is needed, then barley becomes a more suitable option. It is worth paying attention to the
short window that barley has to reach the soft-dough maturity stage. From a logistics perspective, this may be very important when large areas need to be harvested with small-scale equipment.
Small grain silage yield at the boot and soft-dough stages
Dry matter yield, ton/Ac
7
6
5
4
3
2
1
0 5.5 5.3
1.4
1.1 6.7
■ Boot ■ Soft-dough
3.8 3.6 4.6 4.4 5.1
1.9 1.8
1.3 1.8 2.2 2.3 5.7
2.8
RY-Site 1 RY-Site 2 RY-Site 3 BA-Site 1BA-Site 2BA-Site 3TT-Site 1 TT-Site 2 TT-Site 3
Price influences timing
For this project, a lot of work is still pending regarding forage quality. Economic analyses from our laboratory with data generated by Wayne Coblentz at the Dairy Forage Research Center in Wisconsin show that when commodity prices are high (as they currently are), cheaper diets can be formulated when triticale is harvested at the boot stage than when harvested at the soft-dough stage. On the other hand, when commodity prices are low, cheaper diets can be formulated when harvesting small grains at the soft-dough stage compared to the boot stage.
Our intention is to expand these chemical and economic analyses using multiple varieties within species to provide a more holistic view and interpretation of small grains management for silage. As an early assessment of forage quality based on a subjective visual appraisal, the mild drought observed in the late spring of 2021 seemed to substantially affect the forages harvested at the soft-dough stage. This was particularly evident for some rye and triticale varieties and not as much for the barley varieties that were harvested before the drought became severe.
In summary, many management options for small grain silage are
available to meet the agronomic, ecologic, nutritional, and economic needs of the dairy farm. This project, which is funded by the Virginia Agricultural Council, is a collaboration with my laboratory assistant, Christy Teets, and my colleagues Wade Thomason and Katye Payne from the School of Plant and Environmental Sciences at Virginia Tech. •
GONZALO FERREIRA
The author is an associate professor, department of dairy science, Virginia Tech.
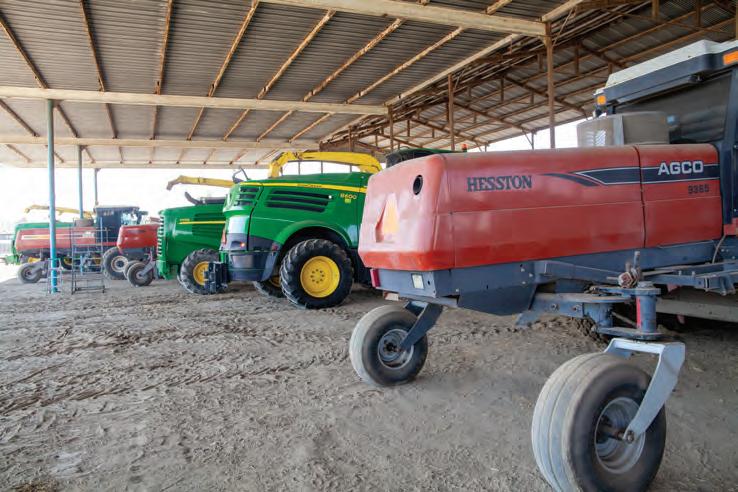
New machinery inventories are slim on many dealer lots, which has substantially elevated the price and demand for lowhour, used equipment.
Mike Rankin
It’s a waiting game
WHAT a year 2021 is shaping up to be. Commodities were “limit up” for a week straight, then two weeks later, “limit down” each day. Feeder cattle have been steady, and milk has seemed to hold its own as well.
One thing that has been a disappointment in the agricultural sector is farm equipment. Whether it is a delay in parts delivery from UPS or FedEx, lack of new iron on dealers’ lots, or the exploding value of good, used equipment, the equipment business has been a roller coaster this year with both highs and lows. Let’s break down a few of the issues we seem to have encountered, and I’ll offer my two cents on how long before some sort of normalcy returns.
To begin, I believe the problem that can be solved with the least number of headaches relates to the parts shortage and shipping issues. This has affected all of us, no matter what color of equipment resides in the shed. The problem has been caused by manufacturers not having enough employees to produce items at full capacity and suppliers not having shipping containers to supply needed components to finish the product. The same has been true in the automotive industry. By the end of the summer, most retailers and manufacturers should at least be able to offer an accurate timeline as to when you can expect a part to be delivered.
Unlike a normal year, we have had numerous packages not show up on time or with damaged or missing parts. I was tracking an overnight freight shipment this spring that did not make it on time, and I finally got a manager on the phone who was willing to explain the situation to me. The blame went to COVID-19, but not in the way you might think.
A vaccine priority
Apparently, when the U.S. government contracted with both UPS and FedEx to deliver vaccines, they requested a significant amount of workforce — up to one-third, according to the manager I spoke to. In addition, a substantial number of planes and trucks were relegated to the effort. As a business owner, I could not imagine still trying to run a company without the top one-third of my assets and employees. When you think about it in this light, I find myself being a little more patient with deliveries and have confidence that things will soon return to normal as fewer vaccine shipments are needed.
Watch the steel price
For many farmers and ranchers, purchasing new equipment this year has been a waiting game. Unfortunately, I do not see us catching up anytime soon. I think it will be at least until the end of next summer or early fall before there is some relief and equipment manufacturers get caught up with the backlog of orders from dealers. Some companies are currently citing delivery times of eight to 12 months out on certain types of equipment.
The one factor I believe will determine how fast we catch up is the price of steel. If it remains high, I don’t believe dealers and farmers will order as much new equipment this fall for 2022 production. This will allow production to catch up faster. If steel prices come back down, I expect dealers to fill up their lots again with new inventory that’s ready to sell. If there’s not a good selection of new equipment, most farmers may shy away from upgrading to newer used tractors or implements.
The used market is one that has been interesting to watch. Equipment values have skyrocketed this year with the shortage of new iron coupled with high commodity prices. This is a good thing for most people, as iron gets moved. However, the used machinery market will likely be tight for the next several years. The lack of new equipment being sold during the last part of 2020 and all of 2021 will have a trickle-down effect for the foreseeable future.
A low-hour, low-use unit of anything will be tough to come by for many months to come. If you find a unit that fits your needs, snatch it up. Another one may not come along for quite a while. If your current equipment line is running well and in good condition, it may be best to hold off trading for a while to see what happens.
Keep a close eye on interest rates and the equipment inventory situation. Better times will come for purchasing equipment, but for now, we’re clearly in a holding pattern. •
ADAM VERNER
The author is a managing partner in Elite Ag LLC, Leesburg, Ga. He also is active in the family farm in Rutledge.
Start with these soil health principles
by Hugh Aljoe
SO, WHAT is regenerative ranching?
Noble Research Institute has defined it as the process of restoring degraded grazing lands using practices based on ecological principles. In essence, regenerative ranching is managing grazing lands to enhance the water cycle, mineral cycle, energy cycle, and community dynamics within our ranches by applying practices that adhere to the six soil health principles.
1. Know your context
This principle has often been stated, but the Understanding Ag LLC founders added it to the front of the Natural Resources Conservation Service’s (NRCS) list of five soil health principles. Context is always important. It considers climate, past management, original pre-European settlement state, current and recent conditions, regional history, the skills and abilities of the people operating the land, and the property’s resources.
Most producers have some understanding of the context based on current conditions, but the historical record is often overlooked. Almost all grazing lands are in a degraded state compared to pre-settlement. We do not have to settle on a stewardship goal of “sustaining or conserving” what we currently have; we can actually improve the soil. Knowing the historical context elevates a stewardship goal to a target that is both measurable and achievable through regenerative management.
2. Keep the soil covered
Most ranchers with a stewardship goal strive to do this, even with grazed croplands. The more arid the country, the more difficult this is to achieve; however, most producers with a conservation or stewardship ethic leave more residual after grazing events, allow for more plants and litter cover between existing plants, allow for recovery of grazed pastures by providing more rest or deferment, and actively manage stock numbers. Regardless of grazing land use (native range, introduced pasture, or grazed cropland), regenerative ranchers strive to minimize the amount of bare ground.
3. Minimize disturbance
Disturbance comes in many forms, including tillage, mowing, haying, fertilizing, chemical applications, fire, and grazing. As we have come to realize the negative effects of erosion, grazing land managers have reduced tillage activities, adopted no-till cropping, or turned cropland into perennial pasture. However, many farmers and ranchers don’t realize the impact of grazing and routine practices on pastures.
Ideally, to minimize disturbance, pastures should be grazed for short periods of time with individual grass plants being defoliated once per grazing event and then allowed to fully recover before being grazed again. Grazing
management needs to be adaptive to balance the needs of plant recovery and livestock performance.
Using fertilizers and chemicals on grazing lands impacts nontarget life above and below the soil. Routine use of both adversely affects soil organisms that could work with plants to build healthier and more productive soil. Reducing, and when possible eliminating, the routine need for fertilizer and chemicals is an objective of regenerative ranching. Most producers would like to reduce these two costly inputs, and regenerative ranching can help them achieve this.
4. Maintain living plants/roots
Perennials, which have living and functioning roots during both growing and dormant seasons, have a distinct advantage over annuals. Most ranchers and farmers with grazing livestock typically rely on perennial pasture and have converted the most marginal croplands to perennial pastures. Actively growing roots provide opportunity for soil organisms to develop symbiotic relationships with the plants in which nutrients are exchanged and soil structure is built. The more actively growing roots growing within the soil, the more rapidly soil health, organic matter, and structure can be enhanced.
5. Enhance diversity
Native range usually has a distinct diversity advantage over introduced pastures and grazed croplands, which are usually managed as monocultures. Good-condition native pastures are naturally diverse with a mixture of grasses, forbs, and woody species; perennials and annuals; and usually warm-season and cool-season forages. Location often determines the mix.
Diverse annual crop mixtures are most effective when planted in grazed croplands, especially if double-cropped (cool-season and warm-season mixtures) to provide multiseason grazing. It is more challenging to manage for diversity in introduced pastures because traditional, costly management strives to maintain them as monocultures. Interseeding or overseeding introduced pastures with a mixture of annual forages can create needed diversity to begin regenerative efforts to improve soil health and soil biology.
Depending on the soil metrics, some fertility may be needed at a minimal rate until the soil biology can sustain adequate plant growth. In addition, the mixture of annuals interseeded into perennial, introduced pastures usually extends the grazing season on these pastures. Interseeding may initially come as an added expense, but greater diversity can become a cost-effective benefit to the livestock and the soil organisms if pastures are managed appropriately and planted with forages that can be used by grazing livestock.
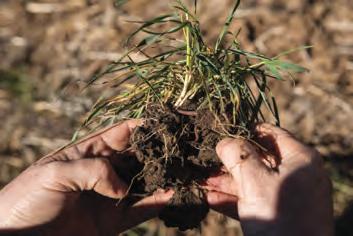
Building soil health requires an intentional and long-term commitment.
HUGE ALJOE
The author is the director of producer relations at Noble Research Institute in Ardmore, Okla.
regenerative ranching. It also includes multispecies grazing. Adding different livestock to the operation requires some infrastructure additions in most cases, but more importantly, it requires a mindset change. With improving soil health, enhanced diversity will be observed in plant and animal species, including wildlife, birds, insects, and soil organisms
6. Properly integrate livestock
The grazing management aspect of “properly” integrating livestock can be difficult for those adopting regenerative ranching. The challenge becomes how to properly apply grazing management to fit the context of the operation while rebuilding soils. Effective grazing is adaptive, flexible, varying in intensity and stock density, and intentional.
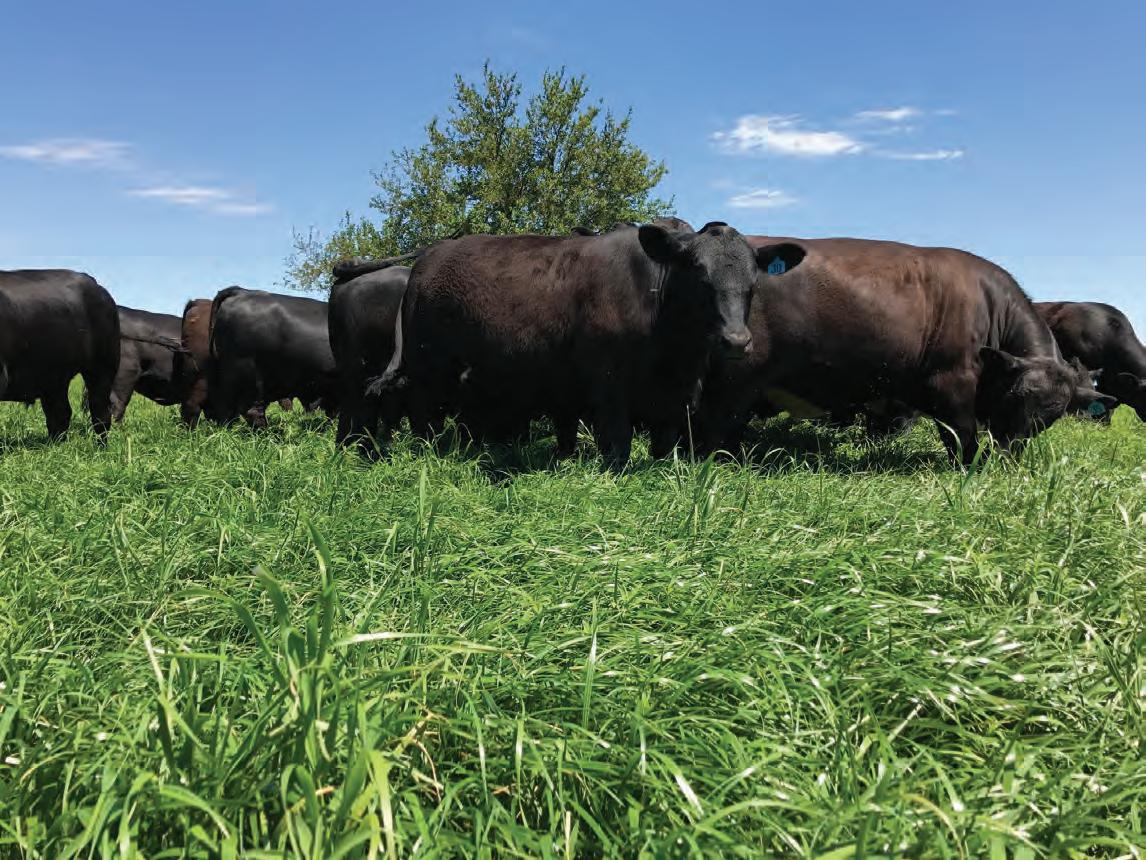
Plant rest and recovery periods need to be managed and planned. Grazing events should be short, usually less than three to four days in a given area, typically with the ability to move cattle daily or multiple times a day. Allow some pastures to accumulate peak production before being grazed with the highest stock density possible, moving livestock to fresh forage at least daily. This allows livestock to graze the highest quality material and trample the rest on the surface to feed the soil organisms.
It is with the higher stock density grazing that manure and urine are more evenly deposited across grazed areas, providing additional nutrients to the soil and soil organisms. In addition, grazing multiple species of livestock — cattle, sheep, and goats for starters, if the grazing lands have the forages to complement these livestock — is desirable in regenerative ranching. Different livestock can be added in stages to provide benefits to the land and additional revenue streams.
Concerns of time and infrastructure costs limit adoption. However, adoption of regenerative practices is made easier if the farmer or rancher begins by making use of what is already present and committing to one easy-to-manage area.
Start small
The bottom line is regenerative ranching doesn’t have to be difficult to adopt. The transition to regenerative does not have to be an “all or nothing” approach. Most progressive producers with a land stewardship ethic are doing much of what regenerative ranchers are doing. The full adoption of regenerative ranching requires starting where one can fully commit to an area within their operation and apply practices in alignment with the soil health principles.
If you’re still questioning whether regenerative ranching is worthy of consideration, ask yourself these questions: Is your operation more financially sound today than 10 years ago? Are your soils considerably more productive with less inputs today than they were 10 years ago? Is your operation able to add a son or daughter to the operation, and would you be excited to have them join the operation if it could?
If you answered “no” to any or all of these questions, you might consider regenerative ranching because those producers are answering “yes” to the same questions. •

BETTER GENETICS - MORE SUSTAINABILITY.
AN AMERICAN SEED COMPANY
FARMER OWNED
HIGH YIELDING LATEST MATURITY DISEASE RESISTANCE
HI-MAG GENETICS NON-TOXIC TALL FESCUE ARK SHIELD ENDOPHYTE HIGH YIELDING INTERMEDIATE TYPE EXCELLENT PERSISTENCE

HYBRID RYEGRASS HYBRID RYEGRASS SUPERIOR YIELDS EXCELLENT QUALITY HIGH YIELDING DISEASE RESISTANT EXCELLENT PERSISTENCE
RELIEVES COMPACTION NITROGEN SCAVENGER CERTIFIED GENETIC PURITY
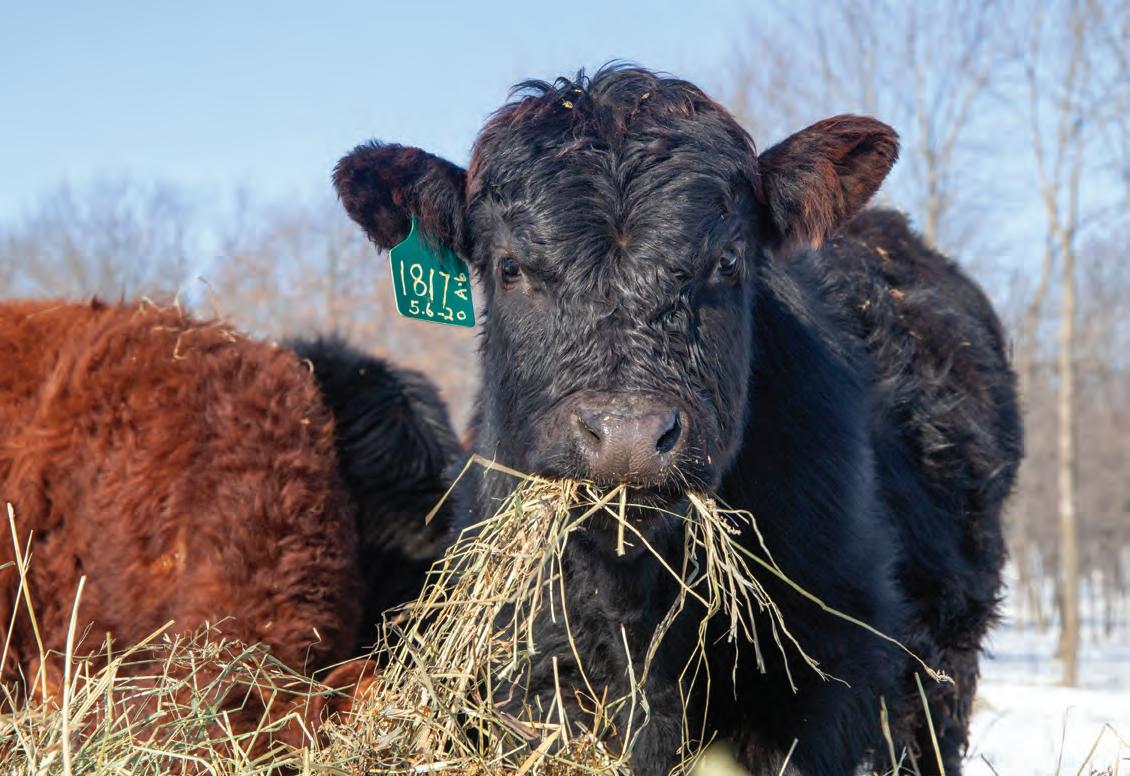
The optimum amount of time to feed hay is governed by hay cost, cow-calf profitability, and farm cost structure.
FIND THE HAY-FEEDING DAYS SWEET SPOT
by Greg Halich
IN THE April/May 2021 issue of Hay & Forage Grower, I wrote an article titled “How hay became a four-letter word.” The basic message was that there is a trade off between hay feeding and stocking rate: Trying to reduce the amount of hay fed will require a reduction in stocking rate, assuming that management is held constant.
Reduced hay feeding will lower costs, but the corresponding decline in stocking rate will reduce revenues. Thus, we need to account for both factors to determine how much hay feeding will be most profitable. This article goes into the details of that trade-off and provides multiple scenarios that allow farms in the Fescue Belt to determine the most profitable hay-feeding period given their specific situation.
Three factors have the most impact on the most profitable hay-feeding period: net hay cost, general cow-calf profitability, and overall farm cost structure. Each will be discussed and accounted for in this analysis.
Net hay cost
The effect of hay prices should be obvious. With high prices, the most profitable feeding period will shift lower, and with low hay prices, it will shift higher. The base hay cost also needs to be adjusted for the fertilizer value of feeding the hay, which will range from a low of $0 to $5 per ton with most conventional hay feeding practices, to as much as $20 to $25 per ton if feeding by unrolling hay or bale grazing. Subtract this fertilizer value from the gross hay cost to get net hay cost. For example, if the cost of your hay is estimated at $80 per ton, and the nutrient value of feeding this hay is estimated at $10
GREG HALICH
The author is an extension agricultural economist with the University of Kentucky and a grass-finishing cattle farmer.
per ton, the net hay cost would be $70 per ton.
Cow profitability
As discussed in the previous article, if high calf prices are expected into the foreseeable future, we would want to boost the stocking rate, and vice versa. High calf prices means high overall profitability, and reducing our hay feeding by lowering our stocking rate results in a severe loss on the revenue side. The loss of revenue would generally be greater than the cost savings from reduced hay feeding when base profitability is high.
When evaluating cow profitability relative to stocking rate, also consider costs that will change as additional cows are added or subtracted. A good example of a cost that should not be included is depreciation and interest on equipment and facilities. We could have 20 cows or 40 cows on a 100-acre farm, and these overall depreciation/interest costs do not change. Only those costs that change as we add or subtract cows will be considered.
The main costs that fall into this second category are feed costs (hay), mineral, vet/medicine, breeding, marketing, and cow depreciation/interest. Labor is an example of a cost that falls into both categories. If the number of cows on that same farm jumped from 20 to 40, our labor costs rise, but not double. See Table 1 for details of these costs used in the analysis. Hay cost per cow will change depending on the scenario and is also adjusted by an additional labor/machinery cost of $7.50 per ton for feeding compared to grazing for the same equivalent number of days.
Farm costs
Costs will vary by farm, and other factors being equal, those farms with lower cost structures will be more profitable compared to farms with higher cost structures, and vice versa. A $25 savings in costs would have the same effect as a $25 boost in revenues from a higher calf market. This makes the most profitable hay-feeding period for a farm with a low cost structure (more profitable) longer than a farm with a higher cost structure, holding hay costs constant, which is accounted for separately.
Crunching numbers
to be made outside of this region. These are discussed in the last section.
The analysis assumes a 100-acre farm that has all of its land in pasture and either has its hay ground at a separate location or buys its hay. The base stocking rate is 57 cows on this farm for a hay feeding period of 150 days (assumes good management). Two stocking rate scenarios are evaluated where hay-feeding days drop 30 days at a time: 1. Stocking rate gradually decreases down to 28.5 cows for zero hay feeding days (50% stocking rate compared to the base). 2. Stocking rate gradually falls to 23.6 cows for zero hay feeding days (41% stocking rate compared to the base).
Two stocking rate scenarios are presented in Table 2 and Table 3 so that the user can choose which relative stocking rate decrease seems more realistic given their situation.
The average weighted steer/heifer price is $1.40 per pound for a 525pound calf. Weaning weight and weaning rate change by the hay feeding period/stocking rate and gradually rise by 40 pounds and 3 percentage points respectively, going from 150 to zero hay-feeding days.
Tables 2 and 3 show the profit change for the various hay-feeding days compared to the base stocking rate for 150 hay-feeding days. Three net hay cost scenarios are presented: $50 per ton, $60 per ton, and $70 per ton, which represent the cost to produce or buy the hay, less any nutrient value the user derives from feeding the hay.
The numbers in the table are interpreted as the profit change relative to the 150 hay-feeding days scenario. For example, in Table 2, using the $60 per ton net hay price, the 90 hay-feeding days scenario shows a plus $2,900 value. This means that lowering the stocking rate to reduce hay feeding from 150 to 90 days a year boosts profit on the farm by $2,900 (with the scenario of $60 per ton net hay). If, for example, overall profitability was minus $1,000 for the 150-day hay feeding scenario, overall profitability for the 90-day hay feeding scenario would be -$1,000 + $2,900 = $1,900.
Again, the numbers in the table are relative to the 150-day hay-feeding scenario and not absolute profitability numbers. With the $60 per ton net hay price, the 60-day hay-feeding period had the highest relative profitability using Table 2, and the 90-day hay-feeding period had the highest relative profitability using Table 3. The hay feeding day levels where relative profitability is highest within a few hundred dollars are shaded in each table. As previously noted, two tables are presented so that you can choose which relative stocking rate is more appropriate based on your conditions. Use that table and then the net hay price that best represents your situation to determine what hay feeding period will be most profitable. If you are unsure which table is best, I would average the two tables. Summarizing the results for the most profitable hay-feeding days using the average of these two tables: $50 per ton net hay 90 hay-feeding days $60 per ton net hay 60 to 90 hay-feeding days $70 per ton net hay 30 to 60 hay-feeding days
A few results are worth highlighting: 1. Feeding hay for 150 days was never close to being most profitable.
continued on following page >>>
Table 1: Annual additional costs per cow as stocking rate changes (Note: Hay cost changes by scenario)
Labor (variable/cow) $15
Mineral $30
Vet $20
Breeding $40
Marketing/trucking $35
Other $20
Cow depreciation/interest $125
Total specified costs $285
As an example, if your net hay cost is estimated at $70 per ton, you would boost profitability by $4,500 (Table 2) or $3,200 (Table 3) per year by adjusting the stocking rate to feed 60 days of hay per year, on average, compared to 150 days. On a 100-acre farm, this is a significant profit improvement. 2. Reducing your stocking rate to reach zero hay-feeding days was never most profitable and was only close to being most profitable in two of the six scenarios. 3. In most scenarios, 60 to 90 days of hay feeding were either the most profitable or very close to being the most profitable. Thus, my general recommendation for most farms in the Fescue Belt is to strive for 60 to 90 days of hay feeding in most years.
Make adjustments
Obviously, different farms will have different cost structures and different regions will have different prices for the same calves. For example, a calf in Missouri will likely sell for 10 cents more per pound than that same calf in Virginia, given their proximity to the major feedlots. You can modify the results in the table if your price outlook is different than the 525-pound steer or heifer average of $1.40 per pound. Make a rough adjustment of two weeks for each 10 cents per pound change in price. As an example, if the table says 90 days of hay feeding would be most profitable, and if your price outlook was $1.50 per pound, the optimal hay-feeding days would lengthen to roughly 105 days. If your price outlook was $1.30 per pound, then the optimal hay-feeding days shortens to about 75 days.
This same adjustment applies to differences from the $285 additional costs per cow used in this analysis (see Table 1). Make a rough adjustment of two weeks for each $45 change from this base cost. For example, if your costs are $45 higher than the estimated $285, shorten the number of hay-feeding days by roughly 15 days from what is recommended in the table.
Finally, if you make your own hay, do not include your fixed costs of production for the haymaking equipment since these costs will not change as you make less or more hay needed for a change in stocking rate. If you do not have good variable cost estimates, I currently recommend using $60 to $75 per ton.
Different place, different time
Every region has its own unique dynamics related to growing season, forage growth curves, and the ability to stockpile forage for effective winter grazing. What works best in the Fescue Belt may not necessarily work best in other regions. For example, the most profitable hay-feeding period will be longer as you head north from this region, at least in the eastern U.S. In the western U.S., the results could likely go in both directions. In areas in the West with relatively low snowfall and where forages can stockpile well for winter grazing, optimal hay-feeding days would likely be lower.
In the previous article, it was noted that the 2006 to 2010 era had extremely low calf prices and that the most profitable hay feeding period would have been lower during that time. The same analysis was conducted for that time period by adjusting calf prices to 90 cents per pound for the 525-pound steer or heifer average and by adjusting the additional costs per cow downward to $225. The results: Depending on net hay cost, zero to 30 hay-feeding days was the most profitable strategy during that time frame, just as Jim Gerrish recommended in his 2010 book “Kick the hay habit.”
Having a high stocking rate and corresponding high hay-feeding period would have been very costly. For example, with a $60 per ton net cost, profitability would have been roughly $7,000 lower on the 100-acre farm at 150 hay-feeding days compared to 30 days. •
Table 2: Stocking rate drops slower as hay-feeding days decrease (Profit change compared to 150 hay-feeding days)
Hay-feeding days Stocking rate (Cows per 100 acres) $50/ton net hay $60/ton net hay $70/ton net hay
150 57.0 - - -
120
90
60 49.8
44.1
38.1 $1,100 $2,000 $2,100 $1,600 $2,900 $3,300
30 32.6 $1,800 $3,200
0 28.5 $1,200 $2,900
Base scenario: $1.40 per pound for steer/heifer 525 pounds; $285 additional cost/cow (less hay); $7.50/ton higher labor/machinery cost for feeding hay. $2,100 $3,700 $4,500 $4,700 $4,500
Table 3: Stocking rate drops quicker as hay-feeding days decrease (Profit change compared to 150 hay-feeding days)
Hay-feeding days Stocking rate (cows per 100 acres) $50/ton net hay $60/ton net hay $70/ton net hay
150 57.0 - - -
120
90
60
30 49.8
41.5
33.7
28.0 $1,100 $1,300 $700 $100 -$700 $1,600 $2,200 $1,900 $1,600 $900 $2,100 $3,100 $3,200 $3,000 $2,500
Farm Progress Show
August 31 to September 2, Decatur, Ill. Details: farmprogressshow.com
Southeastern Hay Short Course
September 2, Lake City, Fla. Details: bit.ly/HFG-SEHSC
Husker Harvest Days
September 14 to 16, Grand Island, Neb. Details: huskerharvestdays.com
National Hay Association Convention
September 15 to 18, San Diego, Calif. Details: nationalhay.org
Alfalfa in the South Workshop
Kentucky Fall Grazing School
September 22 and 23, Versailles, Ky. Details: forages.ca.uky.edu/Events
Alfalfa & Forage Field Day
World Dairy Expo World Forage Analysis Superbowl
Sept. 28 to Oct. 2, Madison, Wis. Hay crop entries due Aug. 26 Details: bit.ly/HFG-WFAS
Kentucky Grazing Conference October 26, 27, or 28 (3 locations) Details: forages.ca.uky.edu/Events
Sunbelt Ag Expo Southeastern Hay Contest
October 19 to 21, Moultrie, Ga. Hay contest entries due September 1 Details: bit.ly/HFG-SHC
Western Alfalfa & Forage Symposium
November 16 to 18, Reno, Nev. Details: calhay.org/symposium
Alabama Forage Conference December 2, Russellville, Ala. Details: bit.ly/HFG-ALforage
Hay prices are holding
Hay prices remained strong throughout the heart of the harvest season, especially in areas where drought has reduced both hay and pasture yields. Alfalfa hay exports were trending 3.5% behind last year through May, but China remains a strong buyer. There’s no reason to believe hay markets will soften anytime soon.
The USDA’s Acreage report pegs 2021 hay acres at 51.5 million, down about 1% from last year. Alfalfa acres retreated less than 1% to 16.1 million acres. Final estimates won’t be available until January 2022.
The prices below are primarily from USDA hay market reports as of the beginning of mid-July. Prices are FOB barn/stack unless otherwise noted. •
For weekly updated hay prices, go to “USDA Hay Prices” at hayandforage.com
Supreme-quality alfalfa Price $/ton Oregon (Lake County) California (intermountain) California (northern SJV) 310 (d) Pennsylvania (southeast) 248-280 South Dakota-lrb
225 200-250 200
Idaho (south central) Iowa (Rock Valley)-lrb Kansas (northeast) Kansas (southeast) Minnesota (Sauk Centre) Missouri New Mexico (eastern) South Dakota South Dakota (Corsica)-lrb Texas (Panhandle) 250 Texas (Panhandle) 230-240(d)
213 Washington 200-225 Wisconsin (Lancaster)-lrb
235 130-180 200-280 Fair-quality alfalfa Price $/ton 280-310 Colorado (southeast) 180 (d)
200-250 Idaho (western) 200-210
250 Iowa (Rock Valley)-lrb 250 Kansas (north central)-lrb
123 100-140
245 Kansas (northeast) 290-300(d) Missouri 110-150 100-125
Texas (west)-ssb 300-315 New Mexico (southern) 160
Washington 240 (d) South Dakota (Corsica)-lrb 145-155
Wyoming (eastern)
225 Washington Premium-quality alfalfa Price $/ton Wisconsin (Lancaster) 200 115
California (intermountain) 280-285 (d) Bermudagrass hay Price $/ton
California (central SJV)-ssb 265 Alabama-Premium lrb 125-133
Colorado (southeast) 240-260 Alabama-Premium ssb 180-300
Idaho (south central) Iowa (Rock Valley) Kansas (south central) Kansas (southeast) Minnesota (Sauk Centre) Minnesota (Pipestone)-ssb Missouri
240 California (southeast)-Good ssb 188-195 Oklahoma (north central)-Supreme lrb 177 Texas (central)-Premium ssb 200 Texas (south)-Fair/Good lrb 265-290 Bromegrass hay 200 Kansas (northeast)-Good lrb 160-200 Kansas (southeast)-Premium ssb
Montana-ssb Nebraska (eastern) 325 Orchardgrass hay 225 California (intermountain)-Good ssb
New Mexico (southeast) Oklahoma (northwest) Oregon (Crook-Wasco)-ssb Pennsylvania (southeast)-ssb South Dakota Texas (Panhandle) Wisconsin (Lancaster) 260-270(d) Oregon (Crook-Wasco)-Premium ssb 200 Oregon (Harney)-Good 260-265 Pennsylvania (southeast)-Good 250-310 Pennsylvania (southeast)-Fair 200-225 Wyoming (western)-Premium ssb 260-280(d) Timothy hay 285 California (intermountain)-Premium ssb
Wyoming (western)-ssb
220-240 Montana-Good/Premium ssb Good-quality alfalfa Price $/ton Oregon (eastern)-Premium California (central SJV) 230 Pennsylvania (southeast)-Premium
California (northern SJV) California (southeast) 225-250 Pennsylvania (southeast)-Good-ssb 210-220 Washington-Premium ssb
Colorado (northeast) 180 (d) Oat hay
Idaho (south central) 220 California (northern SJV)-Good ssb 200 130 280-330 120-130
Price $/ton
85-95 135
Price $/ton
250 (d) 260-285 200 150-220 85-155 230
Price $/ton
210 360 255 270 200-265 340
Price $/ton
190
Idaho (western) Iowa (Rock Valley)-lrb Kansas (north central) Minnesota (Sauk Centre)-lrb Minnesota (Pipestone) Missouri Montana
240 Colorado (southeast)-Premium 145-160 Iowa-Good/Premium lrb 165-200 Kansas (south central)-Good 220-260 South Dakota (Corsica)-lrb 200 Straw 120-160 Iowa (Rock Valley) 350 Kansas (south central) 145 85 120 130
Price $/ton
93-118 120 (d)
Nebraska (central)-lrb 115 Minnesota (Sauk Centre)
Nebraska (Platte Valley)-lrb Oklahoma (western)-lrb Oregon (Crook-Wasco)
120-130 Montana 150 Pennsylvania (southeast)-ssb 265 South Dakota Abbreviations: d=delivered, lrb=large round bales, ssb=small square bales, o=organic
70-100 100-150 185-190 110

DE46905
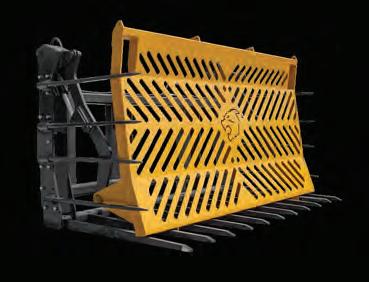

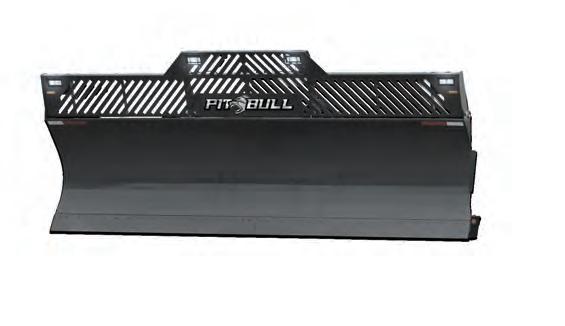
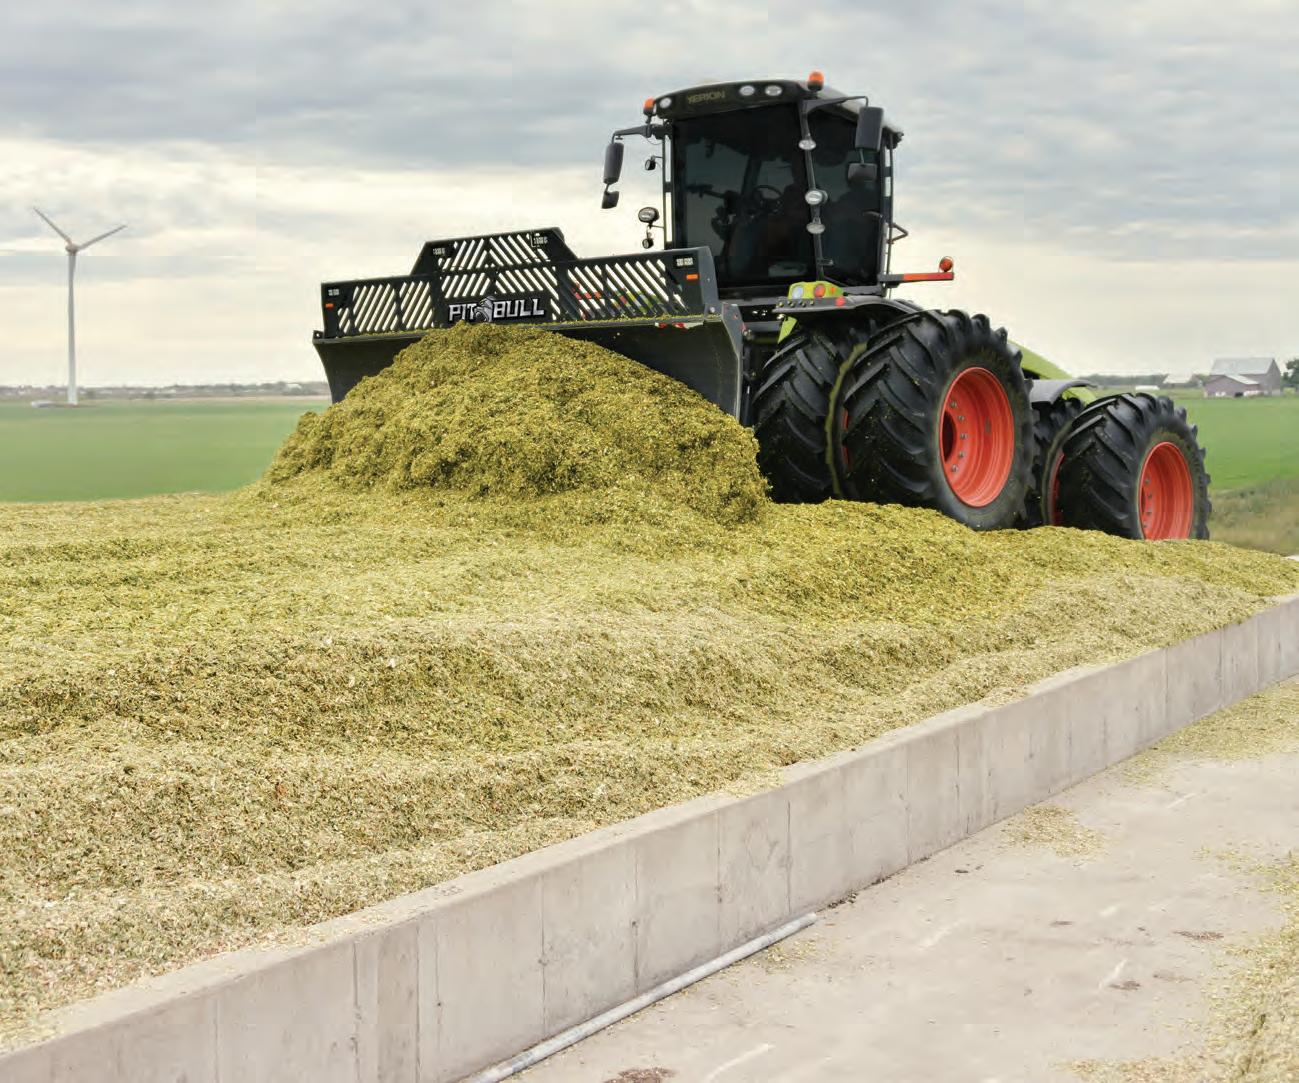
Scoop, lift and push with the new Silage Rake from Pitbull. Increasing operator precision when building your bunker, Silage Rakes allow you to carry material like a bucket or push large loads like a blade. With a Silage Rake operators can carry the load up the bunker slowly pushing material off the tines placing material without contacting or disrupting material already packed. Push, pile and perform with the class-leading features of Pitbull dozer blades. Greater blade control, easy quick attach and the most compact mounting system available make Pitbull the top dog for silage, dirt and snow applications. Pitbull Blades are available in Four Wheel Drive Tractor Models and Front Wheel Assist Tractor Models. Built using T1 grade steel with AR400 wear points, Pitbull Blades are made in Canada and come with a 2-Year Warranty.
Toll Free: 1-888-856-6613 | tubeline.ca
Silage Quality: Efficient Acetic Acid Production
Corn silage season is upon us and growers are doing all they can to make sure their corn silage is at optimal quality. As growers check for quality, there are a few areas they should pay special attention to. One quality check should be the fermentation process. To make sure the fermentation process went well for silage, growers can look at fermentation profiles and pH. When it comes to fermentation, two of our main focuses with corn silage are what occurs during feed out and how aerobically stable the feed is. Spoilage microorganisms like yeasts and molds can be responsible for aerobic instability and losses of valuable nutrients and dry matter. A strong inhibitor of yeasts and molds is acetic acid. Acetic acid can provide better aerobic stability and protect against DM and energy losses during feed-out.

The efficiency of acetic acid production is determined by the types of microorganisms that dominate the fermentation. Inefficient acetic acid production comes from “wild” fermentations that are driven by microorganisms like Enterobacteria. Along with degrading the quality of the silage by using up valuable nutrients, these microorganisms can produce other metabolites that can be toxic and affect intake.
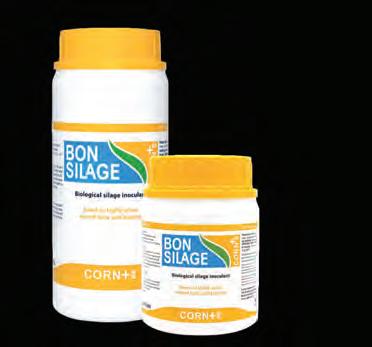
Though it is clear that acetic acid is beneficial to growers, it can be difficult to determine where the acid is coming from and the efficiency of that production. The solution to obtaining acetic acid levels efficiently is to use an inoculant containing a microorganism like Lactobacillus buchneri. These heterofermentative microorganisms can dominate the fermentation and efficiently produce acetic acid with minimal DM and nutrient losses. Controlling the fermentation with a researchproven inoculant can help us dominate the wild population of microorganisms and produce high-quality silage. During a batch fermentation trial, we evaluated the fermentation profile of corn silage samples treated with BONSILAGE CORN+ (BS CORN+) and BONSILAGE PRO (BS PRO) compared to corn silage not treated with an inoculant. The average DM of samples tested was 32.7% ± 0.55. The fermentation profile is characterized by pH, lactic acid, acetic acid, ethanol, and 1,2-propanediol.
FERMENTATION PROFILE DAY 90
Mean pH fermentation profile in % DM
8.00
7.00
6.00
5.00
4.00
3.00
2.00
1.00
0.00
KEY
CONTROL BS CORN+ BS PRO
pH Lactic acid Acetic acid Ethanol 1,2-Propandiol
Figure 1. The pH and fermentation profile of corn silage ensiled for 90 days to determine the effects of innoculation with BS CORN+ and BS PRO against silage that was not inoculated (Control).
When comparing BS PRO that contains a combination of Lb. brevis, Lb. plantarum, and Lb. buchneri at an application rate of 150,000 cfu/g of fresh forage the BS PRO was able to successfully dominate the fermentation and produce more of both lactic and acetic acid (6.84% DM and 2.21% DM). Higher levels of efficiently produced acetic acid not only provide better protection against reheating but allows for the delivery of high-quality silage to the cow.
BS CORN+, our premium treatment for corn silage contains a combination of Lb. plantarum and Lb. buchneri at an application rate of 500,000 cfu/g of fresh forage. Due to this high concentration of Lb. buchneri, there is a slightly lower amount of lactic acid compared to control. The Lb. buchneri efficiently converted lactic acid to acetic acid to obtain higher levels of acetic acid than the control (3.72% DM vs. 1.42% DM). This provides better aerobic stability and protection against dry matter losses during feed-out. Within the BS CORN+ formulation, the Lb. buchneri strain present can produce significant amounts of 1,2-propanediol or more commonly known as propylene glycol (PG).
BS CORN+ and BS PRO efficiently produce significant amounts of acetic acid to inhibit yeasts and molds and protect against reheating. Using a research-proven inoculant like BS CORN+ or BS PRO will take your silage to the next level by dominating the fermentation and creating a high-quality end-product.
Visit BONSILAGEUSA.com to learn more.


