Published by W.D. Hoard & Sons Co. November | 2021
of Nutr
Put it in a pellet 8
Partners in progress
Clear the air with zeolites
Journal
ient Management
12
20
EAST Jim Dewitt
1-630-750-3482
j.dewitt@bauer-at.com
MIDWEST Trey Poteat 1-219-561-3837
t.poteat@bauer-at.com
WEST Jeff Moeggenberg
1-630-334-1913
j.moeggenberg@bauer-at.com
SALES DIRECTOR Ray Francis 1-219-229-2066
r.francis@bauer-at.com
PARTS/OPERATIONS Rob Hultgren 1-800-922-8375


r.hultgren@bauer-at.com
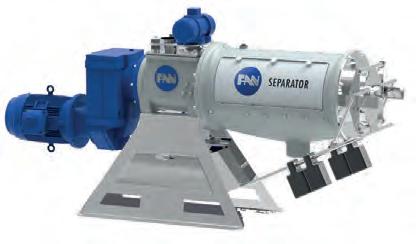
WASTE WATER TREATMENT TURNING MANURE INTO HIGH QUALITY BEDDING TURNING LIQUID GOLD INTO ENRICHED BEDDING 90 YEARS OF WORLD WIDE IRRIGATION AND SLURRY TECHNOLOGY YEARS PORTABLE IRRIGATION Fan produces bedding material with a dry matter content of up to 38% in solids. New Dealership Inquiries Welcome BAUER North America Inc. 107 Eastwood Road, Michigan City, IN 46360 • 1-800-922-8375 • bnasales@bauer-at.com Call the FAN/ BAUER boys: GREEN BEDDING® SEPARATOR, MIXER, SLURRY & WATER PUMPS
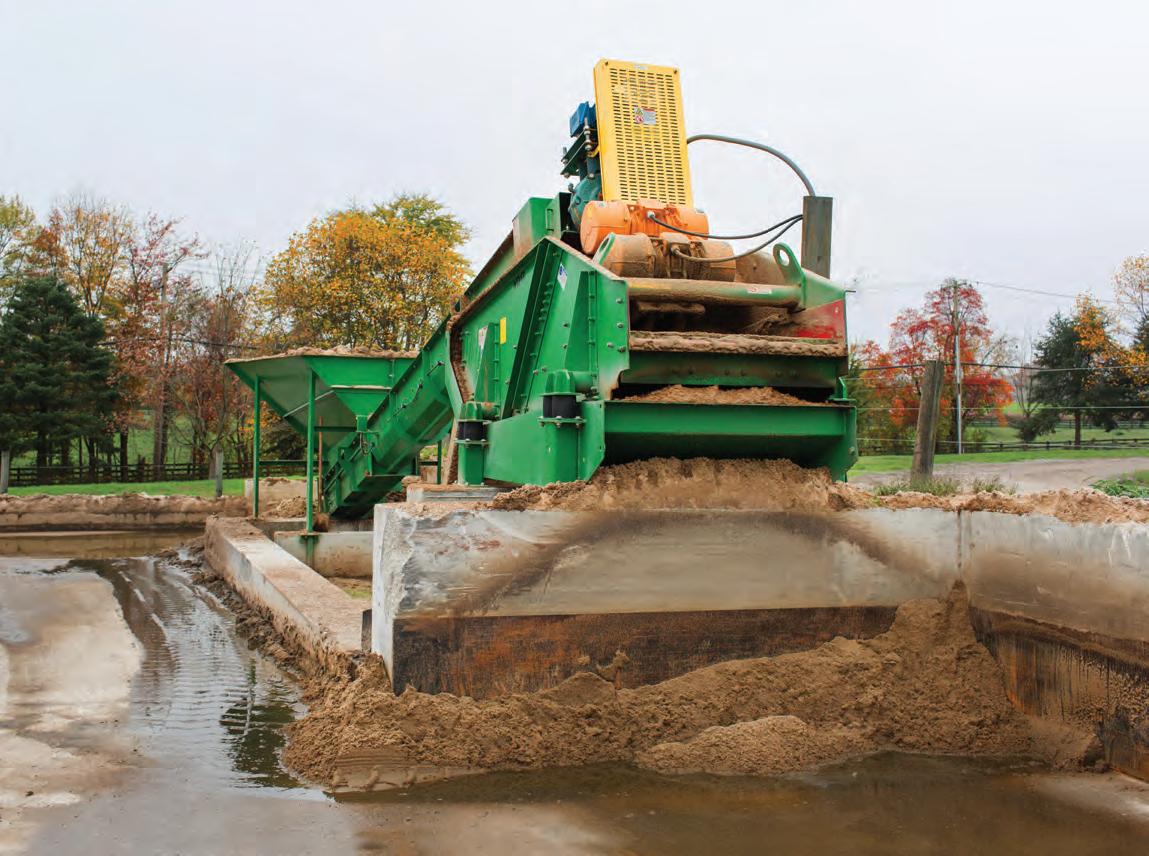
This fourth-generation dairy in Pennsylvania follows a comprehensive nutrient management program, using conservation practices such as no-till planting, cover crops, buffer strips, and water recycling. Sand is removed from the manure using this separator, put into rows, and tilled regularly so that it can be reused as bedding in the freestalls.

Journal of Nutr
MANAGING EDITOR Abby Bauer
ART DIRECTOR Todd Garrett
EDITORIAL COORDINATOR
Jennifer Yurs
DIRECTOR OF MARKETING
John Mansavage
ADVERTISING SALES
Andy Dellava adellava@hoards.com
Becky Krammer bkramer@hoards.com
Jane Griswold jgriswold@hoards.com
Jenna Zilverberg jzilverberg@hayandforage.com
Kim Zilverberg kzilverberg@hayandforage.com
ADVERTISING COORDINATOR
Patti Kressin pkressin@hoards.com
W.D. HOARD & SONS
PRESIDENT Brian V. Knox
EDITORIAL OFFICE
28 Milwaukee Ave. West Fort Atkinson, WI 53538
WEBSITE www.jofnm.com
EMAIL info@jofnm.com
PHONE (920) 563-5551
Journal of Nutrient Management (ISSN# 26902516) is published four times annually in February, May, August, and November by W.D. Hoard & Sons Company, 28 Milwaukee Ave. West, Fort Atkinson, Wisconsin 53538 Tel: (920) 563-5551. Email: info@ jofnm.com Website: www.jofnm.com. Postmaster: Send address corrections to: Journal of Nutrient Management, PO Box 801, Fort Atkinson, Wisconsin 53538-0801. Tel: (920) 563-5551. Email: info@ jofnm.com. Subscription Rates: Free and controlled circulation to qualified subscribers. For Subscriber Services contact: Journal of Nutrient Management, PO Box 801, Fort Atkinson, Wisconsin 53538, call (920) 563-5551, Email:info@jofnm.com.
Copyright © 2021 W.D. Hoard & Sons Company. ALL RIGHTS RESERVED. Content may not be reproduced or used for any commercial activity without express written consent from W. D. Hoard & Sons Company.
jofnm.com November 2021 | Journal of Nutrient Management | 3
ient
CONTENTS Find us online at: www.jofnm.com twitter.com/JournalofNM facebook.com/JournalofNM ON THE COVER
Management
First Thoughts . . . . . . . . . . . . 4 Policy Watch . . . . . . . . . . . . . 5 In the Field 6 Manure Minute 17 On the Move . . . . . . . . . . . . 18 Fresh Paint . . . . . . . . . . . . . 24 Places to Be . . . . . . . . . . . . 25 Nutrient Insights 26 DEPARTMENTS Volume 2 | No. 4 Partners in progress 12 4 6 8 10 16 18 20 22 26 The perfect package Nitrogen in, nitrogen out Put it in a pellet Find the right fit for your team Get the sample you need When and where do manure spills occur? Clear the air with zeolites Variability is the rule Manure management is not one size fits all
Photo by Andrea Haines, Union Bridge, Md.
Abby Bauer Managing Editor

THE PERFECT PACKAGE
We all know that what’s on the inside is what really counts. Still, presentation and packaging often make a big difference in how something is perceived and accepted. And sometimes, packaging impacts quality, too. A few weeks into the school year, I received a note from my child’s pre-kindergarten teacher. She explained that my daughter did not want to drink milk at snack time. I was surprised to hear this, as my daughter is a good milk drinker at home. Plus, with personal connections to the dairy industry, I certainly am an advocate of milk.
I asked my daughter why she did not drink milk with her snack at school, and she simply said she did not like how it tasted from the carton. At just 4 years old, she already noticed the different taste between types of packaging and was making a consumption choice.
Milk packaging has been a topic of conversation for years, yet in many schools, cardboard cartons are still the standard. Milk consumption in children has been on a decline for decades, and one can’t help but wonder if milk served in plastic jugs could help reverse the trend by providing this nutritious beverage in a more desirable way.
The debate about milk, or any food packaging for that matter, is a discussion for another time and for the pages of another magazine. Still, there are parallels when it comes to how we “package” and promote manure.
Good marketers are able to dress up an item that isn’t all that exciting in a way that makes people want to buy it. Farmers in general are not marketers, and at times, our industry struggles to promote our products and the practices that are done on farms.
In its purest form, manure is not that appealing to the eyes or the nose, especially to someone outside of agriculture. However, this by-product is extremely valuable. We just need to package it in ways that provide the most benefit for the farmer and help non-farmers understand its worth.
Great strides have been made to develop prod-
ucts and technologies that help farms reduce manure volume, gas emissions, and odor. The continuous goal is to find ways to make manure easier to handle yet still be cost effective.
One technology example highlighted in this issue is pelletizing manure, which condenses the nutrients in a form that is easier to transport. This is an expensive process that won’t work on every farm, but it is one opportunity to make manure more palatable for both the end user and the casual observer. Learn more on page 8.
Of course, not all packaging comes in the form of pretty wrapping paper and fancy bows. Sometimes, packaging is more conceptual and involves building a product or brand’s image.
Farmers can say they are using sustainable practices, but those words may ring hollow if the public doesn’t know what that means or if the results aren’t tangible. That is why helping the public understand general farming practices is a goal of the Lafayette Ag Stewardship Alliance (LASA), a farmer-led conservation group featured on page 12.
The organization’s leader, Jim Winn, said that the group has made an impact locally in the four year’s since its inception. More recently, LASA’s collaboration with food processors Grande Cheese Company and Nestle has opened doors so the benefits of conservation practices and environmental stewardship reaches consumers, too. Who knows, maybe someday it will be commonplace for shoppers to pick up a candy bar with a label that indicates its ingredients came from a farm committed to sustainable agricultural efforts.
As this year comes to a close, thank you for your readership of the Journal of Nutrient Management We hope the pages of our magazine have brought worthwhile insights to your farm. We send our best wishes for a happy and healthy holiday season.
Until next time,

4 | Journal of Nutrient Management | November 2021 jofnm.com Let us know your thoughts. Write Managing Editor Abby Bauer, 28 Milwaukee Ave. West, P.O. Box 801, Fort Atkinson, WI 53538; call: 920-563-5551; or email: abauer@jofnm.com. FIRST THOUGHTS
WASHINGTON, D.C.
Senate Democrats released an overview of the $28 million that would be allocated to conservation efforts in their proposed $3.5 trillion spending bill. Plans for this funding include:
• $9 billion for the Environmental Quality Incentives Program (EQIP) to specifically expand funding for the implementation of on-farm conservation practices.
• $7.5 billion for the Regional Conservation Partnerships Program (RCPP), which supports locally led conservation.
• $4 billion for the Conservation Security Program (CSP), which focuses on wholefarm conservation systems.


• $1.5 billion for the Agricultural Conservation Easement Program.
• $5 billion for a new Farm Service Agency (FSA) cover crop initiative.
• $200 million to go toward Conservation Technical Assistance.
• $600 million for measuring the benefits of conservation practices on greenhouse gas emissions.
If all measures are approved, this investment would roughly double the funding dedicated to conservation practices in the current farm bill.
THE NETHERLANDS
The Netherlands is home to 1.57 million dairy cows, but proposed legislation could cut that number by 25% to 30%. Since the country’s highest administrative court ruled that the Netherlands was not reducing excess nitrogen production as was required by a European Union law, measures have been taken to cut nitrogen emissions. This most recent proposal would remove between 395,000 and 474,000 Dutch dairy cows, adding to the 12.5% reduction in herd size already experienced since phosphate-reducing legislation was imposed in 2017.
The country pledged to reduce total greenhouse gas emissions 49% by 2030 (compared to 1990) and 95% by 2050. This will be achieved partially by capping on-farm emissions of nitrogen and phosphate. Even if the legislation is not passed, it is estimated that the Dutch dairy herd may still shrink by 10% over the next five years as farmers leave the industry, trade their manure quota to other dairies, or move to countries that are more welcoming to dairy farming.
expanding the current rule of planting cover crops in the summer months.
Furthermore, if manure is applied during the first two weeks of October, farmers must implement one of four approved nitrogen management practices.
Republican leaders in the state initially proposed a complete repeal of the new winter and fall manure regulations and cover crop requirements, but after negotiations, only the October regulations were removed. The changes were part of a large bill, including a broad swath of environmental policies, that was passed in August.
However, this was a short-term win for Minnesota legislators. The Environmental Protection Agency (EPA) stepped in and exercised its right to veto legislation that conflicts with clean water laws. This move reinstated the original permit written by MPCA, including the manure application and cover crop expectations. The permit is written and implemented by the state but is required under federal clean water laws.
IDAHO
The 9th Circuit Court of Appeals struck down Idaho’s concentrated animal feeding operation (CAFO) National Pollutant Discharge Elimination System (NPDES) permit due to a lack of monitoring for underground discharges and potential discharges from dry weather land applications. This took place after the permit was challenged in federal court by two environmental groups, the Food and Water Watch and the Snake River Waterkeepers. The permit was sent back to the Environmental Protection Agency (EPA) to correct these concerns.

MINNESOTA
Restrictions set by the Minnesota Pollution Control Agency (MPCA) went into effect last February as part of the revised Feedlot General Permit, which is updated every five years. Agriculture groups in the state opposed the new restrictions, though, contending they were based on incomplete science and data from only portions of the state.
The most recent update to the permit for concentrated animal feeding operations (CAFOs) bans farms from applying solid manure in March and limits application in February. In addition, it requires permitted farmers to plant cover crops in September,
POLICY WATCH jofnm.com November 2021 | Journal of Nutrient Management | 5 Introducing LS3 We take solid separation to the next level! Fond du Lac, WI 54937 • MADE IN USA • Dry matter to 38% • Easy maintenance • Returns quality water for flushing • Flexible screen design . . . allows for maximum quality bedding
Mega-durable auger design
Bearing mount at outlet to increase life of screens/auger
Heavy duty stainless steel frame structure for the corrosive environment
15 Horse power motor Contact us: 1-920-238-5460 www.al-ins.com Aaron.Kuhls@al-ins.com US Screen Co.
•
•
•
•
NITROGEN IN, NITROGEN OUT
Consider this simple approach for on-farm nitrogen budgeting.
by Ryan Heiderman
Creating a simple budget of inputs and outputs goes a long way toward understanding the complexity of on-farm nutrient flows. The various pools of nutrients in cropland can identify moments where management interventions can prevent unnecessary additions or excessive losses from the system.
When it comes to on-farm nutrient planning, achieving a balance between crop needs and environmental losses is critical to ensuring productivity and sustainability. For six years, the UW-Madison Division of Extension Discovery Farms Program has been collaborating with Wisconsin farmers and producers to collect data about on-farm nitrogen use across the state through the Nitrogen Use Efficiency (NUE) project.
Complexities of the cycle
Nitrogen (N) has a complex cycle and takes on many forms. N is transformed and transported within the farm system through a variety of processes (Figure 1). The fate of N is highly affected by on-farm factors such as cropping system, management practices, soil type, and hydrology, as well as external factors such as weather conditions.
There are many pathways for N loss from a cropping system, including:
Volatilization — the loss of ammonia gas when manure and fertilizers are left on the soil surface.
Denitrification — the loss of N in the reduction of nitrate to gaseous forms during saturated soil conditions. Leaching — the loss of nitrate by percolating water through the soil profile and into groundwater.
N may also be tied up in soil and plant organic matter left on the field
SymbioticN2fixation
after harvest. Harvested plant material removes N from the system entirely. A simple N budgeting approach may increase on-farm efficiencies while minimizing external losses.
Nutrient applications of inorganic fertilizers and/or manure are often necessary to maximize yield and improve profitability. Yet, inefficiencies exist in crop N utilization because of both inherent biological constraints of the growing plant as well as inevitable losses of applied N due to the many transformations and transport processes occurring at any given moment.
Any N in the system not actively being utilized by a growing crop has the potential for loss. It is this N that can be
considered as potentially leachable N, meaning it may be lost to groundwater due to no active plant uptake.
Calculation of the amount of potentially leachable N requires information on additions of N as fertilizer and/or manure, and removals of N as the yield and N content of the harvested crop. Quantifying this inefficiency by determining crop utilization relative to nutrient additions can identify where management interventions may be beneficial.
Comparing the results
The first step of any budgeting approach is to define the system boundaries both spatially and temporally. The Discovery Farms NUE database
6 | Journal of Nutrient Management | November 2021 jofnm.com IN THE FIELD
Figure 1: The nitrogen cycle
Atmospheric N2, N2O, NO x , NH 3 Manure Microorganisms Immobilization Mineralization Fertilizer N Removal from system via harvest Atmospheric deposition Animaluptake Plant uptake Plant residue Runoff and erosion Leaching Denitrfication NH 3 Volatilization Mineral nitrogen NH4 +, NO2-, NO3Nitrification Plant and animal residues Soil organic matter SOIL
The various transportation processes and transformations of nitrogen within an agricultural system. Management decisions impact many of these processes, in particular the addition of nitrogen via inorganic fertilizers and manure.
collected data from over 300 fields and calculated the difference in N applied and N removed in the harvested plant material over single crop rotations.

Discovery Farms found farmers applied on average 180 pounds of N per acre to corn grain fields, with 80% of this N as inorganic fertilizer and the rest as manure, as well as some legume credits. Average yield was 222 bushels per acre at 1.05% N content, leading to an average of 130 pounds of N removed from the system through grain harvest.
Although there is variability across the different fields (top of Figure 2), the difference between average N additions and N removal is 49.7 pounds of N per acre per year. This difference is what can be considered as potentially leachable N.
When no crop remains in the field, this “leftover” N may be lost from the system via the various pathways described earlier. This represents both an economic loss of potentially unused fertilizer, as well as an environmental concern when this N in the nitrate form moves downward past the root zone where it will eventually reach groundwater.
Now consider the silage data (bottom of Figure 2). Total average N inputs for silage were slightly higher than grain at 190 pounds of N per acre with significantly more of this N
input as manure compared with grain fields. Average yield was around 25.8 tons per acre at 1.15% N content, leading to an average of 209 pounds of N removed from the system through silage harvest. The average difference between N additions and N removal is -19.2 pounds per acre per year.
Although the silage data was more limited and variable than the grain data, silage fields in Wisconsin, on average, have a negative N removal rate; this means silage harvest tends to remove more N from the field than is applied. A negative removal rate could signify a potential soil N mining situation, where crop needs are utilizing mineralized N provided from soil organic matter.
Given the higher rates of manure application in silage fields, this could potentially affect the N calculation since only the “available N” — or if no manure analysis is available, a “book value N” — in the manure is used. However, this should not be interpreted as silage having no potentially leachable N, as onethird of silage fields in the database have a positive balance.
Using nitrogen data


How can these metrics be utilized to understand both on-farm nutrient cycling and the implications for water quality? Excess N in the system during any given crop rotation has the potential to leach out of the root zone and into groundwater. Fields that are above average should consider management interventions to move the N balance down to prevent excessive losses of N to the environment. Excessive N loss affects both profitability and sustainability of the farming operation.
If a field is found to have a positive N balance, changes in management should be utilized to limit the loss of N. Some approaches to better N management may be to re-examine fertilizer management plans (the 4Rs), use of cover crops, or other alternative N sources such as legumes.
A recent joint analysis of tile drainage by Wisconsin Discovery Farms and Discovery Farms Minnesota found that a winter cover crop significantly reduced nitrate concentrations in tile drainage water over the winter and into early spring. Tracking the effectiveness of Iowa’s Nutrient Reduction Strategy in reducing N loss has shown the positive impacts of cover crops, grazing pastures, and incorporating more perennial cropping systems into agricultural land use practices.
While some of these practices that substantially reduce N losses may require higher up-front investments, simply calculating the potentially leachable N doesn’t take much time or effort. This can be an easy step toward better understanding the impact of the current cropping system and the potential of management interventions to reduce N losses. More details can be found in the Discovery Farms publication, “Nitrogen Use Efficiency: A Guide to Conducting Your Own Assessment.” ■
jofnm.com November 2021 | Journal of Nutrient Management | 7
400 300 200 100 0 0 100 200 300 400 Corn grain yield (bu/ac) Total inorganic fertilizer + manure N applied (lb./ac) 40 30 20 10 0 0 100 200 300 400 Corn silage yield (tons/ac) Total inorganic fertilizer + manure N applied (lb./ac)
Figure 2: The flow of nitrogen
Data compiled from the Discovery Farms NUE database showing corn grain yield (top) and corn silage yield (bottom) against total N application. Individual fields are colored relative to the N balance (calculated as N applied minus N removed).
200 100 Mean = -19.2 -200 -100 200 100 Mean = 49.7 0 -100
The author is with the University of Wisconsin-Madison Division of Extension Discovery Farms Program.
Put it in a pellet
Pelletizing manure solids is one way to condense nutrients for easier transport.
by Mahmoud Sharara
When carefully managed, manure is a low-cost source of nutrients and organic matter that improves soil fertility and crop yields. In regions of concentrated animal production, fields available to use manure are limited and often receive nutrients in excess of crop needs.
In particular, when manure is managed on a nitrogen basis, soil phosphorus increases, which elevates phosphorus losses to surface water. These losses contribute to algal blooms and dead zones in fresh water bodies. Such impacts bring negative attention to concentrated animal feeding operations (CAFOs) and can result in tighter regulatory restrictions on permitting and operation.
To overcome these challenges, livestock producers adopt solid-liquid separation to add flexibility to nutrient use by moving phosphorus-rich solids to fields farther away to use agronomically. At times, however, manure solids need to be transported even farther for use in areas without a nutrient surplus. In such cases, additional processing is required to develop manure-based products that are easily shipped long distances and accessible to a wide range of uses.
Pelletizing manure solids can help achieve this goal (Figure 1). That is because pelletizing increases manure density, which makes storage and transportation more efficient. Manure pellets are also uniformly granular or cylindrical, making land application easier and more precise. In cases where
manure solids are rich in energy, as in fresh litter or dairy solids, manure pellets can be used as fuel through co-firing in power plants with coal and/ or woody biomasses.

How it’s done
Manure can be pelletized using different techniques. For example, extruders apply pressure to manure solids to form pellets or briquettes, while mixing manure solids with a binder in a pan/ disc granulator or a pin mixer forms granules (balling). Spray congealing is also used to make prills from slurries. In each case, the particle size can be adjusted by the mold size used, the amount of pressure, the type of binder used, and the mixing duration.
The type of manure also affects the optimal method for granulation. For instance, extrusion is suited for fiber-rich manures like poultry and dairy, while granulators
are ideal for fine particle solids like digestate solids after fiber removal.
Granulators are typically the least cost technology for manure pelletizing since they consume the least amount of energy and do not involve high-friction moving parts. In granulation, the binding effect can be achieved by one of several different binders, including water, starch, gums, and lignosulfonates. The type of binder affects the process cost as well as the potential for labeling the product as an organic material.
During operation, pan and disc granulators can produce dusty conditions if the manure is too dry. They should be operated under negative pressure along with a dust collection system.
The content matters
Manure pellet quality depends on its nutrient content and physical, chemical, and biological properties. The quality determines market acceptance and value of the product. Without any supplemental nutrients, solid manure pellets have nitrogen, phosphorus, and potassium ratios (N: P: K) around 4: 4: 4.
Maintaining a consistent nutrient value is critical when manure pellets are bagged, labeled, and sold in markets as a fertilizer. This, however, can be a challenge because of manure variability, especially when manure is being sourced from different farms. Supplementing the manure with nutrients is often a good approach to ensure consistency and to meet market demand uses.
Similarly, particle size and size distri-
8 | Journal of Nutrient Management | November 2021 jofnm.com
Figure 1: Dairy manure granules
Dewatered manure

Paddle/Pin mixer
Disc granulator
Rotary dryer
Binder feed
achieved by developing cooperatives for sourcing manure from multiple nearby farms. This approach is particularly suitable to areas of high-density animal production.

In studying the impact of cooperative size on the cost of pellet production, we found that extending the cooperative radius from farms within 2 miles to 10 miles reduced the cost of producing a ton of dairy manure pellets by more than 6% (on.hoards.com/manurepelletizing). This cooperative model greatly helps reduce the production cost per ton of pellets and allows the facility to hire independent staff to develop multiple product lines and market product.
The growth in organic food production is another lucrative opportunity to implement granulation to provide a renewable nutrient source while reducing its accumulation in animal production regions. Even though cost is a barrier, the ability to pelletize manure has many potential applications on the farm and beyond. A fact sheet with more information can be found at bit.ly/JNM-pelleting. ■
Oversize mill
Vibrating screen
Product (granules)
bution affect land application swath and uniformity. Therefore, the intended application determines the size selected for pellet manufacturing, often between 2 and 6 millimeters to match conventional fertilizer applicators. Specification sheets often report particle size using median particle size (d50) or size guide number (SGN), while particle size uniformity is often reported using the granular spread index (GSI) or the uniformity index (UI).
One of the reasons for poor uniformity is pellet crushing during manufacturing, handling, storage, or transportation. This can be a result of suboptimal production conditions such as low binder ratio or poor binder quality, rapid pellet heating or drying, or excess pressure during extrusion. Therefore, durability is monitored during production, typically using the pellet durability index (PDI). This index reports the percentage weight of intact pellets after a standard tumbling test.
Before the manure pellets are bagged and labeled as a “fertilizer,” it has to be permitted and tested periodically by relevant agencies in the state where it is manufactured and distributed. That is often done to ensure label claims are correct and that pathogen levels and metal content are safe for intended uses, especially when marketed for nonagricultural uses such as gardening and turf care.
Concerns about price
While pelletizing is clearly a promising strategy, it is costly to take on as an individual producer. The scale and cost of equipment required (Figure 2) is often beyond what a typical dairy or swine operation can afford. Larger dairies, with more than 10,000 cows, are good candidates for this technology. Overcoming the scale issue for typical farms can be

jofnm.com November 2021 | Journal of Nutrient Management | 9
Source: Sharara et al, 2018
Surge hopper
Figure 2: The equipment required for granulating
The author is an assistant professor and extension specialist in the department of biological and agricultural engineering at North Carolina State University, Raleigh, N.C.
Find the right fit for your team
Evaluate your nutrient management consultant to ensure they are able to meet your needs.
by Deanne Meyer
Managing nutrients is more than having a Nutrient Management Plan in a binder on the shelf. Daily management of manure and proper land application at the right time and rate for each crop takes a team approach.
Consultants fill a void when expertise, but not a full-time employee, is needed. Selecting the right person for your farm takes effort. It pays to evaluate your nutrient management consultant needs whether you’re looking to hire a new person or already have someone on board.
Write the job description
What does this individual need to do for you and the farm? Make a list of essential responsibilities. These serve to build the job description and your employee evaluation metrics. Be as detailed as possible. Finish this sentence to define your needs: “I need to hire a consultant to . . .”
Here’s an example: “I need to hire a consultant to make manure application recommendations.” In this case, you’d want an individual with experience and training in nutrient management and crop production.
People skills are crucial for consultants so they are capable of having difficult conversations with farm employees (and you), whether it’s about sample collection, manure application, or record keeping requirements.
How will they interact with farm employees? Will this person train farm employees or work with manure applicators to ensure the right amount of manure is applied to each field? Will this person collect required manure and plant samples, or will they teach farm employees using an appropriate set of sampling protocols?
Alternatively, if you need to hire a consultant to complete your nutrient management compliance requirements, you would want an individual well versed in regulatory record keeping and paperwork. You may or may not use them to manage sample collection or applications.
Look at qualifications
What qualifications are an absolute must for a successful candidate?
This will (and should) vary depending on the tasks required. The following qualifications may be useful:
• Expertise in manure nutrient management and utilization
• Skill and certifications in crop management if required
• Knowledge in manure application systems for your species
• Understanding of nutritional additives and the potential effect of diet on manure management
• Competence in addressing regulatory compliance issues
• Knowledge of current regulatory requirements and potential changes
• Evidence of successful working relationship with regulatory agency staff
• Effective written and oral communication skills
• Demonstrate proficiency in completing tasks in a reasonable time frame
• Knowledge of nutrient flow in, on, and off a farm
• Awareness of strategies to improve whole farm balance
• Knowledge of current sustainability approaches and financial impact
• Other qualifications that fit the needs of your operation
You want to identify required and preferred qualifications and compare those qualifications to potential candidates or your current consultant.
Credentials or certifications
Does the consultant have technical experience, skill, and knowledge in the areas you are seeking assistance?
Be sure to review credentials. Professional websites often have a place to check current licenses or certifications. Depending on the certification or license, there may be a place to check for complaints.
Often certified crop advisers and technical service providers need to complete continuing education to keep their certification current. You can check their certification status at on.hoards. com/findprofessionals.
You want confidence that the individual is well versed in soil, water, and
10 | Journal of Nutrient Management | November 2021 jofnm.com
nutrient management needs for your type of operation. It’s possible someone is well versed in growing strawberries or celery, for example, but doesn’t have actual experience with manure based nutrient management systems or growing the crops you grow.
Evaluate productivity
If someone has written Nutrient Management Plans before, ask for a copy of a plan or two and the associated annual reports. Logically, this would be a redacted copy. Make a conscientious effort to look through these documents and evaluate how effective they would be for your needs.
If the plan doesn’t work for you, decide if you need to keep looking for a different consultant or if your potential consultant is able to change their approach. Determine if short cuts were used or if site specific information was omitted from the plan.
Review references
Always use due diligence when checking references. Anyone can complete forms and submit them to a regulatory agency. However, you don’t want to hire just anyone. You want to hire someone who has a good track record and will represent your facility honestly, be responsible, and assist you with compliance issues. Check to see if your top candidate has a good rapport with the regulatory agency staff.
If someone says they have been doing nutrient management work for years in another county or state, find out with whom they worked. Call the individuals and determine if quality work was performed. Open-ended questions can provide much insight. You could ask:
• “Please share any possible red flags about their work.”
• “What suggestions do you have regarding criteria I should use to hire a consultant for my farm?”
• “How would you rate my candidate against those criteria?”
• “What could be improved in their reporting documents?”
Some staff may be willing to discuss a specific individual, but some agencies might prohibit this type of open discussion. The information is valuable to you, though, so it’s worth asking.
When checking references, most people are polite and respectful. Briefly explain the two or three most important responsibilities of your position. Specifically ask if they would hire this person to do the job. Identify what you need the individual to do and ask if they would recommend them. Inquire if there is anything you should watch carefully with this individual, or if there were surprise fees or costs associated with the project.
Evaluation metrics
Once a consultant is on board, you’ll want to schedule regular meetings to be sure a smooth exchange of information so they can do their job. Identify key metrics from the job description to evaluate quality and timeliness of work product. Your management team may have great input for these metrics. Are there responsibilities the individual will need to grow into? If so, determine the path to take to get them further trained.
Think about the old saying, “If you don’t know where you’re going, any road can take you there.” Each question you use for the evaluation process should identify not just what the consultant did but should also include an analysis of the outcome. Sometimes people can do great work, but if it’s not what you requested, it doesn’t get you where you need to be.
Consider how much manure was applied, and over time, was less fertilizer used? Were improvements made to water management systems?
How much money, time, or resources have been saved with the Nutrient Management Plan? Has the consultant worked to help your facility make you money?
Were assignments finished in a timely fashion and done completely? In some states, regulatory due dates are all or nothing. An incomplete report is viewed the same as no report at all.
Were calculations based on assumptions or farm specific data? Did the individual need to take samples and provide chain of custody information? If so, were these done correctly and to the satisfaction of the regulatory agency? Were calculations in reports transparent with clear assumptions identified?

Are the calculations defensible, or will the methods and results trigger a red flag with your local regulatory agency?
It’s really important to understand the methods used to make all calculations for your facility. Software programs developed in one state or for one location may not be appropriate in another location. If the individual uses their own software for analyses, are the calculations done properly?
Did the individual explain information in reports prior to submitting them to the regulatory authority? If so, did you feel comfortable with your results and the ability to work with your consultant to make facility alterations if necessary?
You may want to make a call to your local regulatory staff individual to identify if the reports provided were acceptable and delivered in a professional manner. Although this may seem intimidating, it’s essential to have a working relationship with the regulatory agency staff.
Engage your team
Each consultant is part of your management team, and many consultants provide specific information. As the team manager, you drive the bus and need to be sure the right individuals interact and understand different aspects of the farm. As an example, if your nutrient adviser identifies that your operation is short on land and long on phosphorus or salt, you should include your nutritionist in those discussions to identify how dietary composition may be affecting your farm.
At the end of the day, the buck stops with the owner. You will need to stay up to date on regulatory requirements and determine if your consultant is doing their job. Also ensure the final product is acceptable to the appropriate authorities. The owner/operator of a facility is legally responsible for everything that happens on that farm. No matter who wrote the plan, they would be responsible if any manure mismanagement results in an environmental problem. ■
jofnm.com November 2021 | Journal of Nutrient Management | 11
The author is a livestock waste management specialist in the department of animal science at the University of California, Davis.
PARTNERS IN PROGRESS
by Abby Bauer, Managing Editor
“Afarm should be built around the manure system,” is the advice dairyman Jim Winn would give to someone planning to build a new dairy. “It’s the most important part.”

Since Winn and his co-owners established Cottonwood Dairy in South Wayne, Wis., in 1998, they have made several changes to update their manure handling system to ensure nutrients are stored properly and distributed where needed. This proactive mindset regarding nutrient management has served Winn well, and by joining together with other farmers and organizations, it has also made a difference in the local community and beyond.
For Winn, successful partnerships have played a big role in his career as a life-long dairy farmer. An active leader in dairy circles, Winn immensely enjoys these opportunities to collaborate and meet other dairy farmers. He also sees value for the betterment of agriculture.
“It’s important,” he said. “We need a voice for dairy farmers.”
A group that Winn has worked with enthusiastically the past few years is the Lafayette Ag Stewardship Alliance. From its grassroots beginnings, the work of this farmer-led organization has made a difference not only on individual farms but has also created some inroads to connect environmentally
conscious farmers with major players in food manufacturing.
A farmer-led effort
As a board member for the Edge Dairy Farmer Cooperative, Winn got to know Tim Trotter, executive director of the co-op and the Dairy Business Association. Recognizing his leadership abilities, Trotter reached out to Winn a few years ago, suggesting farmers in his area of southwestern Wisconsin think about starting a conservation group. Considering the karst topography in Lafayette County that leads to groundwater quality concerns and his own passion for environmental stewardship, Winn acknowledged the need and took
12 | Journal of Nutrient Management | November 2021 jofnm.com
Collaboration and environmental stewardship are at the heart of this Wisconsin dairyman and the grassroots organization that he helps lead.
action. He contacted half a dozen of his farmer colleagues in the area, and they met for a lunch meeting at a local golf course. After tossing around some ideas, the Lafayette Ag Stewardship Alliance (known as LASA) was born in 2017.
Winn was named president, and a few other farmers joined him on a board of directors. Their organization established goals and scheduled their first event — a field day showcasing conservation farming techniques that reduce nutrient runoff and improve soil health. Winn said they didn’t know what to expect for participation but were pleasantly surprised when more than 100 people attended that day.
Over time, the group has grown from its original six members to more than 30, and Winn said they represent a wide array of farming operations. The farmer-led, nonprofit organization aims to protect natural resources, help the public understand general farming practices, and empower members to improve farming techniques.


Winn gave credit to several entities that help LASA be successful in its initiatives. “Working with The Nature Conservancy has been a huge benefit,” he explained, “and so is the Farmers for Sustainable Food non-profit organization.” He also recognized the Wisconsin Department of Agriculture, Trade, and Consumer Protection for providing the grants that funded their group, and Trotter for his support of
agriculture in general.
Winn said the positive impacts of LASA can be seen locally in many ways. One example of this is the use of cover crops. While Cottonwood Dairy has been utilizing cover crops, mostly rye and wheat, for well over a decade, he said more and more farms are adopting the practice now.
“Cover crops in the area just exploded, and I think LASA was a huge part of it,” he shared. A survey of LASA farmers in 2020 showed that cover crops were planted on 7,389 acres. Additionally, more than 29,000 acres were managed with conservation tillage practices, either strip or no-till planted in the spring, and almost 27,000 acres were covered by nutrient management plans.
A broader impact
Recently, the group has built bridges outside of the area as well. Grande Cheese Company, an Italian cheese manufacturer in eastern Wisconsin, was looking for opportunities to share with their customers the environmentally-friendly practices implemented on the farms providing their milk supply. This paired with LASA’s desire to track on-farm conservation practices and the impact they had on both the farming business and the local environment.
By combining forces, the Farmers for Sustainable Food, Grande Cheese Company, and the Lafayette Ag Stewardship Alliance were able to create “The Framework for Farm-Level Sustainability Projects.” This handbook helps farmers decide what conservation practices are most useful on their farm, document the environmental and financial impacts, and then showcase the value of sustainability through the food chain.
The pilot project included 12 farms and follows the model of a milkshed, representing the farms and businesses in the region that supply dairy foods to customers. The framework is flexible so that it can be replicated in other regions. The pilot project collected and analyzed farm data and wrapped up its first year in 2020. Current funding will take the project through 2022.
Winn explained that the framework gives farmers a tool to prove to themselves, to neighbors, and to milk purchas-
jofnm.com November 2021 | Journal of Nutrient Management | 13
Jim Winn farms with two partners, Brian and Randy Larson, at Cottonwood Dairy in southwestern Wisconsin. Their 1,900head herd is housed in freestall barns with sand-bedded stalls.
Reclaimed water that contains less than 2% solids is what Winn considers a key to using recycled sand for bedding.
ers that there is value in being innovative when it comes to manure management and environmentally friendly practices. He sees benefits in having milk processors and others in the supply chain moving in the same direction as farmers.
Others have noted the benefits, too. In fact, this pilot project was recognized nationally with an “Outstanding Supply Chain Collaboration” award presented by the Innovation Center for U.S. Dairy. These annual awards honor exceptional farms, businesses, and partnerships for their socially responsible, economically viable, and environmentally sound practices and technologies that have a broad and positive impact.
On an even bigger scale, Nestle, the world’s largest food and beverage company, has shown support for the project as part of its effort to partner with farmers, suppliers, and the industry to reduce the carbon footprint on farms. Their end goal is to achieve net zero emissions by 2050.
Winn said their organization is proud of the changes and improvements that have been made in Lafayette County. Factor in the handbook project with Grande and Nestle and the national sustainability award, and Winn said, “That was huge for us. It put our organization’s name out there.”
Friends in business
Partnerships and stewardship are at the core of his own dairy farm, too.
From a young age, Winn knew that dairying was the career for him, even though two of his greatest farming role models — his father and grandfather — passed away early in Winn’s life. His mother and grandmother kept the farm running until Winn graduated high school and took over the reins.
His father and grandfather installed one of the very first parlors in Wisconsin in 1949, and Winn followed their innovative footsteps as he and his wife, Laurene, grew and renovated their farm.
From time to time, Winn and two fellow dairymen, cousins Brian Larson and Randy Larson, discussed partnering to build a dairy together. However, plans weren’t set into motion until after their financial lender recommended the three combine forces rather than expand their individual dairies.
Plans for that venture began in 1997, and the dairy was built the year after, on a 40-acre site that originally belonged to Brian’s dad. Independently, both Winn and Brian brainstormed the name Cottonwood Dairy, a nod to the cottonwood trees that used to grow nearby. Randy handles the financials, Brian the crops, and Winn manages the cow side of the dairy.
Their original expansion plans were met with opposition in their rural town, but they soon established a solid track record for environmental stewardship. They started with 600 cows, and a few years expanded to 900. Incremental
growth over time led them to the 1,900 head that are housed on the farm today.
Calves are raised at the farm where Winn grew up and originally milked cows. At 5 months of age, they are moved to a heifer raiser before returning to the dairy.
Cows are milked three times a day in their double-20 parlor. The Holstein herd averages 98 pounds per cow per day, with 4.2% fat and 3.2% protein.
The herd’s somatic cell count averages 70,000 to 80,000 cells per milliliter.
Winn credits teat scrubbers for having a huge effect on teat cleanliness and maintaining that low somatic cell count.
Bedding, and in particular clean bedding, also makes a difference. When they first built the dairy, cows rested on mattresses bedded with sawdust. By 2004, they switched to sand bedding, and Winn said the herd went up 10 pounds per cow in milk production practically overnight due to the improved cow comfort.
The switch to sand also necessitated some changes to their manure system. That same year, they built two sand lanes to recover and reuse the bedding. This has represented a huge cost savings; Winn projects they save hundreds of thousands of dollars a year in sand purchases. A few years later, they built a storage barn to save recycled sand for winter and only purchase new sand for their special needs barn.
Manure and used bedding are carried out of the barns with a flush flume system using reclaimed water, and the sand settling lanes separate the sand from the manure. The lanes are cleaned out every 12 hours, and the sand is first stacked next to the lanes, then moved to a concrete pad where it dries.

When using recycled sand, cleanliness is crucial. “The key to clean sand is to have clean water,” he shared. The water they use in their flush flume, which is stored in one of their manure lagoons, contains just 1.4% solids, and Winn’s goal is the keep that level under 2%. All water on the farm is recycled several times, and Winn noted, “That is another huge savings for us.”
All eyes on manure
When manure is flushed out of the freestall barns, it first goes into a
14 | Journal of Nutrient Management | November 2021 jofnm.com
Polymers, sand lanes, and solids separators are utilized to divide the manure solids and liquids at Cottonwood Dairy.
15,000 gallon tank, and this is where a polymer is added. Winn has used polymers for the last 16 years, and he said this is a major factor in producing cleaner recycled water. It helps separate the solids, and in the lagoons it also seals the solids at the top of the lagoon, reducing odor concerns.
From there, manure is pumped to the upper lagoon, where most of the solid manure is stored. Solid separators are used to remove more water. Much of the remaining water in the upper lagoon weeps into the lower lagoons through a pair of pipes, and this is where reclaimed water for the flume flush is stored. In all, the three lagoons have a total capacity of about 26 million gallons.
When Cottonwood Dairy was first established, the partners hired out all of the manure hauling. Then, they did their own application for a number years before choosing to hire custom operators again to save costs.
Almost all manure is applied using draglines, with just one 60-acre field

farther away that requires trucking. Winn said they are able to do that one field quickly and keep the trucks off the road, which benefits the local community. In all, they operate about 2,500 acres of cropland, both owned and rented, and the nutrients in manure are an asset to them.
For the last 10 years, they have been using low disturbance manure injection. They also continue to dial down their rates of application every year, and Winn said they buy very little fertilizer. They have noticed positive differences in the crops grown in fields where manure was applied as opposed to commercial fertilizer, and some of their neighboring crop farmers have, too. Each year, manure from Cottonwood Dairy is applied to several neighbors’ fields as a nutrient source.
“We have always been very cautious stewards of the land,” said Winn, and he remains open to new ideas when it comes to nutrient management. “Anything manure, I am all
eyes and ears,” he said. Winn said he would like to incorporate more manure technology and would love to generate gas if that was an option for them someday.
Introducing more manure processing opportunities to the area is one of Winn’s goals for LASA as well. The group will also continue to focus on nutrient management and maintaining quality of groundwater and surface water. Still further, the members hope to assure community residents that environmental stewardship is a priority for farmers, too.
Farmers working with other farmers, food processing partners, and national awards for collaboration all help get the word out, but Winn said more work can be done to share the conservation practices that are already implemented on most farms today. “It’s getting better and better, and farmers are finally getting some recognition,” Winn said, “but it’s time we tell our stories.” ■
jofnm.com November 2021 | Journal of Nutrient Management | 15 OXBO.COM 800.628.6196 5105 LNMS DRAG HOSE LESS MESS. MORE VALUE. • Drag hose manure diverted to tank at field ends • Powered front wheel and steerable rear axle • Detachable swing arm for versatile nutrient application LIQUID
NUTRIENT MANAGEMENT SYSTEMS
Get the sample you need
With a simple tool, you can collect a representative liquid manure sample.
by Abby Bauer, Managing Editor
Tomake the most of manure that is going to be used as fertilizer, analyzing the nutrient content first is a must. Collecting a representative sample is key to this process.
“You want to get a sample before you apply in the fall so you know what you are dealing with,” said Melissa Wilson, manure management specialist with the University of Minnesota Extension. Wilson and Scott Cortus, a research manager at the university, shared the importance of collecting a representative sample and how to make a manure sampler for liquid manure in a short University of Minnesota Extension video.
“Nutrient content in liquid manure can be quite variable,” Wilson explained. She pointed to the figure that shows the wide range of nitrogen (N), phosphorus (P), and potassium (K) in manure. “The total N, P, and K variability illustrates the importance of getting samples taken from your own operation in order to better understand what nutrient concentrations you are actually applying to your fields,” she said.
Build your own tool
To collect a representative sample, a homemade manure sampler can be made using a PVC pipe. The pipe needs to be long enough to reach the bottom of the pit or storage area. Also needed is a rubber ball that is slightly bigger than the opening of the pipe, and an eye bolt to connect the ball to a piece of wire. Select a wire that has enough gauge to not only pull the ball tight to the end of the pipe but also enough strength to push it back out. The wire should be three or four feet longer than the PVC pipe.
A bucket will be needed to collect the bulk sample. Wilson said a 5-gallon bucket is useful because it has high sides that can help reduce splashing when manure comes out of the pipe. A mixing tool, like a ladle dedicated to manure sampling, is necessary to stir the manure and then fill the smaller sampling container. She also recommended a pair of rubber gloves to get this job done.
Taking the sample
To make the collection, Wilson said to first be sure the wire is pulled through the pipe but that the ball is loose. Lower the pipe into the pit until you reach the bottom, and then pick it up a few inches. “This will allow you to maneuver the ball into the pipe, and it also avoids the sludge at the bottom of the pit that you don’t pump out every year,” Wilson explained.
Pull the ball tight against the pipe, and then slowly raise the PVC pipe out of the pit, holding the wire taut so the ball doesn’t fall out. Once the bottom of the pipe is over the bucket, use the wire to push the ball out.
“We recommend collecting several samples, filling the bucket one-third to one-half of the way, to get the variability that may be found in that pit,” Wilson advised. If you have the opportunity, she also said to collect from several ports or places in the storage structure.
Once enough samples have been collected, mix the manure really well using the ladle, then pour some manure into the smaller sample container. Send several cups of material so the laboratory has enough to sample, but Wilson said to leave room at the top of the container for gases to escape, or if the sample will be frozen, allow room for the manure to expand so the container doesn’t explode.
Once the sample is ready, Wilson said to clean off the outside of the container, label it, and then double bag it to guard against leaks and spills during shipping. She recommended choosing a lab certified for manure analysis to ensure you are getting accurate results. ■
16 | Journal of Nutrient Management | November 2021 jofnm.com
To watch the video “How to sample a liquid manure storage pit for nutrient analysis,” visit http://bit.ly/SampleLiqManure
manure
Nutrient content 75 60 45 30 15 0 Nutrient content (lbs. per 1,000 gal) University of Minnesota Extension KEY ● Total N ● Total P (as P 2O 5 ) ● Total K (as K 2O)
Liquid
—
BEEF DAIRY SWINE
GET MORE FROM MANURE APPLICATIONS THIS FALL



s fertilizer prices climb and concerns about supply shortages loom, manure is an even more valuable nutrient source this fall. Iowa State University experts shared a few guidelines for making the most of postharvest manure applications in their Integrated Crop Management Blog. For starters, they said to watch the temperature — the soil temperature, that is. Application of liquid manure should be delayed until soil temperatures are below 50°F. That’s because warmer soils allow for the conversion to nitrates and raise the risk of nitrogen loss. Even with the use of a nitrification inhibitor, nitrate will leach
with extra water moving through the soil profile.
While ammonium (about 80% of the total nitrogen in swine manure, for example) in the soil does not leach, it continues to convert into the nitrate form of nitrogen until soil temperatures are below freezing. At 50°F, the rate of nitrification is reduced to 20% of the maximum rate.

There’s a yield impact, too. In Iowa State University trials, a four-year average of corn yields showed a 38-bushel increase when manure was applied after soybean harvest in the early fall when soil was warm compared to holding off until soil
temperatures were below 50°F.
The authors also noted the importance of equipment maintenance and calibration to get the most value from manure nutrients. Research from the university found the potential for a significant amount of variation in manure application along the toolbar due to a lack of maintenance. Air vents should be checked and cleared to avoid being plugged by dry manure. Hose loops and crimped hoses should be fixed. Filling the tank with water and turning on the pump with the injectors out of the ground is a way to assess uniform flow along the toolbar. ■
jofnm.com November 2021 | Journal of Nutrient Management | 17 MANURE MINUTE
INVEST IN QUALITY ® www.kuhn.com Visit our website today to locate a Dealer near you! PXL 100 SERIES PROSPREAD® Commercial Apron Box Spreader 865-1,230 cu. ft. capacity • truck & trailer models HIGH-USAGE , HIGH-CAPACITY
SPREADING
Withstand heavy loads with stout, commercial-grade undercarriage
Multiple discharge options to best suit the needs of your operation
Reversible apron easily clears any unforeseen obstruction or blockage Guillotine endgate increases material flow management and metering
WHEN AND WHERE DO MANURE SPILLS OCCUR?
by Reed Kostelny
Manure spills are a real obstacle for any livestock operation and any custom applicator. They may stop application for the day or require outside equipment to be hired for quick cleanup. Adding together the troublesome time costs and environmental impacts of manure spills, it is always worthwhile to look for ways to avoid them.
As an intern for University of Wisconsin-Madison Extension’s Conservation Professional Training Program, a previous intern (Racheal Osterhaus) and I researched manure spills and runoff incidents that happened in Wisconsin over a five-year period (2015 to 2019). We were looking for common issues and improvements that could be made. By looking through paper and electronic files kept by the Wisconsin Department of Natural Resources (WDNR) and county agencies, 729 spills were found. While evaluating these spills, we focused on collecting information about the root causes, impacts, and the commonalities between spills.
Where spills occur
The first piece of data to look at is where these manure spills take place. We broke the spills into three categories:
1. During transport
2. On the farm
3. During or after application
Spills most often happened when manure was being transported from the
farm to the field (Figure 1). Problems during transportation include incidents like tankers tipping over, accidental valve openings, and dragline leaks. Transportation events have become more frequent, with transport being a cause in 38% of all spills from 2015 to 2019. That was up from 31% between 2010 and 2014.
On-farm spills followed closely behind in number of incidents, and between 2015 and 2019, this category represented another 38% of spills. Examples of these would be a manure storage overtopping, barnyard runoff, and transfer pipe failures. This is a smaller percentage of spills when compared to the 2010 to 2014 period, when 40% of spills occurred on the farm.
The final location for spills to happen was during or after land application.
This is where problems like equipment breakdown or malfunction and runoff due to rain or snowmelt can occur. Overall, the percent of all spills from land application declined. From 2010 to 2014 land application represented 27% of incidents, but it fell to 23% of all spills from 2015 to 2019. Location was unable to be determined for the remaining 1% of manure spill incidents.
Tools and training
Extra focus on particular problems can help prevent spills. On-farm issues, like a manure storage overtopping, can be prevented with frequent monitoring of manure levels, equipment maintenance, and diverting as much clean water away from the manure storage as possible.
In a previous study (2005 to 2009),
18 | Journal of Nutrient Management | November 2021 jofnm.com ON THE MOVE
A study of incident reports over the years revealed some manure spill trends.
50% 40% 30% 20% 10% 0% Farm Transportation Land application ■ 2010 to 2014 ■ 2015 to 2019
Figure 1. Where did the manure spills occur?
The proportion of all spills that occurred in each location in both five-year periods. Spills with unknown locations were less than 1% of the total. N=520 for 2010 to 2014 and N=729 for 2015 to 2019.
the number of manure storages overtopping in August (during summer with maximum evaporation) was just as high as in April. Implementation of weekly monitoring and installing markers in the manure storage that show the maximum operating level have made a significant difference.
During transportation, spills involving operator error, such as equipment tipping over and accidental valve openings, can be avoided with proper training and equipment familiarity. Spills that occur during or after land application, such as contaminated runoff leaving the field, can be reduced by checking resources like weather reports and manure spreading advisories each day. Injection and/or immediate incorporation also minimizes these risks.
The right reports
Focus should also be placed on reporting, so that proper cleanup is confirmed and possible environmental impacts can be prevented. The data we collected relies entirely on spills and runoff events that are reported and recorded. In most states, the responsible party (livestock producer and/or manure hauler) is required to report an incident. Ideally, every incident would be self-reported, but we found that only about 43% of spills were self-reported by either the farmer or the manure hauler (Figure 2). That means 57%
were reported by someone else — neighbors or a local or state agency — or were found during inspections. Seventeen percent of spills didn’t specify the reporting party.
Many pieces of data were collected to go along with each spill. Date and location were recorded, as well as information such as whether a custom manure hauler was involved and what sort of environmental impacts were observed. One of the clearer trends we found was the time of year that spills occurred. Most spills occurred in spring and fall, and specifically in the months of April, May, October, and November.
Another interesting trend was the involvement of custom manure haulers. Custom manure haulers transport over two-thirds of the manure in Wisconsin, but they were only a part of about 29% of spills during transportation (Figure 3).
Some other highlights include:
• Surface waters were impacted in 45% of spills (including road ditches with standing water that may not have connected to a stream).
• The most common spill volume was between 50 and 1,000 gallons.
• Of the 729 spills, 62% went through the Wisconsin DNR spills telephone hotline.
• The years 2018 and 2019 were wetter than normal, and as a result, these two years alone represented 61% of
manure storages overtopping between 2015 and 2019.
Goals of the project

This is the third five-year manure spill study conducted by the University of Wisconsin-Extension, in partnership with the Professional Nutrient Applicators Association of Wisconsin and the Wisconsin DNR. Despite the growing number of manure spill cases that have been recorded in each subsequent fiveyear study, experts and agency staff do not believe that the number of manure incidents is increasing. Instead, more spills are just being documented.
“Farmers and manure applicators are much more willing to self-report, because they’ve learned it’s the right thing to do and because it’s better to self-report than have a neighbor or citizen report a problem first,” noted University of Wisconsin-Madison Division of Extension’s Kevin Erb.
This data will be used to refocus education efforts in the state and improve methods of recording and dealing with manure spills. The trends seen in Wisconsin could be used to help shape reporting and responses in other states as well. ■
jofnm.com November 2021 | Journal of Nutrient Management | 19
The author is an intern with the University of WisconsinExtension’s Conservation Professional Training Program.
60 50 40 30 20 10 0 Number of spills Jan Feb Mar Apr May Jun Jul Aug Sep Oct Nov Dec
Figure 2. Who reported the incident? Figure 3. When did transportation spills take place?
■ Custom manure haulers ■ No custom hauler
The primary reporting party recorded for each incident between 2015 and 2019. N=729.
17% Unknown 37.7% Farmer 14.8% Inspection 11% Agency 11.9% Neighbor 2.1% Other 5.5% Manure hauler
The total number of spills that occurred during transportation each month. N=80 for spills with a custom manure hauler involved and N=196 for spills without a custom manure hauler.
Modern dairy production concentrates the number of animals housed in relatively small areas to improve production efficiencies, output per animal, and take advantage of economies of scale. This concentration of animals, greater feed inputs, and intensive management also concentrates by-products like manure and increases some air emissions, including ammonia and odors, which are among the most noticeable at the local and regional levels.
Clear the air with zeolites
A zeolite filter reduced ammonia and odor emissions from dairy cattle manure.
 by Mario de Haro-Martí
Diverse emissions reduction and control techniques are needed and can be applied at several stages of livestock production. In general, there is no single practice or process that can take care of all emissions from a livestock facility. Producers need a palette of options to choose from, based on their individual production conditions, geographical location, climate, management styles, needs on emissions reduction outcomes, and many other unique parameters.
One technology that can be added to
the palette of options now is zeolite filtration. Zeolites are a group of minerals that are the result of volcanic eruptions millions of years ago. They are widely available around the world, and we have several mines in the U.S., including some in Idaho.
Some of their characteristics include a relatively low density, high porosity, high water retention, high cation exchange capacity (CEC), and the capacity of adsorbing a diverse variety of compounds, cations, and gases that can be exchanged depending on their
20 | Journal of Nutrient Management | November 2021 jofnm.com
Ammonia concentration before and after treatment 6 5 4 3 2 1 0 35 30 25 20 15 10 0 NH 3 -N mg/m 3 Temperature o C Period and sampling
date
BKGR (p=0.001) 6/10/2015 BKGR (p=0.001) 6/20/2015 INLET (p=0.001) Period 1 7/2/2015 OUT (p=0.001) Period 1 7/2/2015 INLET (p=0.001) Period 2 9/9/2015 OUT (p=0.0001) Period 2 9/9/2015 INLET (p=0.13) Period 3 10/31/2015 OUT (p=0.13) Period 3 10/31/2015
Ammonia concentration before (gray) and after treatment in the filter (red), background ammonia air concentration (dark blue), and the average temperature at inlet and inside the filter (orange).
0.43 0.48 0.42 1.78 1.02 2.75 30.8 29.9 10.4 24.9 25.8 5.29 0.27 10.5
A pilot zeolite filter connected to a covered pit receiving waste water from a flush system cut ammonia emissions.
charge, molecular size, and concentration. The most common and abundant zeolite is called clinoptilolite, and it has a wide variety of uses in water purification, agriculture, and industry.
The University of Idaho teamed up with a dairy producer in southern Idaho to test a pilot zeolite filter connected to a covered pit receiving the wastewater from a flush system. The liquid manure in the pit is the most concentrated one in the system. From the pit, the manure was pumped to a set of solid separators and then a centrifuge.

Air from the receiving manure pit was extracted using a fan connected to a variable frequency drive actuated by floats, varying the fan speed according to the flow of liquid and subsequent air displacement. Ducts diverted the air to the zeolite filter. The pilot filter had a top to bottom flow, and it can be set up with different volumes of media, from one or two small layers up to a full bed. The media, in this case, was clinoptilolite.
Effective on the farm
Ammonia emissions were monitored for a series of running periods accumulating a total of approximately two months of running time with an off period to test ammonia diffusion in the system. On the first days of monitoring, the filter achieved a 92% ammonia reduction.
A second monitoring period was done after having the filter off for about two months to check for ammonia diffusion within the filter and performance at different temperatures. Ammonia reduction was 90% on this second run, suggesting no gas diffusion when the filter fan is not operating. At this second run, the odor concentration was also measured, achieving a 45% odor concentration reduc tion, even when using the blower at maximum speed, with a minimum residence time in the filter of approximately 0.9 seconds.
After the second sampling period, the filter was running continuously until Day 59 of operation, when it reached a 43% reduction in ammonia under colder temperatures. These results demonstrate the high effectiveness of the pilot filter, especially considering that it was handling the liquid manure flow from two dairies housing a total of 4,800 Holstein cows.
A viable option
Using zeolite filters to reduce ammonia and odor emissions is a viable technology that can help livestock producers reduce their impact, retain valuable nitrogen in a manageable form, and improve community relationships. Filters using these principles and media can reduce emissions from manure collection and transfer pits, storage or treatment ponds, forced aerated composting operations, and any other setting where the airflow can be captured and ducted to the filter.
Zeolites are relatively low-cost and available in the western U.S. When saturated, they can be crushed and applied
to agricultural soils where microbes and crops can extract the nitrogen held in them. It is also possible to regenerate the zeolites to be reused again. This option wasn’t studied in these trials, but other researchers have regenerated them up to a certain point.
Another advantage of the zeolite filter is that it can run independently of weather conditions. It doesn’t need moisture, and it runs under a wide range of temperatures. Of course, ammonia adsorption declines as temperature drops, as do ammonia emissions from manure. Winter operations will see a higher benefit on the odor reduction than from the ammonia control. A journal article describing the research was published at the Transactions of the ASABE.
The use of clinoptilolite as air emissions control technology for dairy and other livestock operations is another option available for our producers. ■

jofnm.com November 2021 | Journal of Nutrient Management | 21
Contact us with product questions or to receive a FREE estimate. (920) 948-9661 • www.pippingconcrete.com dennis@pippingconcrete.com • www.facebook.com/pippingconcrete Serving the AmericanNationwideFarmer THE TANK BUILDER! AGRICULTURAL CONCRETE The Nation’s Leader in Agricultural Concrete
The author is an extension educator for the University of Idaho Extension.
The most versatile option when choosing a waste storage facility! Our NRCS pre-approved tanks can be placed in or out of the ground.
Variability is the rule
Recognizing the changing characteristics of manure can help make the most of this valuable resource.
by Scott Fleming
While it all fits under the loose term of “manure,” if you’re reading this, you well know that all manure is not the same. And while we can categorize it by source, that doesn’t remove the variability that exists across its many facets.
Manure has gained a “difficult-to-manage” reputation as fertilizer, but it doesn’t have to be. With systematic manure analysis and an understanding of all contributing factors, its variability can be identified and this resource turned into a valuable fertilizer.
A look at phosphorus
Phosphorus is generally the most regulated component in manure. This is due to the risk of phosphorous delivery to surface water. When phosphorus runoff travels to surface water it can cause excessive algae growth.
The great news about phosphorus management is that this element tends to stay put in the environment. Soil erosion and manure runoff are the most likely culprits leading to phosphorus runoff. There is also a soluble phosphorus component to manure, but it is minor. With sound tillage and rotation practices, as well as effective incorporation, the risk of phosphorus runoff can be minimized.
Phosphorus content in manure tends to vary slightly during manure application. High phosphorus concentrations are commonly associated with manure that is high in solids content. This is especially true in a multistage manure
storage structure.
At a minimum, a manure sample should be pulled at the start and finish of each stage. A more comprehensive approach would include additional sampling when manure consistency changes. The only way to identify this variability is through a thorough sampling program.
Working with nitrogen
Nitrogen may be the single largest reason growers are applying manure. It is a great source of fertilizer for next year’s nitrogen-demanding crop. Nitrogen is also one of the toughest nutrients to control when it comes to applying manure. Nitrogen in manure can vary from the beginning of application until the last hose is on the reel.
To further complicate management, nitrogen is very mobile in the soil profile.
If a warm or wet fall is in store, nitrogen could be lost through the bottom of the system due to leaching. The same problem can occur in a warm or wet spring.

To help manage loss of fall-applied manure to the environment, it is best to apply manure when soil temperatures are below 50°F. If application cannot be delayed, many nitrogen stabilizer products are available.
Nitrogen can also be lost to the atmosphere thanks to volatilization. This can be controlled by the manure application method as well as nitrogen stabilizer products.
The hard and fast rule to limit volatilization is simple: The faster the manure gets mixed with the soil, the more nitrogen you will have for your crop. Limiting manure’s exposure to the air reduces its potential for volatilization.
Injection is the best way to maximize
22 | Journal of Nutrient Management | November 2021 jofnm.com
To get the most from manure, establish a thorough sampling plan to determine the variability in nutrient content prior to application.
the amount of nitrogen available, followed by prompt incorporation. Surface application comes in at a distant third. This is an effect of the loss of nitrogen to the atmosphere when it lays on the soil surface. These losses to volatilization occur from the moment manure is applied to the field. Obviously, minimizing these losses can prove beneficial to the environment and the bottom line. The Wisconsin nitrogen calculation method is fairly straightforward, so it’s easy to utilize in an example. When direct-injecting liquid dairy or beef manure, 50% of the total nitrogen is available in the first year. If the manure is surface applied and incorporated within 72 hours, 40% of the total nitrogen is available to the crop.
If the manure is not incorporated within 72 hours, only 30% of the manure’s total nitrogen will be available for the crop. The remainder of the nitrogen in each of these scenarios is either lost to volatilization, or it is slow-release nitrogen and will become available in the second and third year after application.
It is also important to note that different sources of manure have different first-year nitrogen availability. For example, swine manure has 65%, 50%, and 40% first-year availability when injected, incorporated, or surface applied, respectively. Check resources from your state for more specific information about nutrient availability.
SUPPLIER FORUM
In addition to source and application method variation, there is also variation of manure from farm to farm. Some likely causes for this variation include diet, precipitation, manure handling and transfer method, and animal size and type. To further complicate matters, the manure within a storage structure will vary enough to merit additional analysis. To account for this variability, manure analysis must be performed on a regular basis throughout the application season.
Sampling for consistency
As discussed earlier, much of the variation in manure tends to follow the concentration of solids. For a permitted livestock operation, a minimum of one composite sample per source is required for each application period. In a multistage manure system, this would mean one sample per stage. Additional manure samples should be pulled for all solid or composted manure.
This is the bare minimum sampling strategy that should be employed. Ideally, pull additional samples after major changes in manure consistency, prolonged application delays, and on each manure transfer field.
When looking at the impressive fertilizer value of manure, it is best to take sampling more seriously than meeting the minimum requirements. After all, you could pay for more than 10 manure samples by saving just 1 ton of urea.
While the relative cost of manure analysis may be low in comparison to fertilizer, managing the sampling strategy is still necessary to provide useful data. If too many manure samples are pulled, the data could become overwhelming and would likely not drive additional management changes.
A strategy commonly employed is sampling when switching fields. This will allow the producer the opportunity to tailor commercial applications to the exact manure credit for that field. Another important time to sample would be following a shutdown. The manure composition could change and this may cause variability.


If manure is applied to land that is not under the control of the farm applying the manure, this is a great opportunity to pull a sample. It provides peace of mind and helps show value for the manure application.

Manure sampling strategies are almost as variable as manure itself. Creating a game plan prior to application season will help direct sampling efforts and improve efficiency. Start pulling manure samples with purpose and putting them to use, and reap the value of this readily available resource. ■
• Liquid Manure Handling

• Solid Manure Handling
• Trucking
• Pushing & Packing
jofnm.com November 2021 | Journal of Nutrient Management | 23
The author is a nutrient management specialist and sampling director at Rock River Laboratory in Watertown, Wis.
DIGITAL NUTRIENT REPORTING FROM LIVESTOCK WATER RECYCLING


Livestock Water Recycling’s patented fertilizer PLANT system maximizes manure revenues by digitizing nutrients, biogas, and carbon while reducing the expense and environmental impact of these dilute liquids. This digitization is made possible through an award-winning automation and data analytics package that retrieves information from on-system sensors to create actionable insights for all types of food producers.
The mobile application myPLANT offers real time, automatic, up to the minute data reporting for access to nutrient, carbon, and renewable natural gas markets to make the most money from your manure. From easy access to digital marketplaces for fertilizers and biogas, managing nutrients for trading, or regulatory reporting for greenhouse gas and carbon credits, the LWR PLANT and the myPLANT mobile application are the crucial next steps in the monetary maximization of manure. Learn more at www.livestockwaterrecycling.com.

GEA INTRODUCES A NEW SCRAPER CABLE DRIVE
Make the most of your available space with GEA’s enhanced elevated stand for the SW cable drive unit. Mounting an SW series cable drive unit over a cross gutter means less clean up and easier maintenance. This option is available for new and existing drive units.
There’s another new addition to the GEA ProManure lineup, too. It is a tilting blade rubber shoe for alley scrapers. This new rubber shoe is more resistant to wear caused by sand in the alleys.
GEA offers a full range of drive units to simplify your life and give you more freedom for the installation location. Learn more about GEA ProManure at gea.com/dairyfarming.

FRESH PAINT 24 | Journal of Nutrient Management | Novemebr 2021
HoardsCreamery.com FARM CREAMERY FORT ATKINSON,WI ™
Our award-winning artisanal cheeses make great gifts!
PROFESSIONAL DIRECTORY
ANAEROBIC DIGESTER SERVICES
Agricultural Digesters LLC
88 Holland Ln. #302 Williston, VT 05495
802-876-7877
info@AgriculturalDigesters.com www.AgriculturalDigesters.com
Future Enviroassets LLC
513-349-3844
LF@futureenviroassets.com
www.futureenviroassts.com
ENVIRONMENTAL SOLUTIONS
Hall Associates
23 Evergreen Dr. Georgetown, DE 19947-9484 302-855-0723
hallassociates@mediacombb.net
Tomorrow Water
1225 N. Patt St. Anaheim, CA 92801 714-578-0676
info@bkt21.com
tomorrowwater.com
Trident Processes Inc.
1-800-799-3740
frank.engel@tridentprocesses.com www.tridentprocesses.com
COATINGS
Industrial Solutions
5115 S. Rolling Green Ave. Ste. 211 Sioux Falls, SD 57108 605-254-6059
www.isusananoclear.com
PLACES TO BE
DEWATERING EQUIPMENT
Press Technology & Mfg. Inc. 1401 Fotler Street Springfield, OH 45504 937-327-0755
dberner@presstechnology.com
WASTE HANDLING EQUIPMENT
R Braun Inc. 209 N. 4th Ave. St. Nazianz, WI 54232 920-773-2143

www.RBrauninc.com
R Braun Inc.
209 N. 4th Ave. St. Nazianz, WI 54232 920-773-2143
www.RBrauninc.com
Don’t see your company listed? Send your company name, key contact, mailing address, telephone number, email, and website to marketing@jofnm.com with Professional Directory in the subject line.
Due to the COVID-19 health situation, many meetings and events are being rescheduled or canceled. Please visit the listed websites frequently for updates.
Sustainable Agriculture Conference
November 5 to 15, 2021
Virtual
Details: on.hoards.com/sustainableagconf
2021 Sustainable Agriculture Summit
November 17 and 18, 2021
Las Vegas, Nev.
Details: sustainableagsummit.org
South Dakota Pork Congress
January 12 and 13, 2022
Sioux Falls, S.D.
Details: sdpork.org/events/pork-congres
Compost2022
January 24 to 27, 2022
Austin, Texas
Details: compostconference.com
Cattle Industry Convention and National Cattlemen’s Beef Association Trade Show
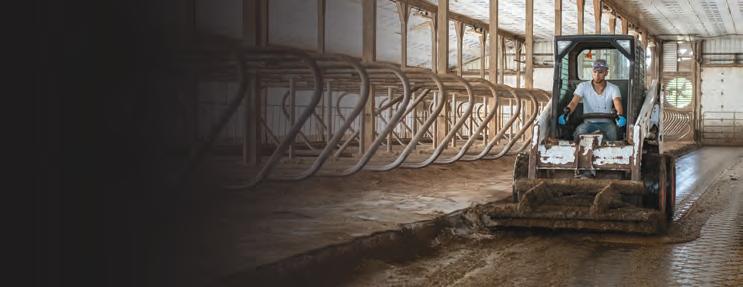
February 1 to 3, 2022
Houston, Texas
Details: convention.ncba.org
Midwest Forage Association/ Wisconsin Custom Operators Symposium
February 21 to 23, 2022
Wisconsin Dells, Wis.
Details: midwestforage.org
Midwest Poultry Federation Convention
March 22 to 24, 2022
Minneapolis, Minn.
Details: midwestpoultry.com
Waste to Worth Conference
April 19 to 22, 2022
Oregon, Ohio
Details: lpelc.org/waste-to-worth
If you would like us to include your event on our list, please send details to info@jofnm.com.
jofnm.com November 2021 | Journal of Nutrient Management | 25 Journal of Nutr ient Management Visit us online at : WWW.JOFNM.COM
MANURE MANAGEMENT IS NOT ONE SIZE FITS ALL
 by Thomas Menke
Ihave developed countless manure management plans over the past 44 years. They all boil down to three basic principles: quantity, quality, and opportunity. The first two are easy, so we expend most of our energy on the last one.
In my early years in this business, “opportunity” may have been to site the open feedlot next to the creek. I think this original “flush-system” went the way of the moldboard plow. Now we are accountable for every pound of excrement and every drop of rain that comes into contact with manure. As a result, our lives and management systems became more complicated.
I wish there was one solution to fit all situations. The best I have experienced is dry poultry litters that compete very effectively with commercial fertilizers. With a myriad of manure “broker” businesses across the country that find homes for manure, it profits the producer, the broker, and the grain farm.
Room for it all
As livestock and poultry farms grew, they often relied on other farmers’ fields for distributing a portion, if not all, of their manure. That takes an element of control away from the manure producer, but good neighbors who understand manure value make life easier. However, I have discovered that even if you control all of the land needed to properly recycle manure, you can still make decisions that complicate the situation. Having adequate storage until appli-
cation fields are ready is imperative. When asked about minimum storage requirements, I advise clients that it’s about what they need to manage effectively, not just meet permit requirements. We all remember the wet springs we inevitably experience. As soon as the fields are dry, farmers want to plant corn, not wait on you to haul manure. What is your contingency plan if the fields are wet and the pit is full? This is when bad things happen.
Plant with purpose
Cropland is the key component to a manure management system. Don’t let it control you. Few things frustrate me more than when we know that manure will need to be applied mid-summer and the farmer says, “I can’t afford to plant wheat.” That may be true from a grain economics perspective, but alternative outlets will be more expensive.
Plan a crop rotation carefully to mesh with your manure application needs. One of my key points for land management is to plant at least 20% of a crop rotation in a small grain that is harvested mid-summer. This provides ideal soil conditions for manure applications and allows for deep or inversion tillage to deal with surface phosphorus accumulations. Then, follow with a cover crop to sequester manure nutrients for the future. It’s also a way to ensure that
40% of the acres are in a winter cover crop that has a direct economic value from grain and straw (or silage).
Looking at the liquid
There are innovative ways to integrate manure and crop management for liquid manures. We developed methods where manure solids are mechanically separated, followed by settling basins and then by an anaerobic treatment lagoon. Separated solids have high organic matter and low nutrients that can be applied to remote sites at high rates.
Settling basin “slurry” is nutrient dense, containing the majority of the phosphorus and is suitable for tanking further distances and applied at low rates. That leaves the treated lagoon water, a low nutrient water with low odor, to be irrigated at high rates on growing crops needing water. This comprises up to 70% of the manure volume with an application window of six months. That’s a big deal and a very economical application cost.
Planning is key to effective manure management. That includes integrating crop rotation, storage, treatment, and application methods together. ■
26 | Journal of Nutrient Management | November 2021 jofnm.com
NUTRIENT INSIGHTS
The author is the president of Menke Consulting LLC, an agronomic and environmental consulting firm in Greenville, Ohio.
Having adequate storage until application fields are ready is imperative.

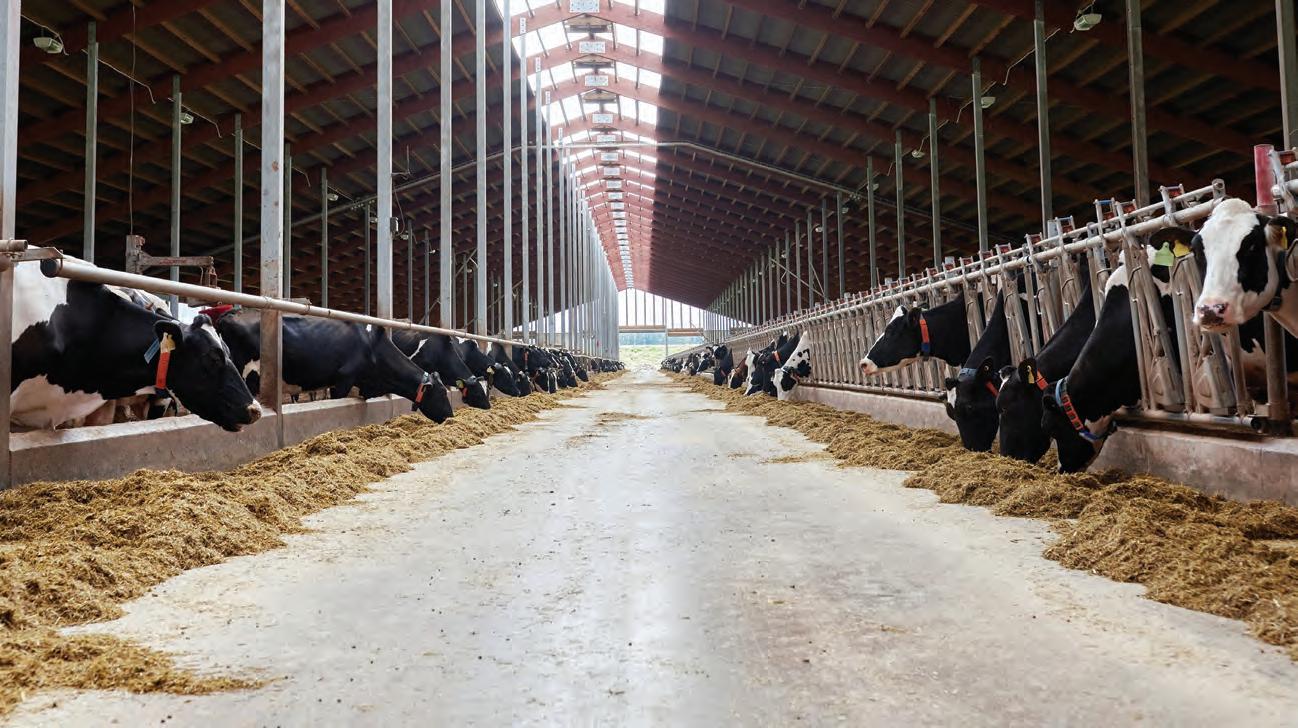
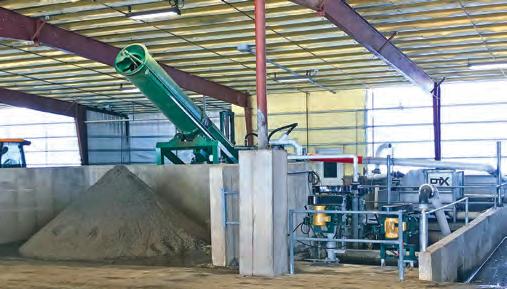
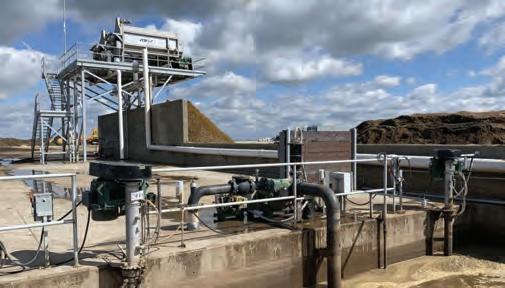

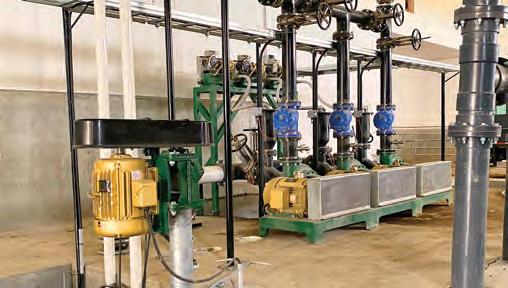
Give us a call for more information on our creative process flow solutions or for a dealer near you. 360-354-6900 • www.daritech.com
With equipment built to last and engineered to use less energy, we’ve been helping you get the most out of your land and herds for over three decades. When you partner with Daritech and our local dealers, you benefit from the knowledge and experience of designing milking and manure management systems used world-wide in small and large herd farms. We have innovative, easy to maintain, fully automated solutions that will increase your efficiency without adding labor and save you money. Call us, or a dealer near you to discover the many ways Daritech can help you focus on the future of your farm. SAND BEDDING RECOVERY SOLIDS SEPARATION FLUSH WATER SYSTEMS MANURE PUMPING


 by Mario de Haro-Martí


 by Thomas Menke


