
1 minute read
Humanities


Humani ties
Course communication.
Advertisement
Satisfaction with the notice given to complete assignments decreased slightly to 84.62% (N=33/39), a drop of 3.31% since semester A. Positively, agreement that academic staff have been helpful when contacted and that they’ve responded within an appropriate timeframe roseby 8.67% and 6.10% respectively. However, understanding of the safety net policyand how it impacts on them is lower than average, with 28.21% (N=11/39) of students reporting that they do not understand the policy.
Course costs.
More students reported that they have faced unexpected costs for course-related materials than in semesterA, rising from 21.43% (N=12/56) to 28.21% (N=11/39). However, the percentage of students reporting that they have struggled to afford costs related to their course fellby 4.94% to 30.77% (N=12/39).
Teaching and learning.
Responses to questions regarding teaching and learning were mixed. Agreement that modules were interesting and enjoyable stayed the same between semesters, whilst agreement that the quality of teaching was consistent across modules increased by 3.94% to 78.94% (N=30/38). Satisfaction with the range of online teaching styles and materials fellby 7.59%, with more than 2 in 5 (21.05%, N=8/38) students disagreeing to this question. Furthermore, agreement that the content taught in modules and will benefit students’ future career fellby 8.10% to 84.21% (N=32/38). Satisfaction with their courses effort to recreate campus-based teaching online is also relatively low, with 1 in 4 (26.31%, N=10/38) students disagreeing to this question.
Personal Tutoring Framework.
Satisfaction with the personal tutoring framework was high. 90.25% (N=37/41) of students agree that they know who their Personal Tutor is, and 92.68% (N=38/41) agree that they would know how to contact then. 78.04% (N=32/41) agree that they have received academic support from their Personal Tutor this year, and 56.10% (N=23/41) report having had contact with their Personal Tutor more than twice.
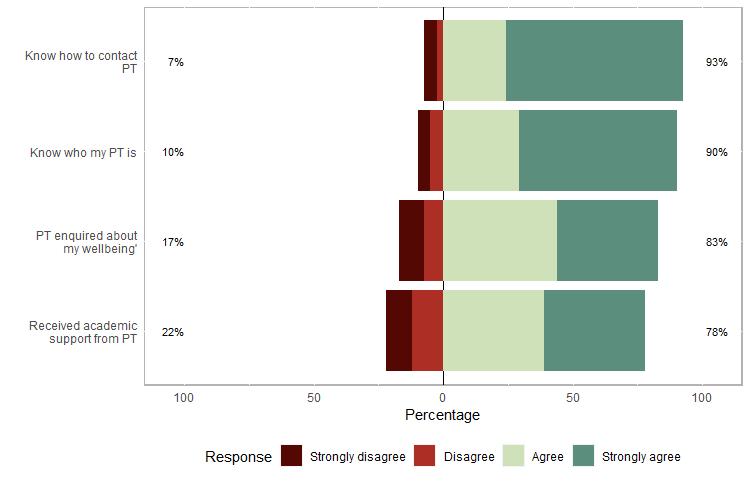
Figure 11. Bar chart showing responses to questions regarding personal tutoring.

