
1 minute read
Our sample


O u r s a m p l e
We received a total of 1691 responses to this survey, which was open to all students at the University of Hertfordshire apart from final year undergraduates, who instead had the opportunity to take part in the NSS. 234 responses were removed from the dataset prior to analysis due to being ineligibleto complete the survey.It is important to note that when comparing between the Student Academic Satisfaction survey released in semester A, which was open to final year undergraduates, and this current survey released in semester B, removing or including final year undergraduates for both surveys did not qualitatively impact on the results. We did receive higher response rates from students within the School of Physics, Engineering and Computer Sciences (SPECS, see Figure 5) and international students (see Figure 4) than expected based on the university population. However, this is unlikely to significantly impact on the results because comparisons were largely drawn within demographics and Schools instead of between (i.e. comparing student satisfaction within one school in semester B to its performance in semester A, as opposed to comparing its performance against other schools).
Advertisement
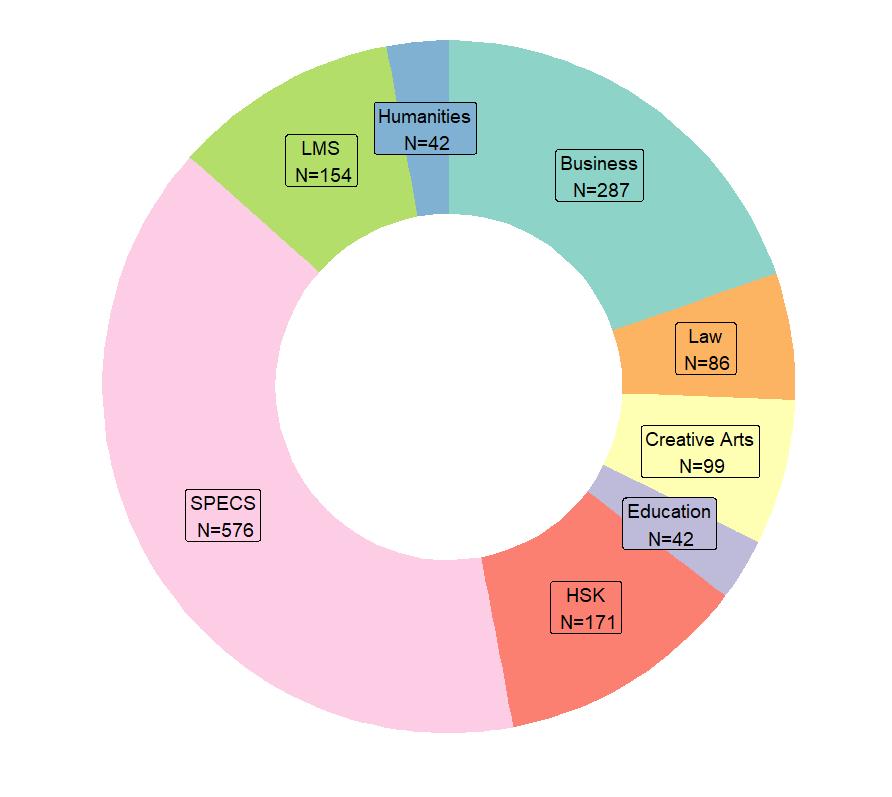
Figure 5. Donut chart showing responses by School of study. Figure 4. Bar chart showing responses by registration status.

