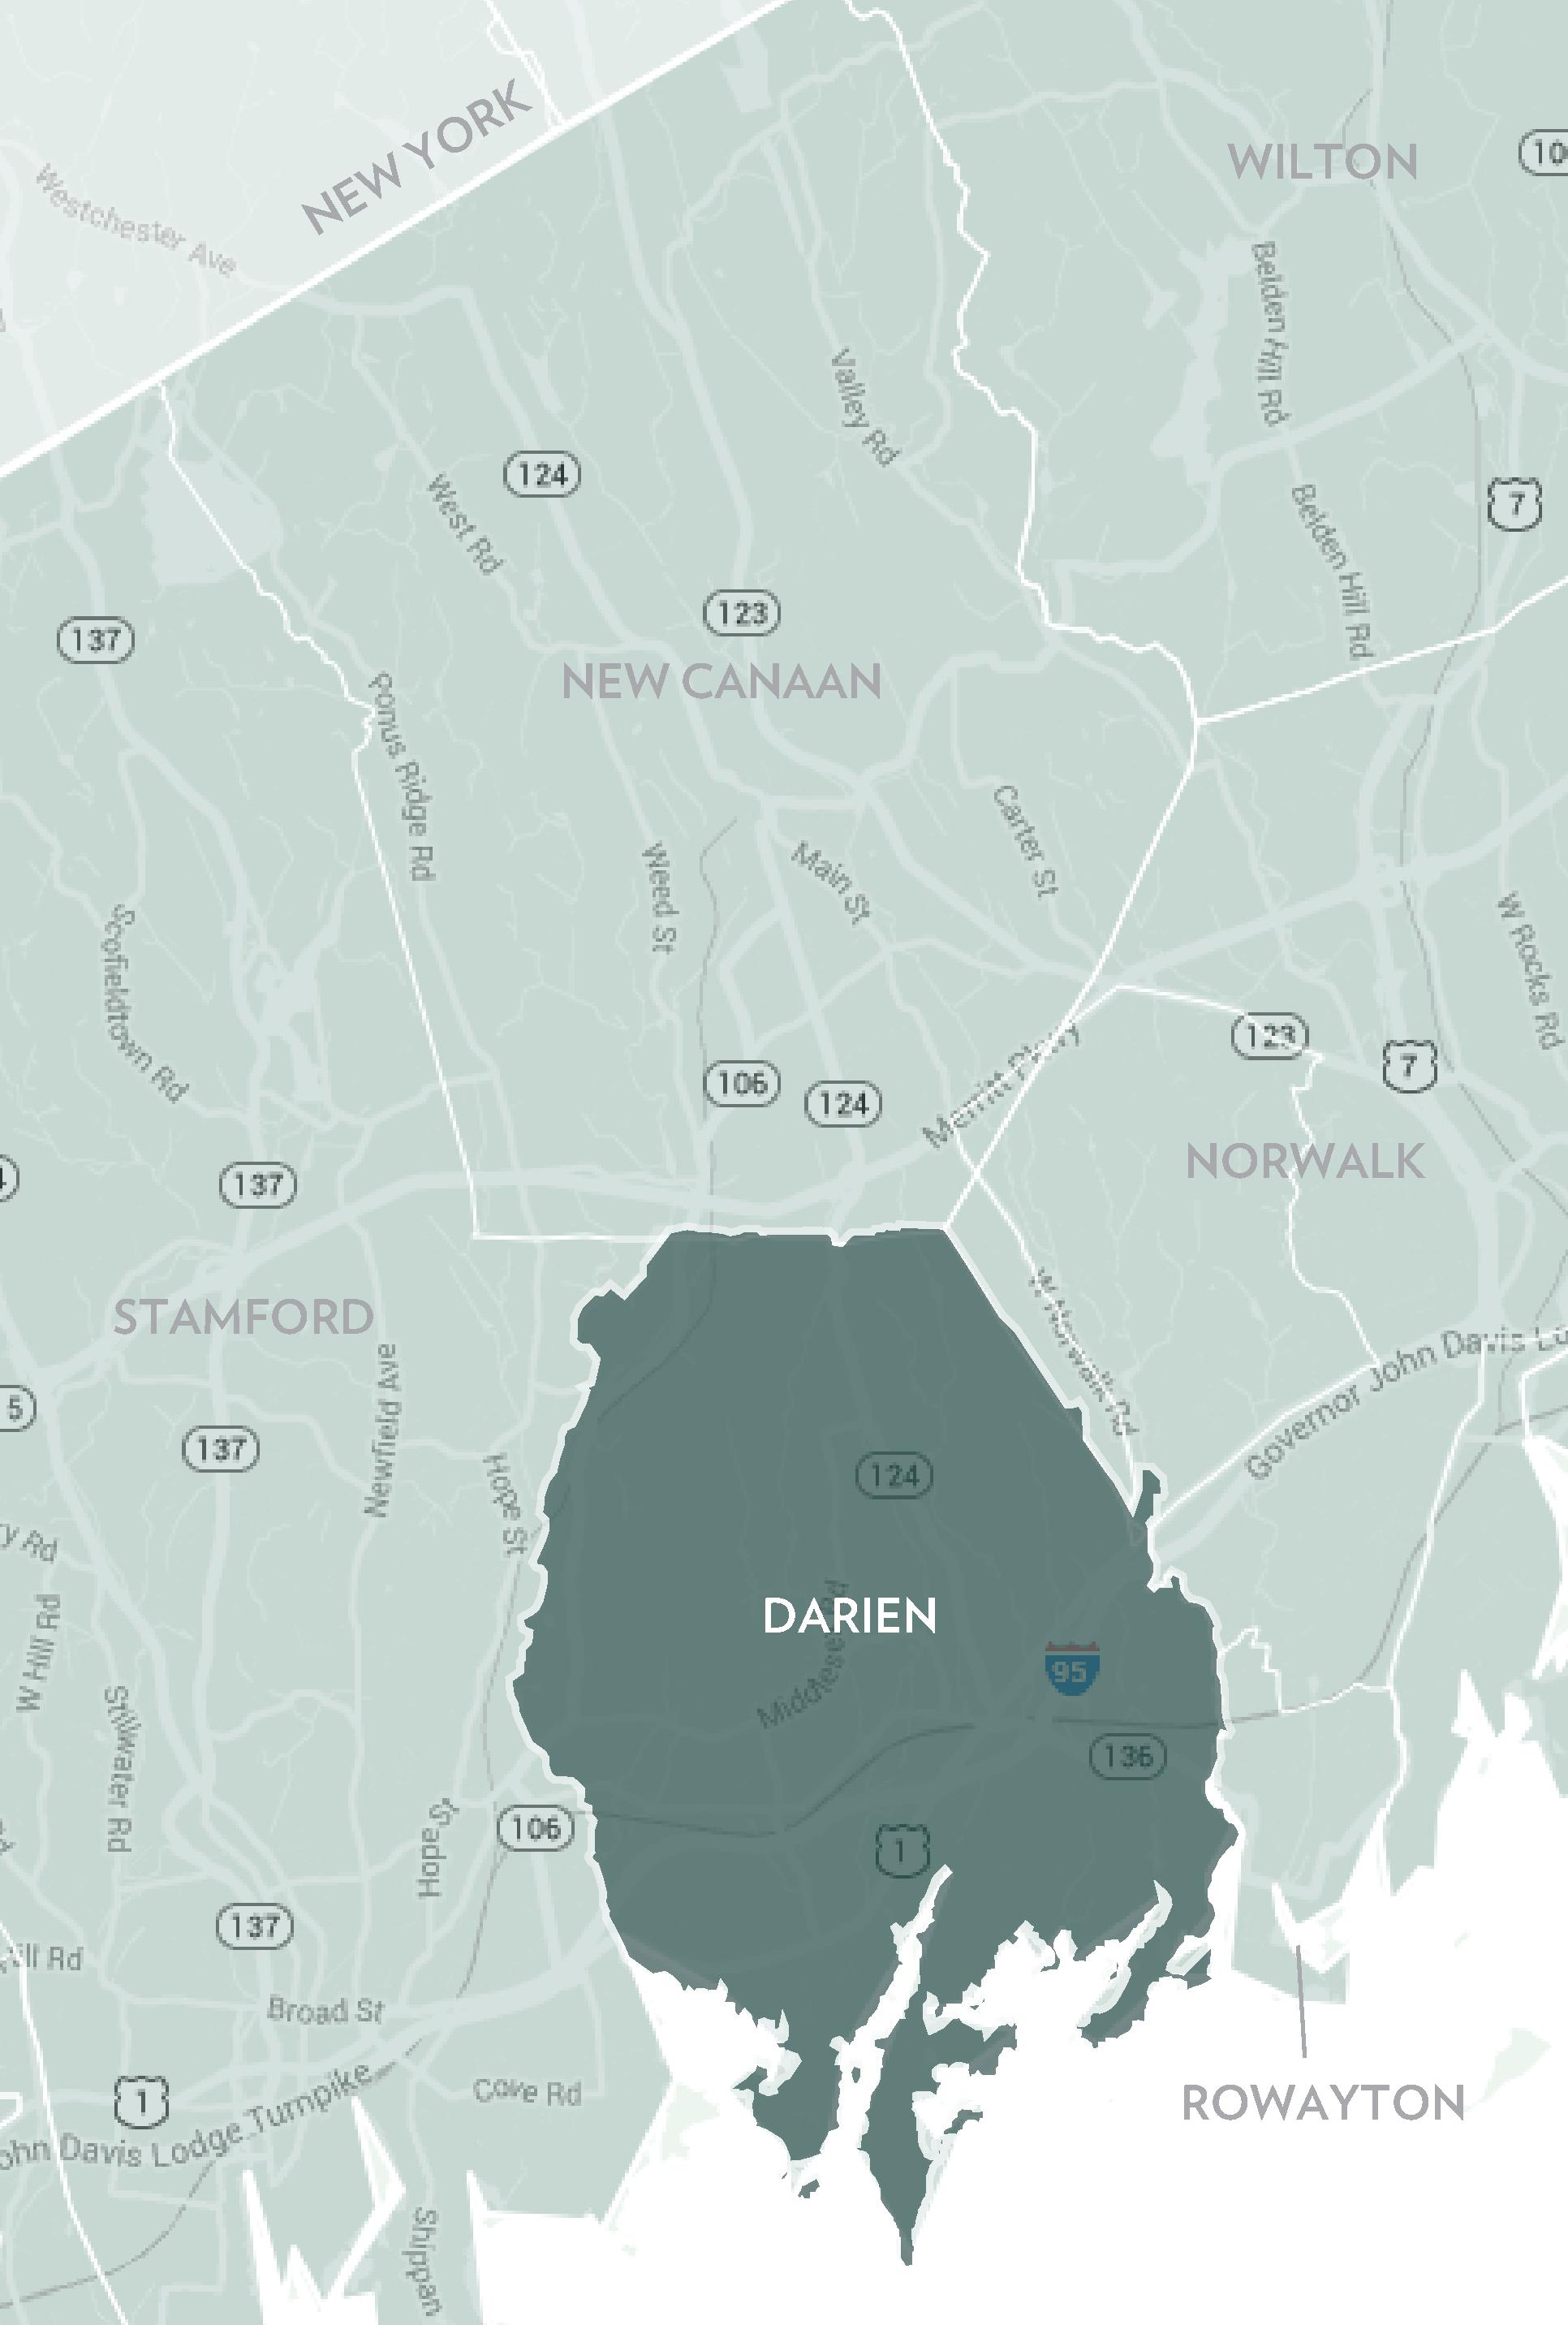
DARIEN, ROWAYTON, NEW CANAAN


Market Report
Q2-2023


914.220.7000 · HOULIHANLAWRENCE.COM LIST WITH CONFIDENCE. PUT THE POWER OF #1 TO WORK FOR YOU. PROUDLY CLOSED NEARLY $8 BILLION IN SALES AND REPRESENTED OVER 7,000 BUYERS AND SELLERS IN 2022 BROKERAGE NORTH OF NYC Source: OKMLS, MHMLS, CGNDMLS, SMARTMLS, 1/1/2022 – 12/31/2022, total dollar volume of single family homes sold by company, Westchester, Putnam, Dutchess, Columbia and Fairfield Counties combined. Source: 1/1/2022 - 12/31/2022 total sales both on and off MLS
MARKET
EXECUTIVE SUMMARY
Houlihan Lawrence is fortunate to operate within the thriving markets north of New York City. The region offers exceptional housing choices, making it accessible to a broad range of buyers. The cultural richness, abundance of parks, proximity to beaches, and recreational opportunities in our counties is unparalleled. As a result, our strong demand for housing over the decades has remained constant, with a few exceptions.
The real estate market in Darien, New Canaan and Rowayton faced heightened challenges during the second quarter of 2023, characterized by low inventory levels and the impact of an abrupt increase in mortgage interest rates. A significant majority of homeowners with mortgages are currently paying below the historical average rate of 6.7%, the highest observed in 20 years. This thwarted the trade up, trade down activity in all our markets and further exacerbated the already low levels of properties for sale. The limited inventory of homes, including luxury properties, continued to create strong competition among buyers and led to upward pressure on prices, in many areas. Some locations did start to see the median price decline, where more units sold at lower price levels and fewer at the high end.
This environment has resulted in a beneficial situation for homeowners who decide to sell. Additionally, with mortgage rates currently stabilizing, they are becoming more inclined to make a move. At all price points, sellers are often able to realize top dollar for their properties, when properly priced, and potentially achieve significant returns on their real estate investments.
As the market leader north of New York City, Houlihan Lawrence is uniquely positioned to assist home buyers and sellers navigate this challenging market and, as always, we are grateful for your continued support.
With Warm Regards,
Liz Nunan President and CEO
Q2-2023
REPORT
QUARTERLY MARKET OVERVIEW

TEN-YEAR MARKET HISTORY
* Homes sold for 2023 are annualized based on actual sales year-to-date.

DARIEN
Q2 2023 Q2 2022 % CHANGE YTD 2023 YTD 2022 % CHANGE HOMES SOLD 72 89 -19.1% 106 142 -25.4% AVERAGE SALE PRICE $3,188,805 $1,949,980 63.5% $2,734,425 $1,990,802 37.4% MEDIAN SALE PRICE $1,940,000 $1,695,000 14.5% $1,887,500 $1,687,750 11.8% AVERAGE PRICE PER SQUARE FOOT $657 $577 13.9% $628 $565 11.2% AVERAGE DAYS ON MARKET 35 23 52.2% 33 40 -17.5% % SALE PRICE TO LIST PRICE 96.1% 106.3% -9.6% 97.0% 103.4% -6.2%
Average Sale Price $1,619,781 $1,705,978 $1,673,646 $1,676,743 $1,603,743 $1,534,435 $1,655,525 $1,929,797 $2,020,720 $2,734,425 Average Sale Price Average Price/SqFt $474 $504 $490 $476 $458 $429 $446 $505 $567 $628 Average Price/SqFt Days On Market 109 105 110 126 122 147 124 70 41 33 Days On Market %Sale Price to List Price 96.9% 95.6% 96.0% 95.5% 94.7% 94.0% 96.3% 99.4% 102.7% 97.0% %Sale Price to List Price
HOULIHANLAWRENCE.COM
SUPPLY/DEMAND ANALYSIS
SOLD PROPERTIES
DARIEN
AS OF JUNE 30, 2023 AS OF JUNE 30, 2022 2023 vs. 2022 PRICE RANGE SUPPLY: ACTIVE LISTINGS DEMAND: PENDING SALES SUPPLY/ DEMAND RATIO* SUPPLY: ACTIVE LISTINGS DEMAND: PENDING SALES SUPPLY/ DEMAND RATIO* % CHANGE IN LISTINGS % CHANGE IN PENDINGS $0 - $499,999 0 0 Not Valid 1 1 1 -100.0% -100.0% $500,000 - $699,999 3 1 3 7 0 Not Valid -57.1% 0.0% $700,000 - $999,999 2 6 1 8 9 1 -75.0% -33.3% $1,000,000 - $1,499,999 5 13 1 13 12 1 -61.5% 8.3% $1,500,000 - $1,999,999 4 10 1 11 9 1 -63.6% 11.1% $2,000,000 - $2,499,999 5 4 1 5 3 2 0.0% 33.3% $2,500,000 - $2,999,999 4 5 1 8 9 1 -50.0% -44.4% $3,000,000 - $3,999,999 5 6 1 8 7 1 -37.5% -14.3% $4,000,000 and up 20 4 5 9 3 3 122.2% 33.3% MarketTotals 48 49 1 70 53 1 -31.4% -7.5% *Supply Demand Ratio Key 1-4: High Demand 5-6: Balanced 7-9: Low Demand 10+: Very Low Demand
YEAR-TO-DATE YEAR-OVER-YEAR PRICE RANGE 01/01/202306/30/2023 01/01/202206/30/2022 % CHANGE 2023/2022 07/01/202206/30/2023 07/01/202106/30/2022 % CHANGE 2023/2022 $0 - $499,999 1 0 Not Valid 1 0 Not Valid $500,000 - $699,999 4 6 -33.3% 11 12 -8.3% $700,000 - $999,999 14 21 -33.3% 32 43 -25.6% $1,000,000 - $1,499,999 21 33 -36.4% 56 76 -26.3% $1,500,000 - $1,999,999 17 32 -46.9% 40 80 -50.0% $2,000,000 - $2,499,999 23 15 53.3% 39 33 18.2% $2,500,000 - $2,999,999 11 10 10.0% 27 28 -3.6% $3,000,000 - $4,999,999 14 20 -30.0% 38 50 -24.0% $5,000,000 and up 1 5 -80.0% 4 11 -63.6% MarketTotals 106 142 -25.4% 248 333 -25.5%
Source: Smart MLS, Darien, Single Family Homes, Sold
QUARTERLY MARKET OVERVIEW
ROWAYTON

TEN-YEAR MARKET HISTORY
* Homes sold for 2023 are annualized based on actual sales year-to-date.

Q2 2023 Q2 2022 % CHANGE YTD 2023 YTD 2022 % CHANGE HOMES SOLD 16 24 -33.3% 23 34 -32.4% AVERAGE SALE PRICE $2,317,281 $1,594,212 45.4% $2,101,848 $1,501,914 39.9% MEDIAN SALE PRICE $1,960,000 $1,547,500 26.7% $1,870,000 $1,362,500 37.2% AVERAGE PRICE PER SQUARE FOOT $683 $601 13.6% $650 $594 9.4% AVERAGE DAYS ON MARKET 25 22 13.6% 27 32 -15.6% % SALE PRICE TO LIST PRICE 103.3% 106.9% -3.4% 102.5% 105.6% -2.9%
Average Sale Price $1,340,895 $1,273,026 $1,337,148 $1,379,317 $1,273,417 $1,276,696 $1,345,651 $1,774,299 $1,762,701 $2,101,848 Average Sale Price Average Price/SqFt $439 $435 $463 $459 $445 $439 $452 $548 $615 $650 Average Price/SqFt Days On Market 117 136 145 110 92 139 110 80 37 27 Days On Market %Sale Price to List Price 96.2% 94.9% 95.3% 95.0% 95.7% 95.3% 96.6% 99.3% 102.7% 102.5% %Sale Price to List Price
HOULIHANLAWRENCE.COM
SUPPLY/DEMAND ANALYSIS
SOLD PROPERTIES
ROWAYTON
AS OF JUNE 30, 2023 AS OF JUNE 30, 2022 2023 vs. 2022 PRICE RANGE SUPPLY: ACTIVE LISTINGS DEMAND: PENDING SALES SUPPLY/ DEMAND RATIO* SUPPLY: ACTIVE LISTINGS DEMAND: PENDING SALES SUPPLY/ DEMAND RATIO* % CHANGE IN LISTINGS % CHANGE IN PENDINGS $0 - $499,999 0 0 Not Valid 0 0 Not Valid 0.0% 0.0% $500,000 - $699,999 1 0 Not Valid 1 0 Not Valid 0.0% 0.0% $700,000 - $999,999 0 1 0 4 0 Not Valid -100.0% 0.0% $1,000,000 - $1,499,999 3 0 Not Valid 3 4 1 0.0% -100.0% $1,500,000 - $1,999,999 1 6 1 5 5 1 -80.0% 20.0% $2,000,000 - $2,499,999 0 0 Not Valid 2 1 2 -100.0% -100.0% $2,500,000 - $2,999,999 1 1 1 5 2 3 -80.0% -50.0% $3,000,000 - $3,999,999 3 1 3 0 2 0 0.0% -50.0% $4,000,000 and up 0 0 Not Valid 2 1 2 -100.0% -100.0% MarketTotals 9 9 1 22 15 1 -59.1% -40.0% *Supply Demand Ratio Key 1-4: High Demand 5-6: Balanced 7-9: Low Demand 10+: Very Low Demand
YEAR-TO-DATE YEAR-OVER-YEAR PRICE RANGE 01/01/202306/30/2023 01/01/202206/30/2022 % CHANGE 2023/2022 07/01/202206/30/2023 07/01/202106/30/2022 % CHANGE 2023/2022 $0 - $499,999 0 0 Not Valid 0 0 Not Valid $500,000 - $699,999 2 4 -50.0% 4 5 -20.0% $700,000 - $999,999 3 7 -57.1% 7 14 -50.0% $1,000,000 - $1,499,999 2 8 -75.0% 11 16 -31.3% $1,500,000 - $1,999,999 5 7 -28.6% 20 15 33.3% $2,000,000 - $2,499,999 4 4 0.0% 6 14 -57.1% $2,500,000 - $2,999,999 5 2 150.0% 12 3 300.0% $3,000,000 - $4,999,999 1 2 -50.0% 4 7 -42.9% $5,000,000 and up 1 0 Not Valid 2 1 100.0% MarketTotals 23 34 -32.4% 66 75 -12.0%
Source: Smart MLS, Rowayton, Single Family Homes, Sold
QUARTERLY MARKET OVERVIEW
NEW CANAAN

TEN-YEAR MARKET HISTORY
* Homes sold for 2023 are annualized based on actual sales year-to-date.

Q2 2023 Q2 2022 % CHANGE YTD 2023 YTD 2022 % CHANGE HOMES SOLD 65 72 -9.7% 96 126 -23.8% AVERAGE SALE PRICE $2,122,361 $2,201,083 -3.6% $2,109,635 $2,085,693 1.1% MEDIAN SALE PRICE $2,065,000 $2,100,000 -1.7% $2,040,000 $1,902,500 7.2% AVERAGE PRICE PER SQUARE FOOT $494 $447 10.5% $476 $437 8.9% AVERAGE DAYS ON MARKET 46 48 -4.2% 54 62 -12.9% % SALE PRICE TO LIST PRICE 100.9% 103.8% -2.8% 100.0% 101.7% -1.7%
Average Sale Price $1,929,472 $1,783,190 $1,770,026 $1,713,201 $1,628,160 $1,424,859 $1,670,517 $1,995,193 $2,177,142 $2,109,635 Average Sale Price Average Price/SqFt $389 $406 $356 $355 $341 $316 $337 $400 $458 $476 Average Price/SqFt Days On Market 122 126 148 147 138 164 137 83 55 54 Days On Market %Sale Price to List Price 94.9% 95.8% 93.8% 94.0% 92.2% 92.8% 95.4% 99.1% 100.6% 100.0% %Sale Price to List Price
HOULIHANLAWRENCE.COM
SUPPLY/DEMAND ANALYSIS
SOLD PROPERTIES
Source: Smart MLS, New Canaan, Single Family Homes, Sold
NEW CANAAN
AS OF JUNE 30, 2023 AS OF JUNE 30, 2022 2023 vs. 2022 PRICE RANGE SUPPLY: ACTIVE LISTINGS DEMAND: PENDING SALES SUPPLY/ DEMAND RATIO* SUPPLY: ACTIVE LISTINGS DEMAND: PENDING SALES SUPPLY/ DEMAND RATIO* % CHANGE IN LISTINGS % CHANGE IN PENDINGS $0 - $499,999 0 0 Not Valid 0 0 Not Valid 0.0% 0.0% $500,000 - $699,999 0 1 0 1 1 1 -100.0% 0.0% $700,000 - $999,999 4 2 2 7 2 4 -42.9% 0.0% $1,000,000 - $1,499,999 11 9 1 18 10 2 -38.9% -10.0% $1,500,000 - $1,999,999 6 13 1 14 10 1 -57.1% 30.0% $2,000,000 - $2,499,999 6 7 1 10 6 2 -40.0% 16.7% $2,500,000 - $2,999,999 10 5 2 7 8 1 42.9% -37.5% $3,000,000 - $3,999,999 13 7 2 16 10 2 -18.8% -30.0% $4,000,000 and up 25 2 13 23 5 5 8.7% -60.0% MarketTotals 75 46 2 96 52 2 -21.9% -11.5% *Supply Demand Ratio Key 1-4: High Demand 5-6: Balanced 7-9: Low Demand 10+: Very Low Demand
YEAR-TO-DATE YEAR-OVER-YEAR PRICE RANGE 01/01/202306/30/2023 01/01/202206/30/2022 % CHANGE 2023/2022 07/01/202206/30/2023 07/01/202106/30/2022 % CHANGE 2023/2022 $0 - $499,999 0 0 Not Valid 0 0 Not Valid $500,000 - $699,999 0 2 -100.0% 2 4 -50.0% $700,000 - $999,999 12 9 33.3% 22 20 10.0% $1,000,000 - $1,499,999 15 31 -51.6% 48 85 -43.5% $1,500,000 - $1,999,999 20 26 -23.1% 44 89 -50.6% $2,000,000 - $2,499,999 24 19 26.3% 44 46 -4.3% $2,500,000 - $2,999,999 10 23 -56.5% 28 42 -33.3% $3,000,000 - $4,999,999 13 14 -7.1% 36 40 -10.0% $5,000,000 and up 2 2 0.0% 6 3 100.0% MarketTotals 96 126 -23.8% 230 329 -30.1%
3 GLOBAL NETWORKS - REACHING 56 COUNTRIES & 6 CONTINENTS Leading Real Estate Companies of the World | Luxury Portfolio International Board of Regents Luxury Real Estate


