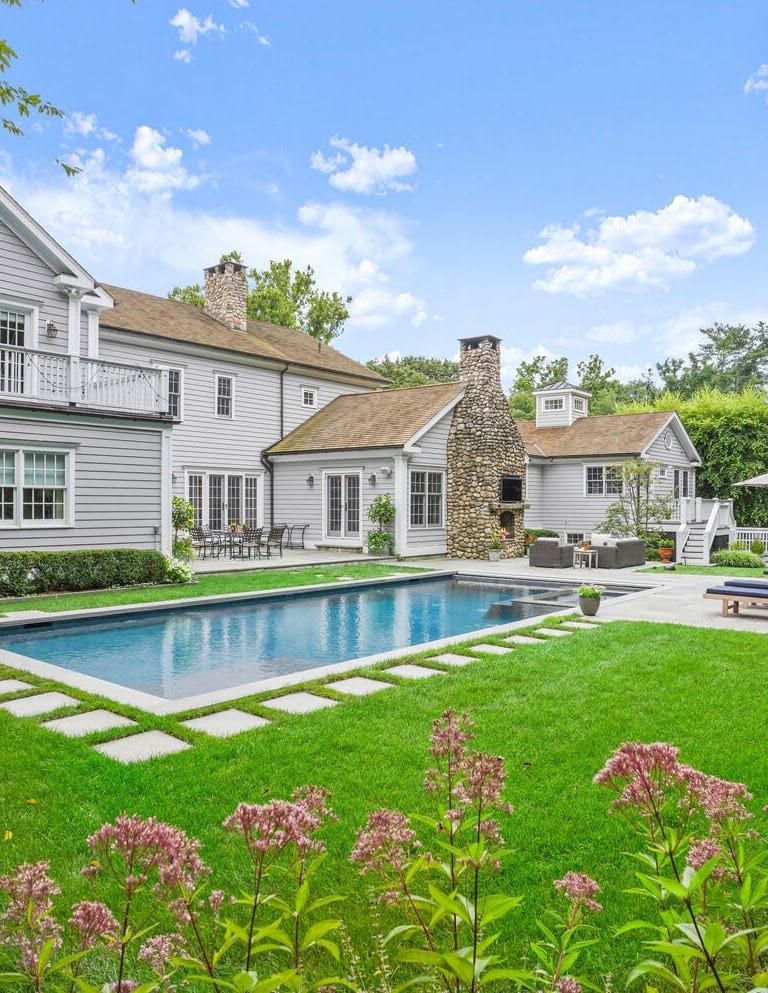
What’s Your Home Worth?
In today’s market, knowing the value of your home is more important than ever. The Houlihan Lawrence home valuation tool offers valuable insights on a home’s market value, the profiles of potential buyers and more.


60-65% of BUYERS ARE FROM NYC’S NORTHERN SUBURBS 25-30% of BUYERS ARE FROM NYC ≈5% of BUYERS ARE FROM OTHER STATES ≈5% of BUYERS ARE FROM INTERNATIONAL HoulihanLawrenceTransactionsDatabase,includesallHoulihanLawrence buyersandallotherbuyersofHoulihanLawrencelistings.Percentagemay buyersnotaddupto100%duetorounding.
andallotherbuyersofHoulihanLawrencelistings.Percentagemay













SCAN QR CODE TO LEARN ABOUT YOUR HOME’ S VALUE 914.220.7000 • HOULIHANLAWRENCE.COM
15.4 77 99.5 96 5 $2,151,792 1.4% 0% 0% 0.1% -0.6% -0.2% AVERAGE SALES PRICE HOMES SOLD AVERAGE DAYS ON MARKET % OF SALES PRICE HOMES FOR SALE MONTHS ON INVENTORY Household Incomes Below 75K 75K to 100K 100K to 150K 150K to 250K 250K to 500K 500k or more Housing Stock Owned Rented Vacant 1556 OWNED
EXECUTIVE SUMMARY
As we welcome the spring season, we reflect on the first quarter of 2024 and the dynamic landscape of the real estate market in areas north of NYC. The market has remained strong and is characterized by robust buyer demand, coupled with historically low inventory levels, that continues to drive prices upward in most segments. It remains optimal for sellers to realize their highest prices.
Despite some pockets experiencing a slight uptick in inventory during Q1 2024, specifically in the higher price ranges, overall conditions remain favorable for sellers and challenging for buyers. Multiple offers remain a common occurrence, demonstrating the importance of working with a knowledgeable buyers’ agent to secure a home. Their expertise can provide invaluable guidance and market insight ensuring that buyers make informed and effective decisions.
Most everyone has seen the news stories regarding the National Association of Realtors (NAR) proposed settlement, which remains subject to court approval. NAR specifically noted they are working with the Department of Justice, which has not yet weighed in on the terms. Any changes to business procedures will likely go into effect only in July or later as and when the NAR settlement is approved. We plan to take care in implementing any required changes in practices just as we have implemented and adhered to numerous changes in law and practice over the years.
Since its inception in 1888, Houlihan Lawrence has been committed to providing both our buyers and our sellers with best-in-class service and nothing will change that commitment. Meeting our fiduciary standards to both our buyer and seller clients is always our top priority. It’s why we list more homes and represent more buyers than any other company North of NYC.
We extend our heartfelt thanks to all our clients who have put their trust in us. As your real estate partner, we continually strive for excellence in serving your real estate needs.
With Warm Regards,
Liz Nunan President and CEO
Q1-2024
REPORT
MARKET
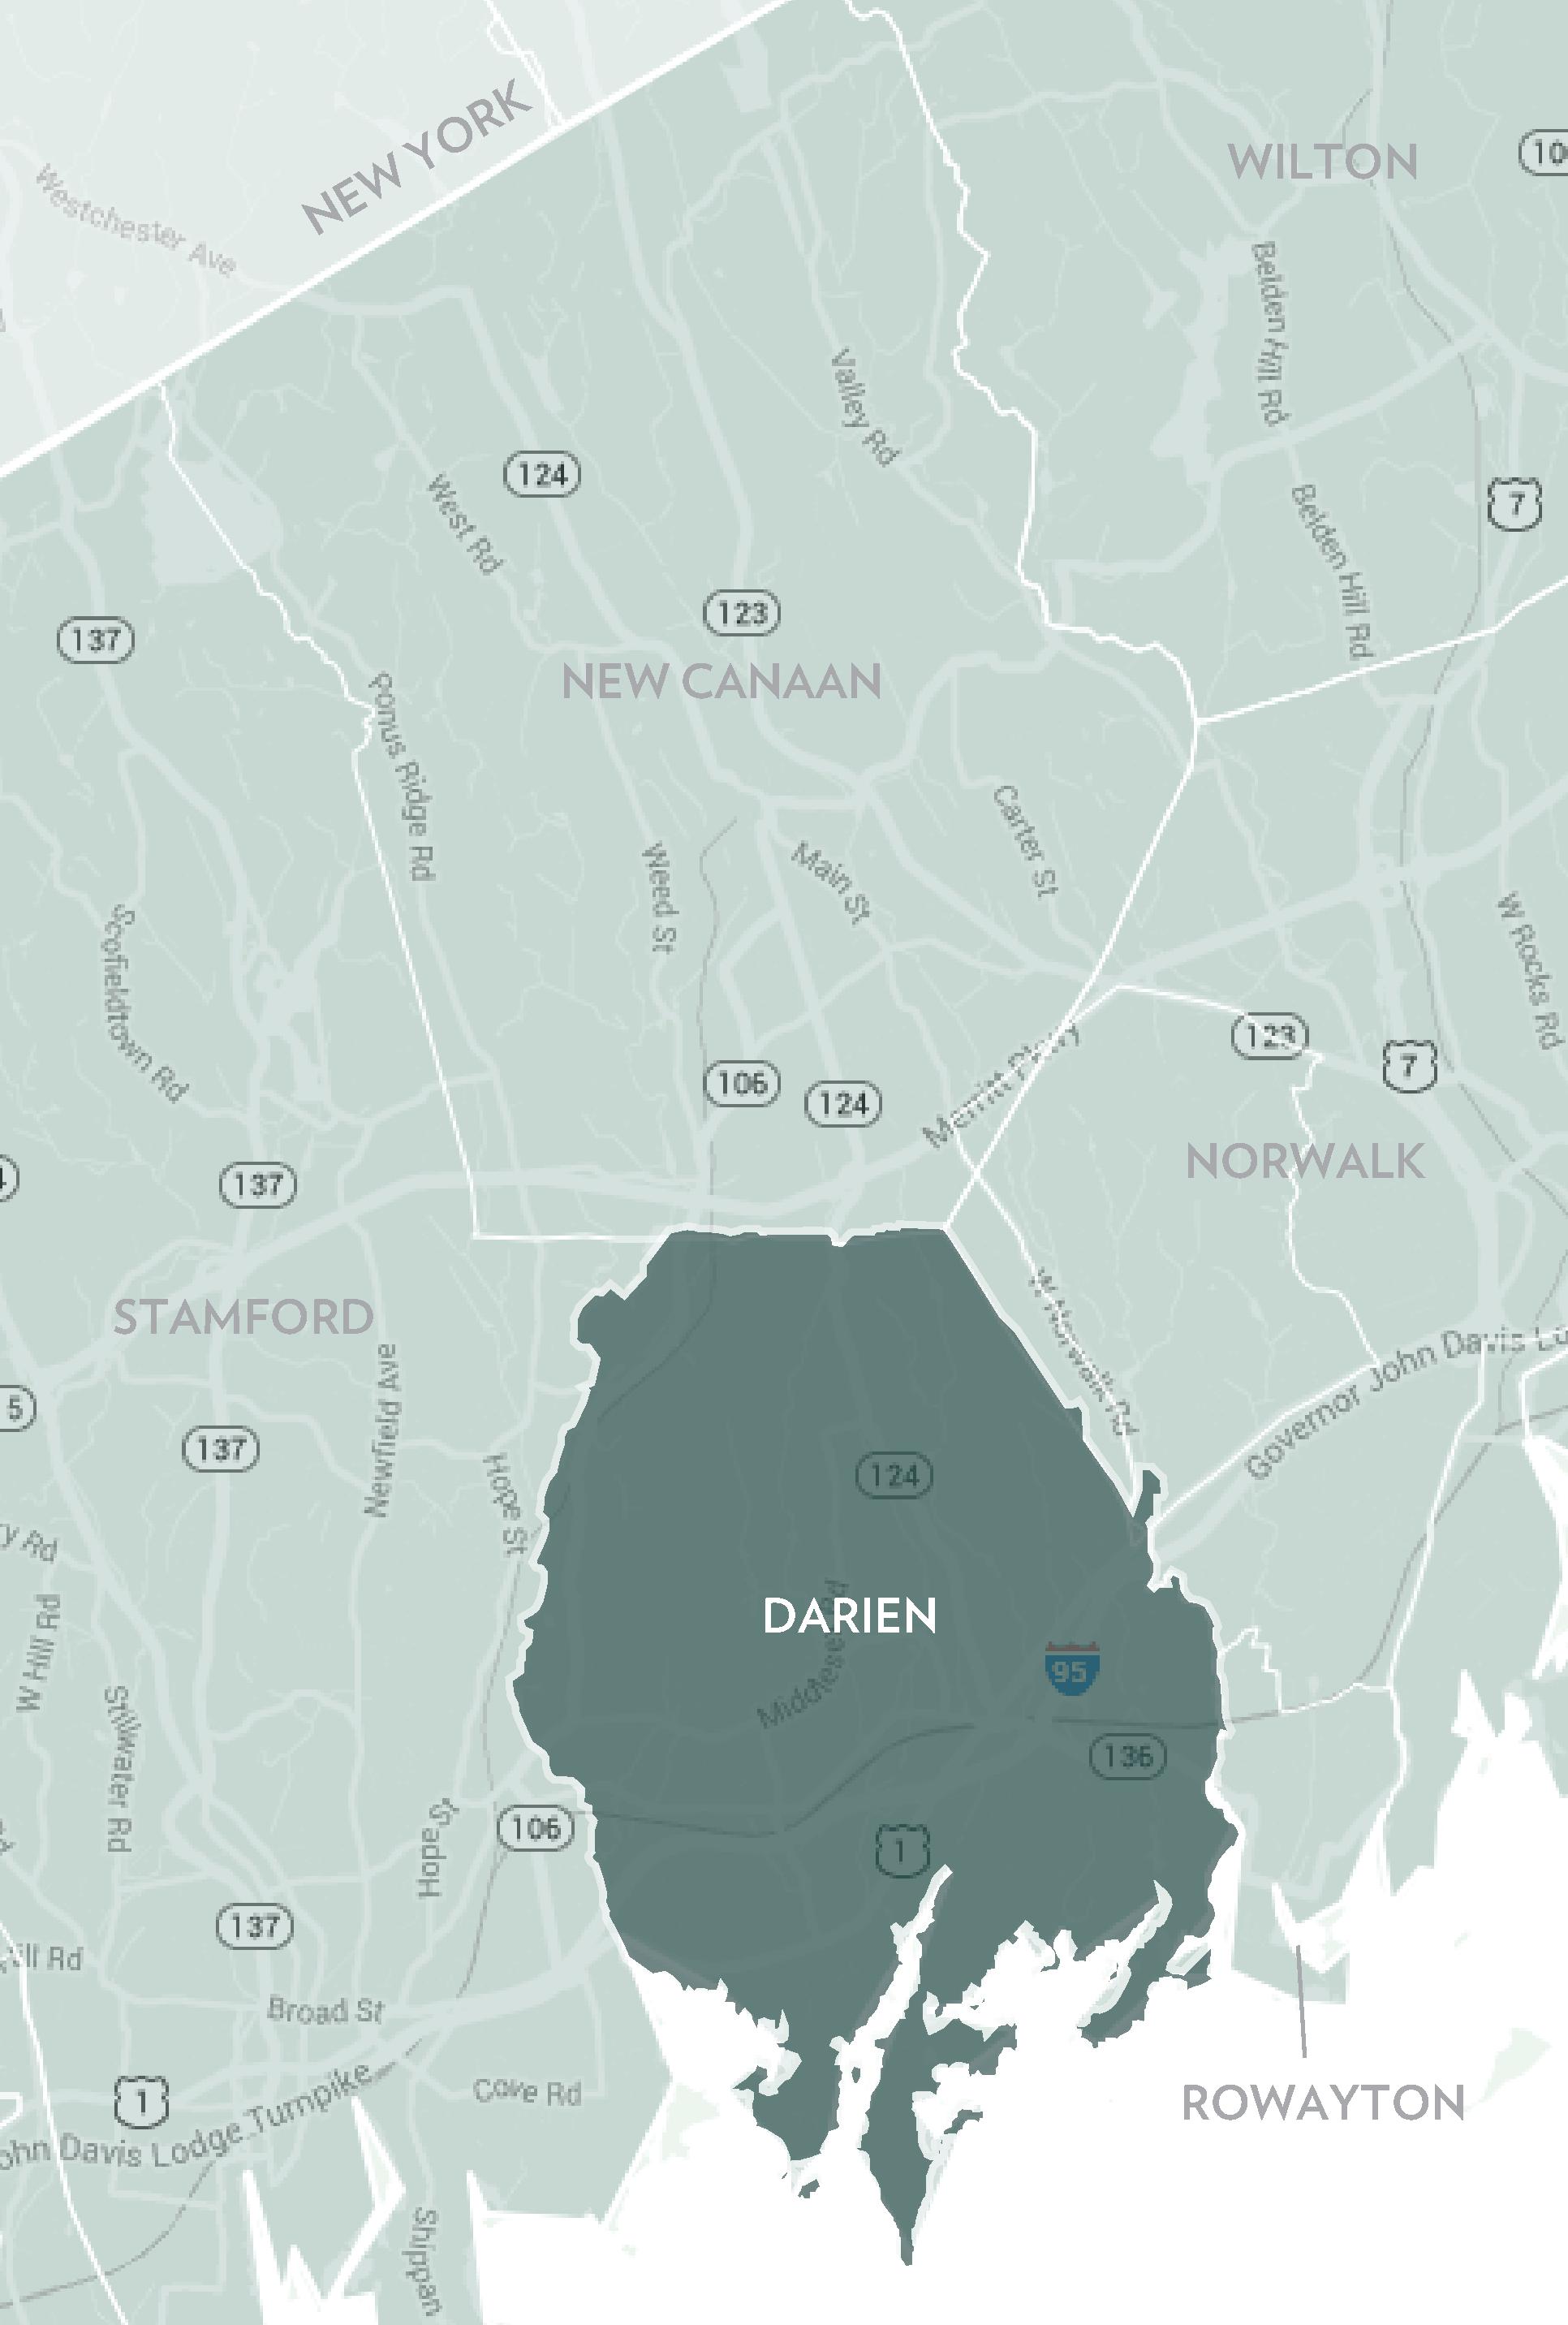
DARIEN
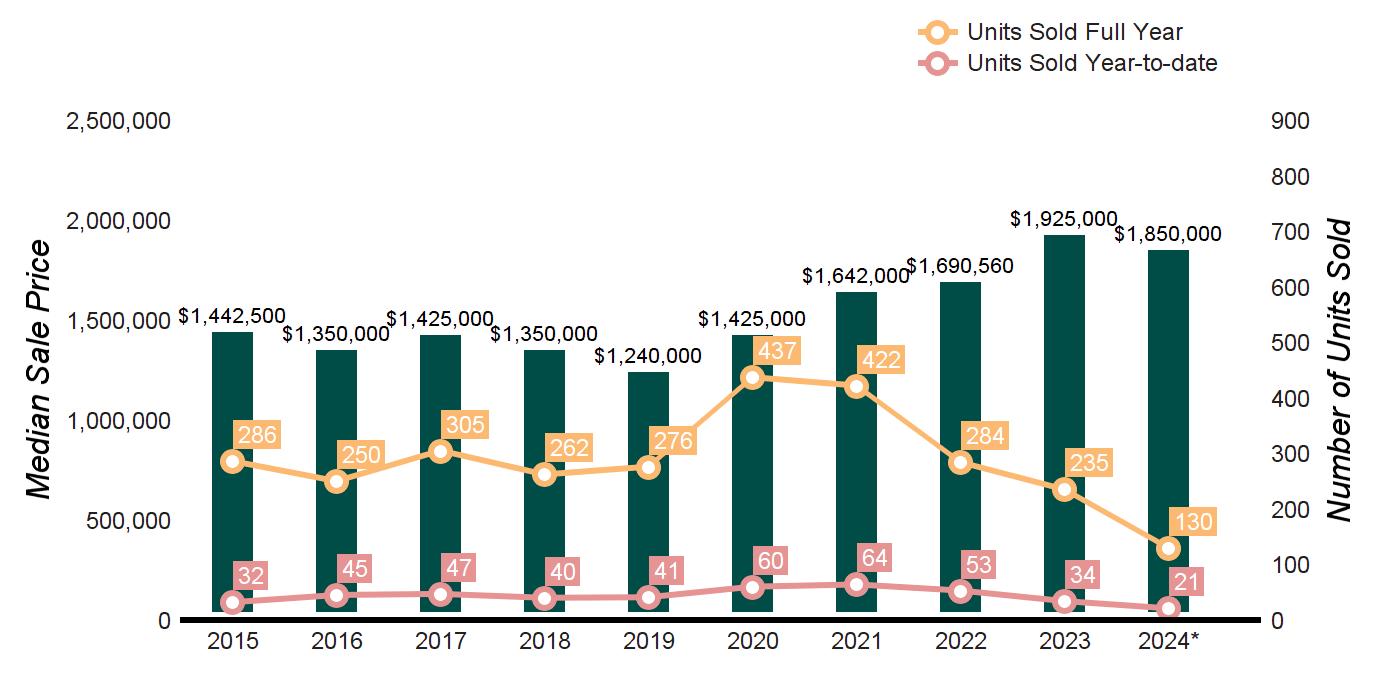
* Homes sold for 2024 are annualized based on actual sales year-to-date.
Q1 2024 Q1 2023 % CHANGE FULL YEAR 2023 FULL YEAR 2022 % CHANGE HOMES SOLD 21 34 -38.2% 235 284 -17.3% AVERAGE SALE PRICE $2,360,571 $1,772,208 33.2% $2,450,673 $2,020,720 21.3% MEDIAN SALE PRICE $1,850,000 $1,472,500 25.6% $1,925,000 $1,690,560 13.9% AVERAGE PRICE PER SQUARE FOOT $623 $567 9.9% $640 $567 12.9% AVERAGE DAYS ON MARKET 71 43 65.1% 39 41 -4.9% % SALE PRICE TO LIST PRICE 101.2% 100.8% 0.4% 99.3% 102.7% -3.3%
QUARTERLY MARKET OVERVIEW
Average Sale Price $1,705,978 $1,673,646 $1,676,743 $1,603,743 $1,534,435 $1,655,525 $1,929,797 $2,020,720 $2,450,673 $2,360,571 Average Sale Price Average Price/SqFt $504 $490 $476 $458 $429 $446 $505 $567 $640 $623 Average Price/SqFt Days On Market 105 110 126 122 147 124 70 41 39 71 Days On Market %Sale Price to List Price 95.6% 96.0% 95.5% 94.7% 94.0% 96.3% 99.4% 102.7% 99.3% 101.2% %Sale Price to List Price
TEN-YEAR MARKET HISTORY
HOULIHANLAWRENCE.COM
SUPPLY/DEMAND ANALYSIS
SOLD PROPERTIES
DARIEN
AS OF MARCH 31, 2024 AS OF MARCH 31, 2023 2024 vs. 2023 PRICE RANGE SUPPLY: ACTIVE LISTINGS DEMAND: PENDING SALES SUPPLY/ DEMAND RATIO* SUPPLY: ACTIVE LISTINGS DEMAND: PENDING SALES SUPPLY/ DEMAND RATIO* % CHANGE IN LISTINGS % CHANGE IN PENDINGS $0 - $499,999 0 0 Not Valid 0 0 Not Valid 0.0% 0.0% $500,000 - $699,999 0 1 0 2 0 Not Valid -100.0% 0.0% $700,000 - $999,999 1 1 1 7 5 1 -85.7% -80.0% $1,000,000 - $1,499,999 5 4 1 6 3 2 -16.7% 33.3% $1,500,000 - $1,999,999 3 6 1 5 10 1 -40.0% -40.0% $2,000,000 - $2,499,999 3 3 1 4 6 1 -25.0% -50.0% $2,500,000 - $2,999,999 3 2 2 2 4 1 50.0% -50.0% $3,000,000 - $3,999,999 2 3 1 10 1 10 -80.0% 200.0% $4,000,000 and up 11 4 3 10 4 3 10.0% 0.0% MarketTotals 28 24 1 46 33 1 -39.1% -27.3% *Supply Demand Ratio Key 1-4: High Demand 5-6: Balanced 7-9: Low Demand 10+: Very Low Demand
YEAR-TO-DATE YEAR-OVER-YEAR PRICE RANGE 01/01/202403/31/2024 01/01/202303/31/2023 % CHANGE 2024/2023 04/01/202303/31/2024 04/01/202203/31/2023 % CHANGE 2024/2023 $0 - $499,999 0 1 -100.0% 2 1 100.0% $500,000 - $699,999 1 3 -66.7% 8 13 -38.5% $700,000 - $999,999 5 5 0.0% 22 36 -38.9% $1,000,000 - $1,499,999 3 9 -66.7% 42 64 -34.4% $1,500,000 - $1,999,999 5 2 150.0% 40 47 -14.9% $2,000,000 - $2,499,999 1 7 -85.7% 42 33 27.3% $2,500,000 - $2,999,999 1 3 -66.7% 19 27 -29.6% $3,000,000 - $4,999,999 3 4 -25.0% 38 38 0.0% $5,000,000 and up 2 0 Not Valid 9 6 50.0% MarketTotals 21 34 -38.2% 222 265 -16.2%
Source: Smart MLS, Darien, Single Family Homes, Sold
QUARTERLY MARKET OVERVIEW

TEN-YEAR MARKET HISTORY
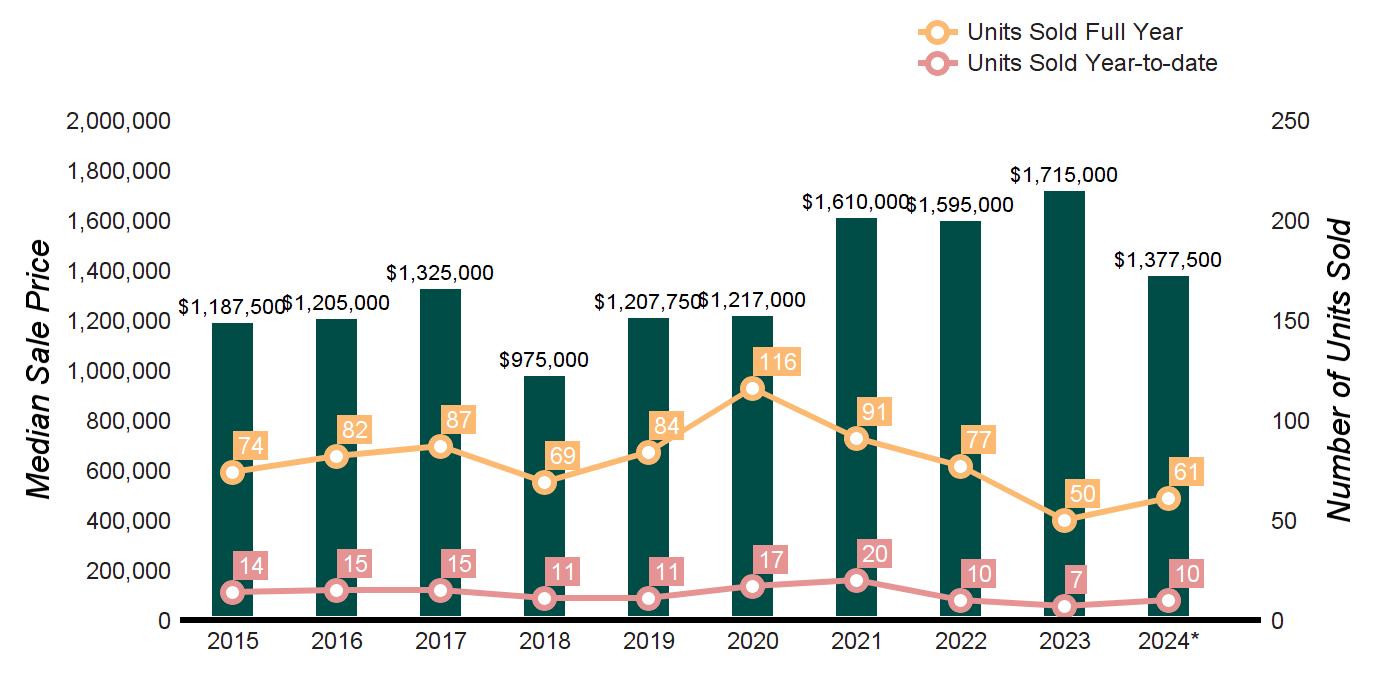
* Homes sold for 2024 are annualized based on actual sales year-to-date.
ROWAYTON
Q1 2024 Q1 2023 % CHANGE FULL YEAR 2023 FULL YEAR 2022 % CHANGE HOMES SOLD 10 7 42.9% 50 77 -35.1% AVERAGE SALE PRICE $1,833,400 $1,609,431 13.9% $1,910,960 $1,762,701 8.4% MEDIAN SALE PRICE $1,377,500 $1,250,000 10.2% $1,715,000 $1,595,000 7.5% AVERAGE PRICE PER SQUARE FOOT $748 $574 30.3% $649 $615 5.5% AVERAGE DAYS ON MARKET 89 32 178.1% 37 37 0.0% % SALE PRICE TO LIST PRICE 97.5% 100.0% -2.5% 103.3% 102.7% 0.6%
Average Sale Price $1,273,026 $1,337,148 $1,379,317 $1,273,417 $1,276,696 $1,345,651 $1,774,299 $1,762,701 $1,910,960 $1,833,400 Average Sale Price Average Price/SqFt $435 $463 $459 $445 $439 $452 $548 $615 $649 $748 Average Price/SqFt Days On Market 136 145 110 92 139 110 80 37 37 89 Days On Market %Sale Price to List Price 94.9% 95.3% 95.0% 95.7% 95.3% 96.6% 99.3% 102.7% 103.3% 97.5% %Sale Price to List Price
HOULIHANLAWRENCE.COM
SUPPLY/DEMAND ANALYSIS
ROWAYTON
AS OF MARCH 31, 2024 AS OF MARCH 31, 2023 2024 vs. 2023 PRICE RANGE SUPPLY: ACTIVE LISTINGS DEMAND: PENDING SALES SUPPLY/ DEMAND RATIO* SUPPLY: ACTIVE LISTINGS DEMAND: PENDING SALES SUPPLY/ DEMAND RATIO* % CHANGE IN LISTINGS % CHANGE IN PENDINGS $0 - $499,999 0 0 Not Valid 0 0 Not Valid 0.0% 0.0% $500,000 - $699,999 0 0 Not Valid 1 0 Not Valid -100.0% 0.0% $700,000 - $999,999 2 4 1 1 2 1 100.0% 100.0% $1,000,000 - $1,499,999 2 2 1 2 1 2 0.0% 100.0% $1,500,000 - $1,999,999 1 3 1 1 1 1 0.0% 200.0% $2,000,000 - $2,499,999 3 1 3 0 1 0 0.0% 0.0% $2,500,000 - $2,999,999 1 1 1 1 1 1 0.0% 0.0% $3,000,000 - $3,999,999 1 1 1 2 0 Not Valid -50.0% 0.0% $4,000,000 and up 0 1 0 0 1 0 0.0% 0.0% MarketTotals 10 13 1 8 7 1 25.0% 85.7% *Supply Demand Ratio Key 1-4: High Demand 5-6: Balanced 7-9: Low Demand 10+: Very Low Demand
PRICE RANGE 01/01/202403/31/2024 01/01/202303/31/2023 % CHANGE 2024/2023 04/01/202303/31/2024 04/01/202203/31/2023 % CHANGE 2024/2023 $0 - $499,999 0 0 Not Valid 0 0 Not Valid $500,000 - $699,999 1 1 0.0% 3 6 -50.0% $700,000 - $999,999 1 2 -50.0% 7 8 -12.5% $1,000,000 - $1,499,999 4 1 300.0% 10 16 -37.5% $1,500,000 - $1,999,999 0 0 Not Valid 13 21 -38.1% $2,000,000 - $2,499,999 2 0 Not Valid 9 6 50.0% $2,500,000 - $2,999,999 0 3 -100.0% 3 12 -75.0% $3,000,000 - $4,999,999 2 0 Not Valid 7 4 75.0% $5,000,000 and up 0 0 Not Valid 1 1 0.0% MarketTotals 10 7 42.9% 53 74 -28.4%
SOLD PROPERTIES YEAR-TO-DATE YEAR-OVER-YEAR
Source: Smart MLS, Rowayton, Single Family Homes, Sold
QUARTERLY MARKET OVERVIEW
TEN-YEAR MARKET HISTORY
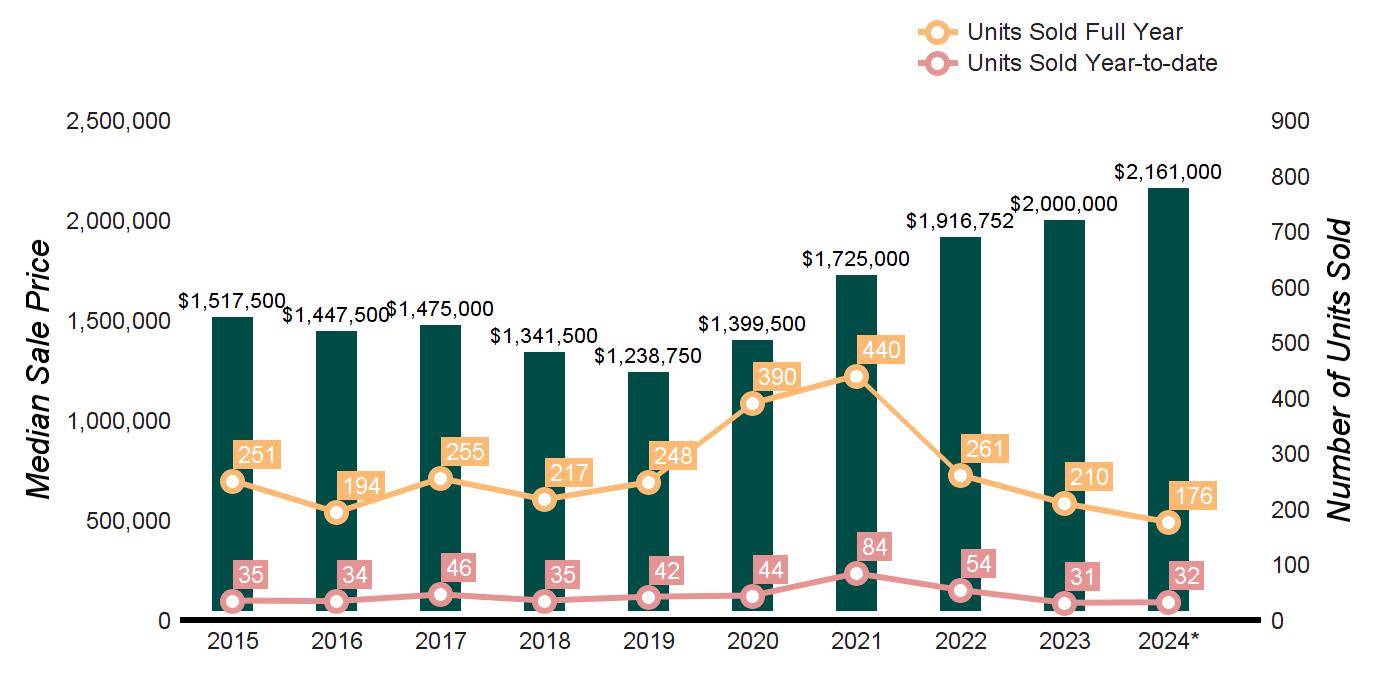
* Homes sold for 2024 are annualized based on actual sales year-to-date.
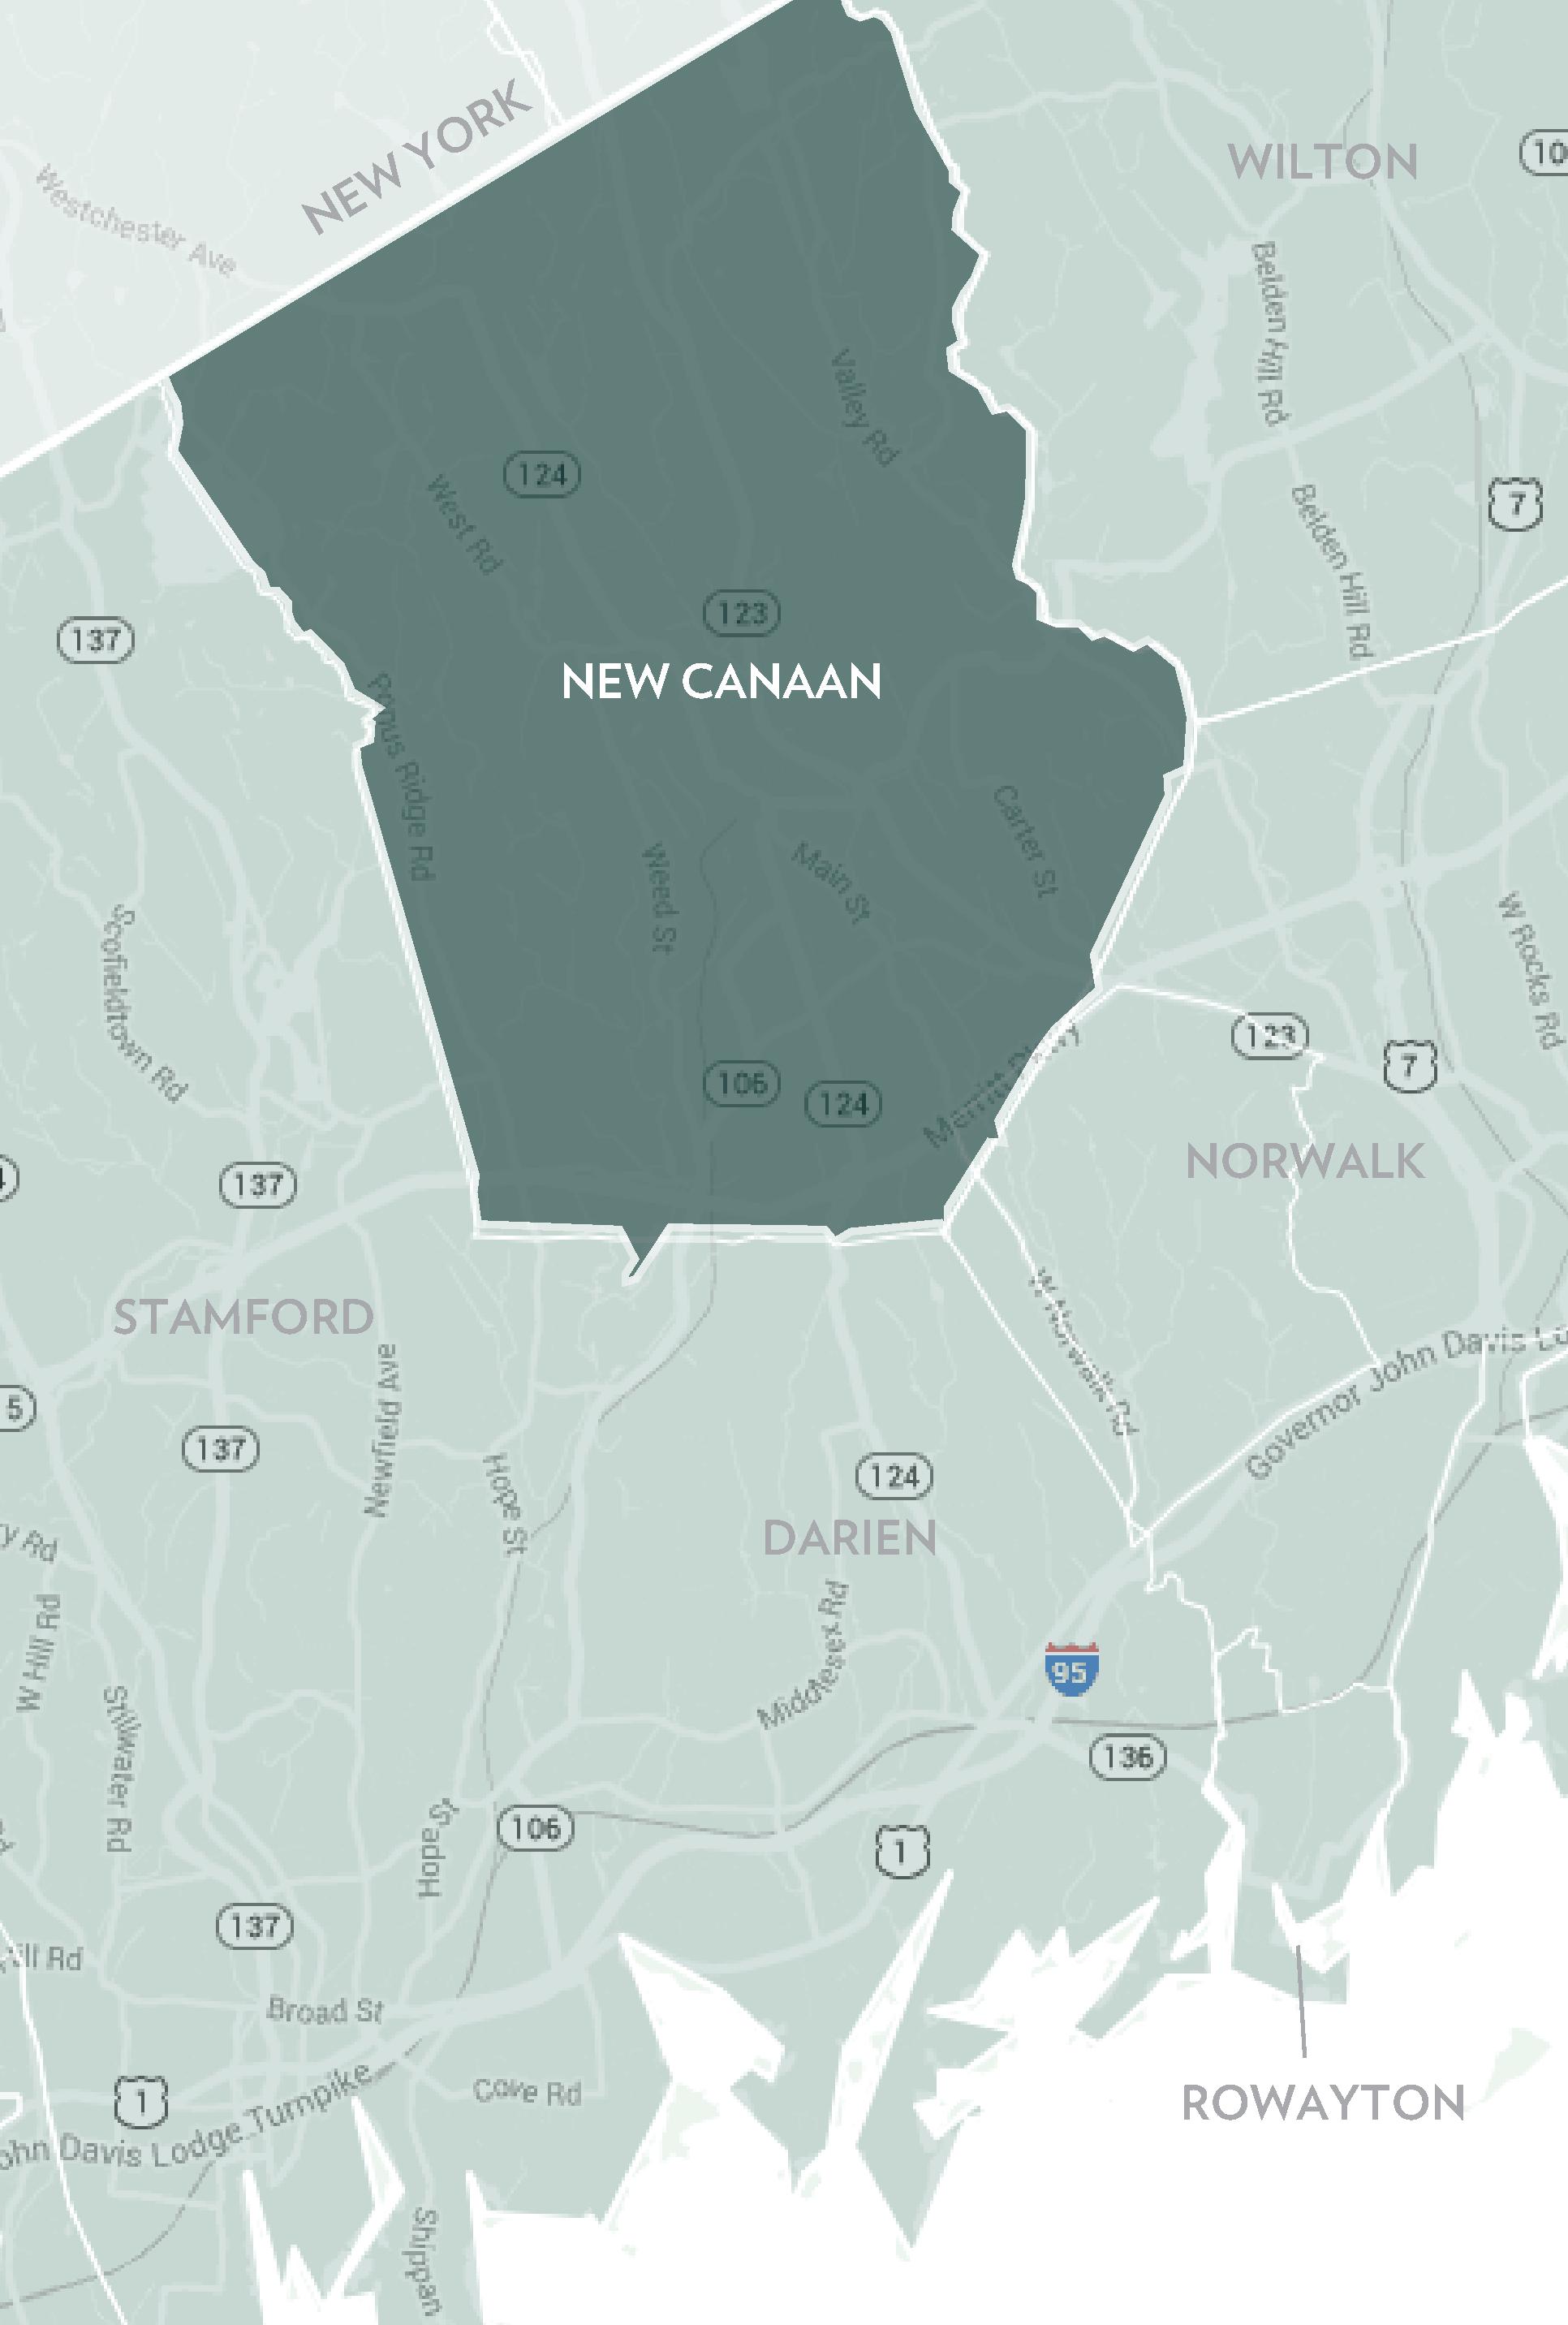
NEW CANAAN
Q1 2024 Q1 2023 % CHANGE FULL YEAR 2023 FULL YEAR 2022 % CHANGE HOMES SOLD 32 31 3.2% 210 261 -19.5% AVERAGE SALE PRICE $2,426,843 $2,082,951 16.5% $2,240,384 $2,177,383 2.9% MEDIAN SALE PRICE $2,161,000 $1,695,000 27.5% $2,000,000 $1,916,752 4.3% AVERAGE PRICE PER SQUARE FOOT $531 $440 20.7% $474 $458 3.5% AVERAGE DAYS ON MARKET 107 73 46.6% 51 55 -7.3% % SALE PRICE TO LIST PRICE 97.0% 98.1% -1.1% 99.6% 100.6% -1.0%
Average Sale Price $1,783,190 $1,770,026 $1,713,201 $1,628,160 $1,424,859 $1,670,517 $1,995,193 $2,177,383 $2,240,384 $2,426,843 Average Sale Price Average Price/SqFt $406 $356 $355 $341 $316 $337 $400 $458 $474 $531 Average Price/SqFt Days On Market 126 148 147 138 164 137 83 55 51 107 Days On Market %Sale Price to List Price 95.8% 93.8% 94.0% 92.2% 92.8% 95.4% 99.1% 100.6% 99.6% 97.0% %Sale Price to List Price
HOULIHANLAWRENCE.COM
SUPPLY/DEMAND ANALYSIS
CANAAN
NEW
AS OF MARCH 31, 2024 AS OF MARCH 31, 2023 2024 vs. 2023 PRICE RANGE SUPPLY: ACTIVE LISTINGS DEMAND: PENDING SALES SUPPLY/ DEMAND RATIO* SUPPLY: ACTIVE LISTINGS DEMAND: PENDING SALES SUPPLY/ DEMAND RATIO* % CHANGE IN LISTINGS % CHANGE IN PENDINGS $0 - $499,999 0 0 Not Valid 0 0 Not Valid 0.0% 0.0% $500,000 - $699,999 0 1 0 1 1 1 -100.0% 0.0% $700,000 - $999,999 0 1 0 3 3 1 -100.0% -66.7% $1,000,000 - $1,499,999 4 9 1 7 4 2 -42.9% 125.0% $1,500,000 - $1,999,999 2 7 1 8 9 1 -75.0% -22.2% $2,000,000 - $2,499,999 4 6 1 4 7 1 0.0% -14.3% $2,500,000 - $2,999,999 3 2 2 9 2 5 -66.7% 0.0% $3,000,000 - $3,999,999 9 6 2 11 5 2 -18.2% 20.0% $4,000,000 and up 20 2 10 21 2 11 -4.8% 0.0% MarketTotals 42 34 1 64 33 2 -34.4% 3.0% *Supply Demand Ratio Key 1-4: High Demand 5-6: Balanced 7-9: Low Demand 10+: Very Low Demand
YEAR-OVER-YEAR PRICE RANGE 01/01/202403/31/2024 01/01/202303/31/2023 % CHANGE 2024/2023 04/01/202303/31/2024 04/01/202203/31/2023 % CHANGE 2024/2023 $0 - $499,999 0 0 Not Valid 0 0 Not Valid $500,000 - $699,999 1 0 Not Valid 1 2 -50.0% $700,000 - $999,999 1 6 -83.3% 12 20 -40.0% $1,000,000 - $1,499,999 6 6 0.0% 36 54 -33.3% $1,500,000 - $1,999,999 4 7 -42.9% 48 46 4.3% $2,000,000 - $2,499,999 6 5 20.0% 41 36 13.9% $2,500,000 - $2,999,999 5 2 150.0% 27 38 -28.9% $3,000,000 - $4,999,999 8 3 166.7% 40 34 17.6% $5,000,000 and up 1 2 -50.0% 6 8 -25.0% MarketTotals 32 31 3.2% 211 238 -11.3%
SOLD PROPERTIES YEAR-TO-DATE
Source: Smart MLS, New Canaan, Single Family Homes, Sold
Leading Real Estate Companies of the World | Luxury Portfolio International Board of Regents Luxury Real Estate
3 GLOBAL NETWORKS - REACHING 56 COUNTRIES & 6 CONTINENTS
