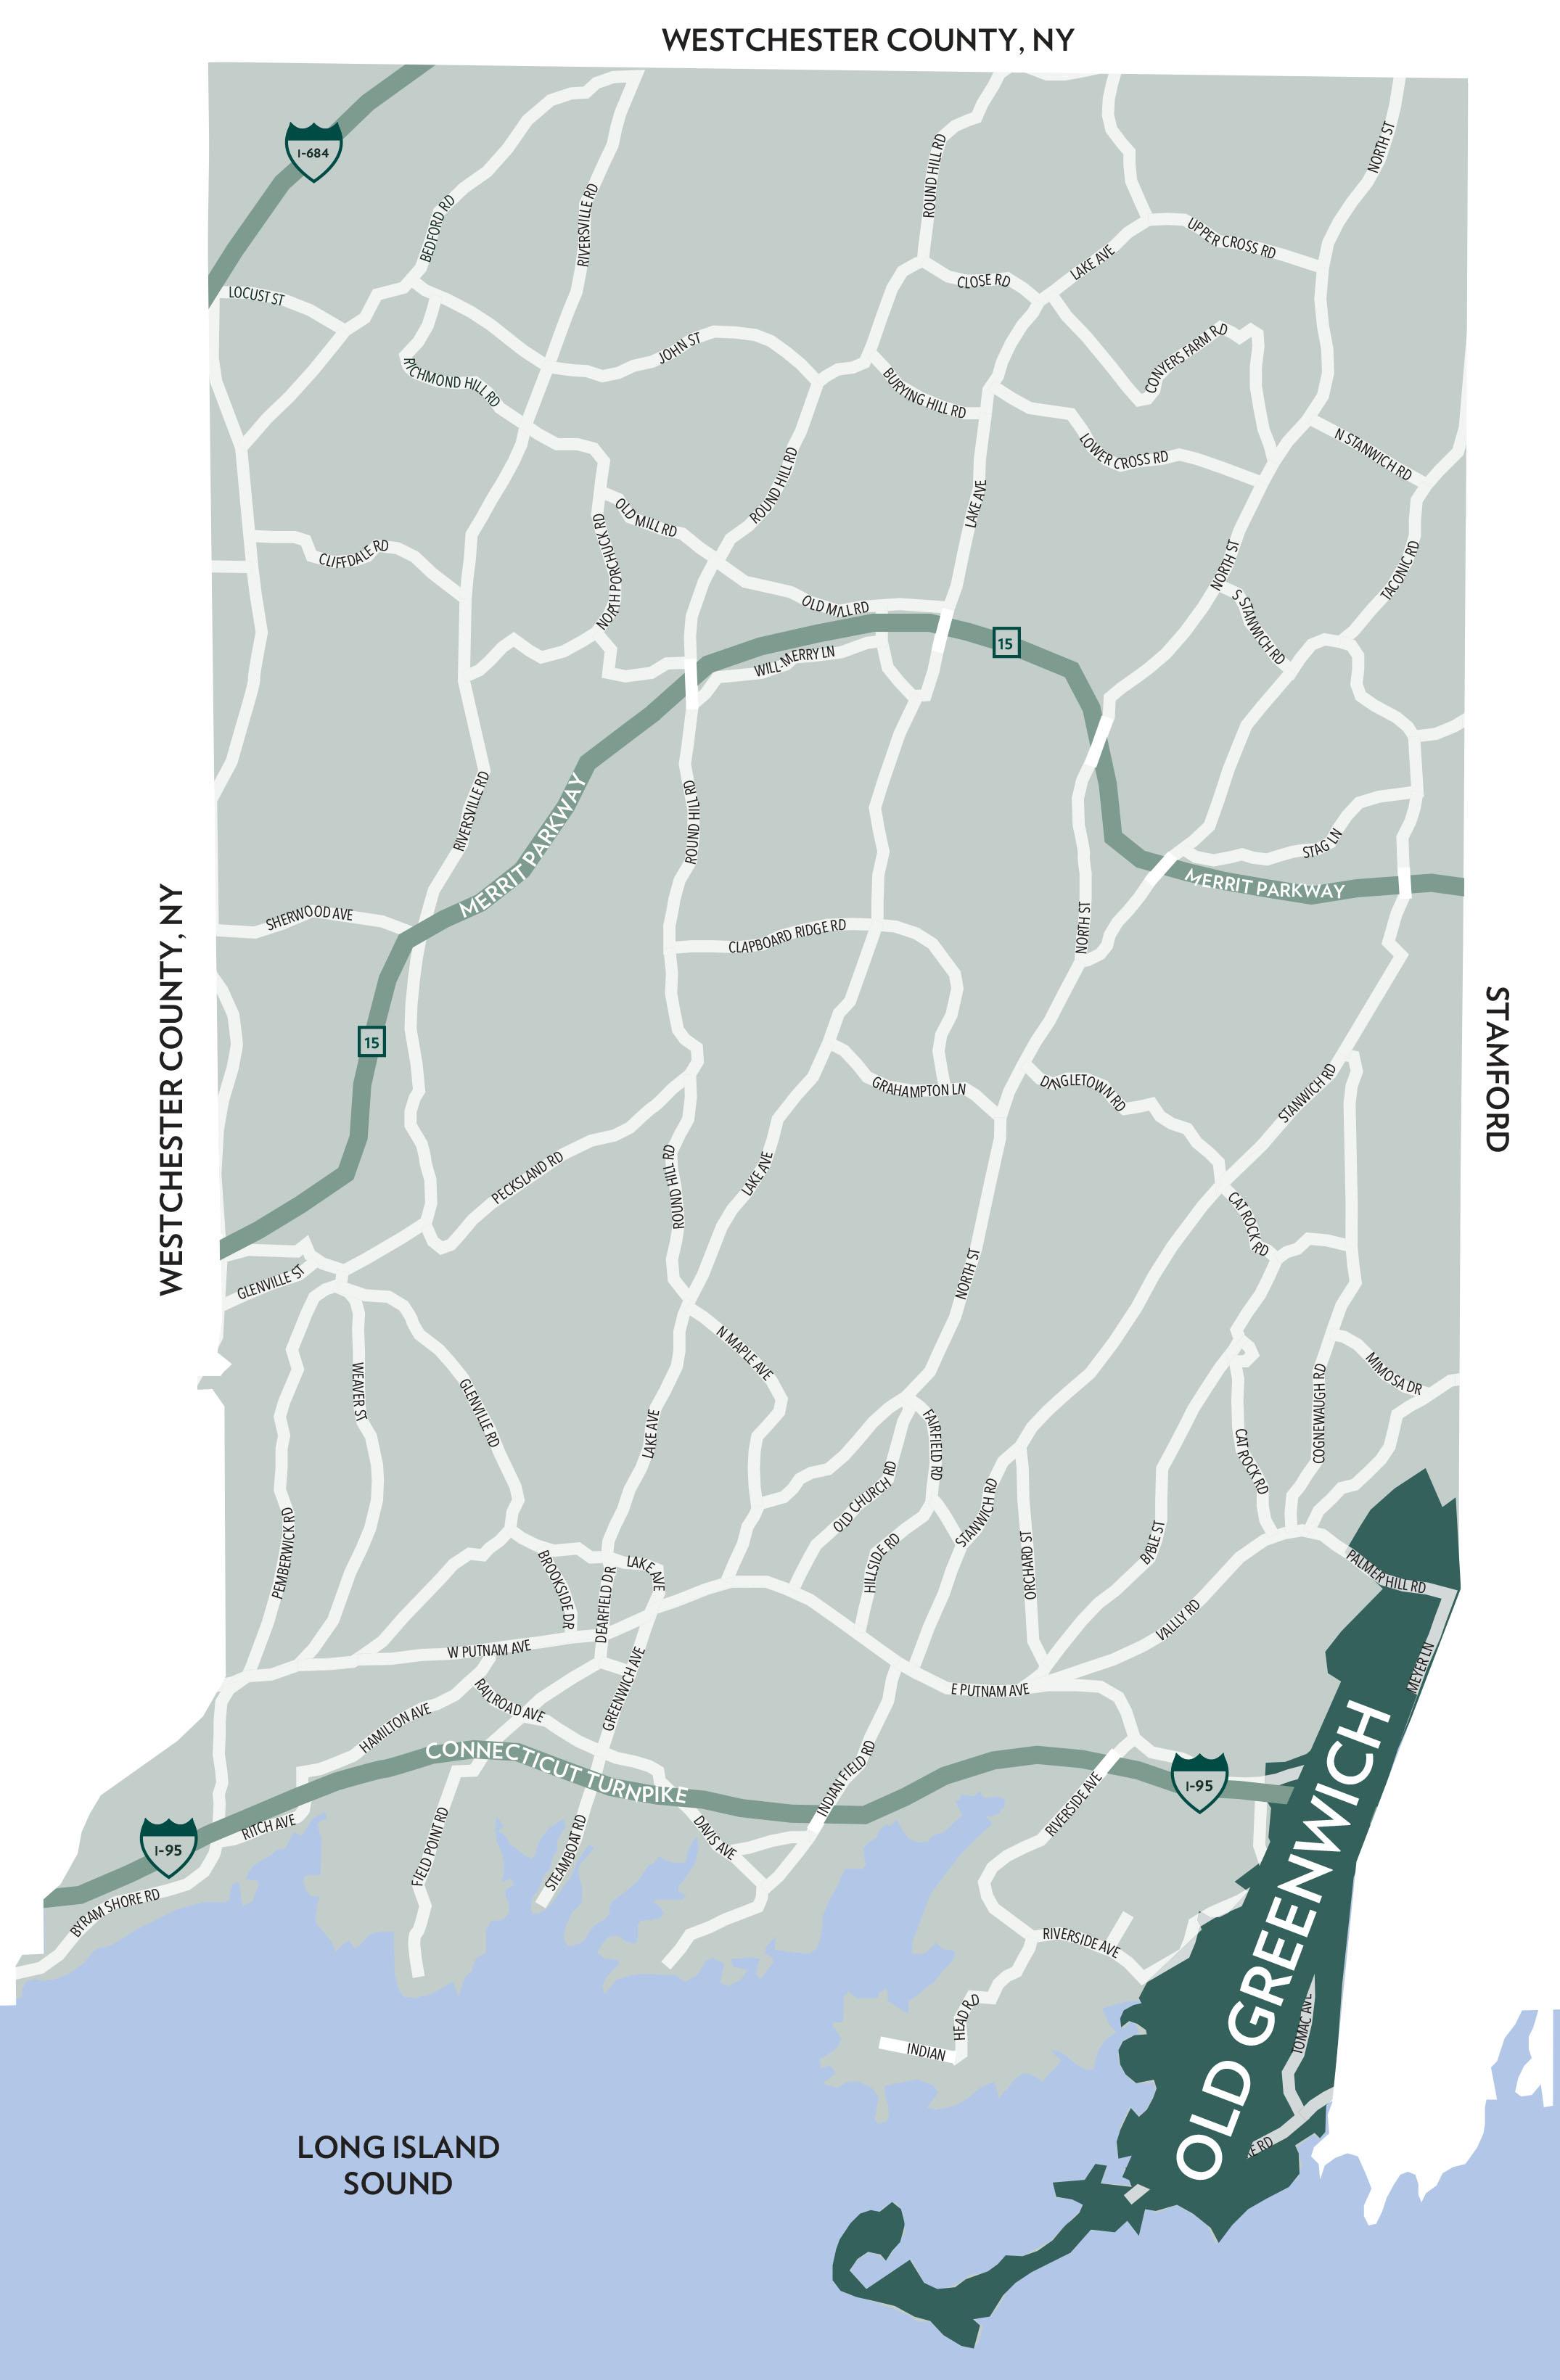
GREATER GREENWICH
SUPPLY DEMAND ANALYSIS
SOLD PROPERTIES
AS OF MARCH 31, 2024 AS OF MARCH 31, 2023 2024 vs. 2023 PRICE RANGE SUPPLY: ACTIVE LISTINGS DEMAND: PENDING SALES SUPPLY/ DEMAND RATIO* SUPPLY: ACTIVE LISTINGS DEMAND: PENDING SALES SUPPLY/ DEMAND RATIO* % CHANGE IN LISTINGS % CHANGE IN PENDINGS $0 - $999,999 3 6 1 8 5 2 -62.5% 20.0% $1,000,000 - $1,999,999 12 27 1 30 18 2 -60.0% 50.0% $2,000,000 - $2,999,999 22 18 1 22 18 1 0.0% 0.0% $3,000,000 - $3,999,999 15 13 1 20 14 1 -25.0% -7.1% $4,000,000 - $4,999,999 8 11 1 21 12 2 -61.9% -8.3% $5,000,000 - $5,999,999 8 2 4 17 4 4 -52.9% -50.0% $6,000,000 - $7,999,999 17 6 3 11 10 1 54.5% -40.0% $8,000,000 - $9,999,999 6 3 2 3 4 1 100.0% -25.0% $10,000,000 and up 27 2 14 22 4 6 22.7% -50.0% MarketTotals 118 88 1 154 89 2 -23.4% -1.1% *Supply Demand Ratio Key 1-4: High Demand 5-6: Balanced 7-9: Low Demand 10+: Very Low Demand
YEAR-TO-DATE YEAR-OVER-YEAR 01/01/202403/31/2024 01/01/202303/31/2023 % CHANGE 2024/2023 04/01/202303/31/2024 04/01/202203/31/2023 % CHANGE 2024/2023 $0 - $999,999 3 10 -70.0% 47 56 -16.1% $1,000,000 - $1,999,999 18 22 -18.2% 137 163 -16.0% $2,000,000 - $2,999,999 16 18 -11.1% 118 140 -15.7% $3,000,000 - $3,999,999 10 9 11.1% 58 69 -15.9% $4,000,000 - $4,999,999 13 9 44.4% 63 54 16.7% $5,000,000 - $5,999,999 5 9 -44.4% 34 45 -24.4% $6,000,000 - $7,999,999 8 3 166.7% 33 34 -2.9% $8,000,000 - $9,999,999 1 3 -66.7% 15 10 50.0% $10,000,000 and up 2 1 100.0% 14 8 75.0% MarketTotals 76 84 -9.5% 519 579 -10.4%
Greenwich Multiple Listing Service, Single-family homes
Source:
NORTH OF THE PARKWAY
QUARTERLY MARKET OVERVIEW

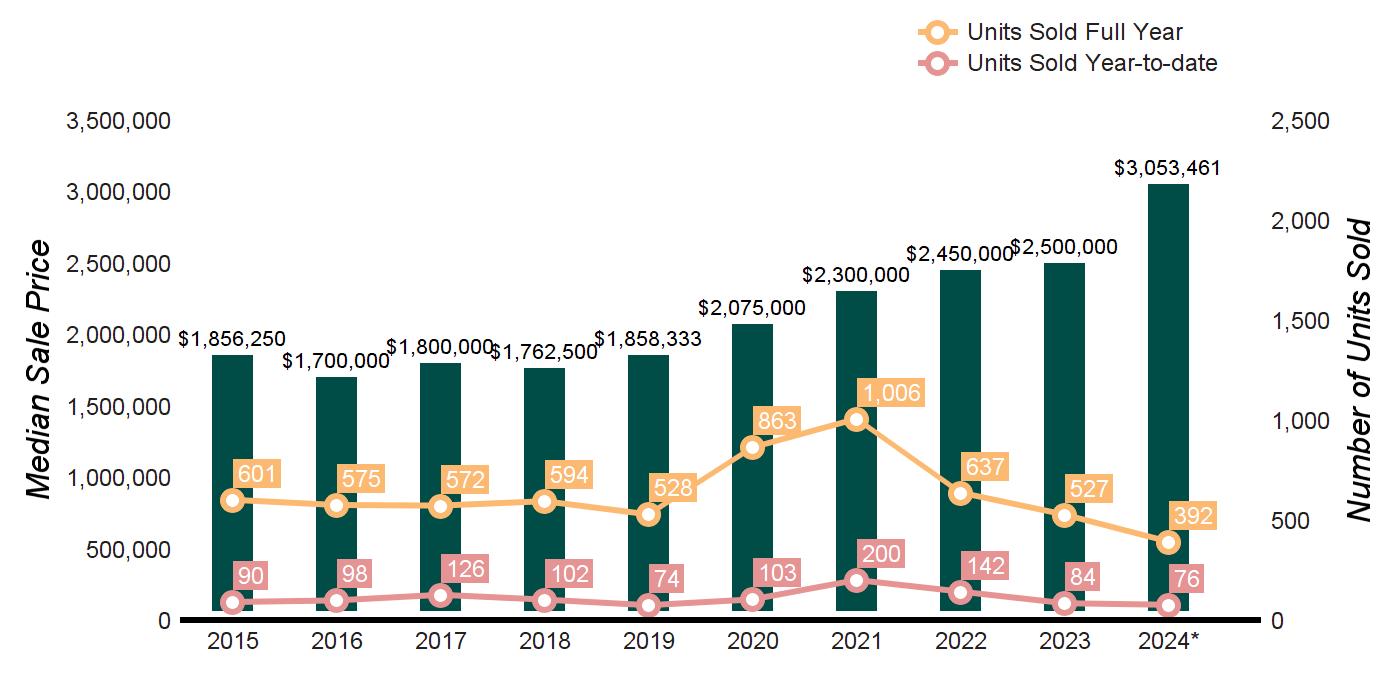
TEN-YEAR MARKET HISTORY
GREENWICH
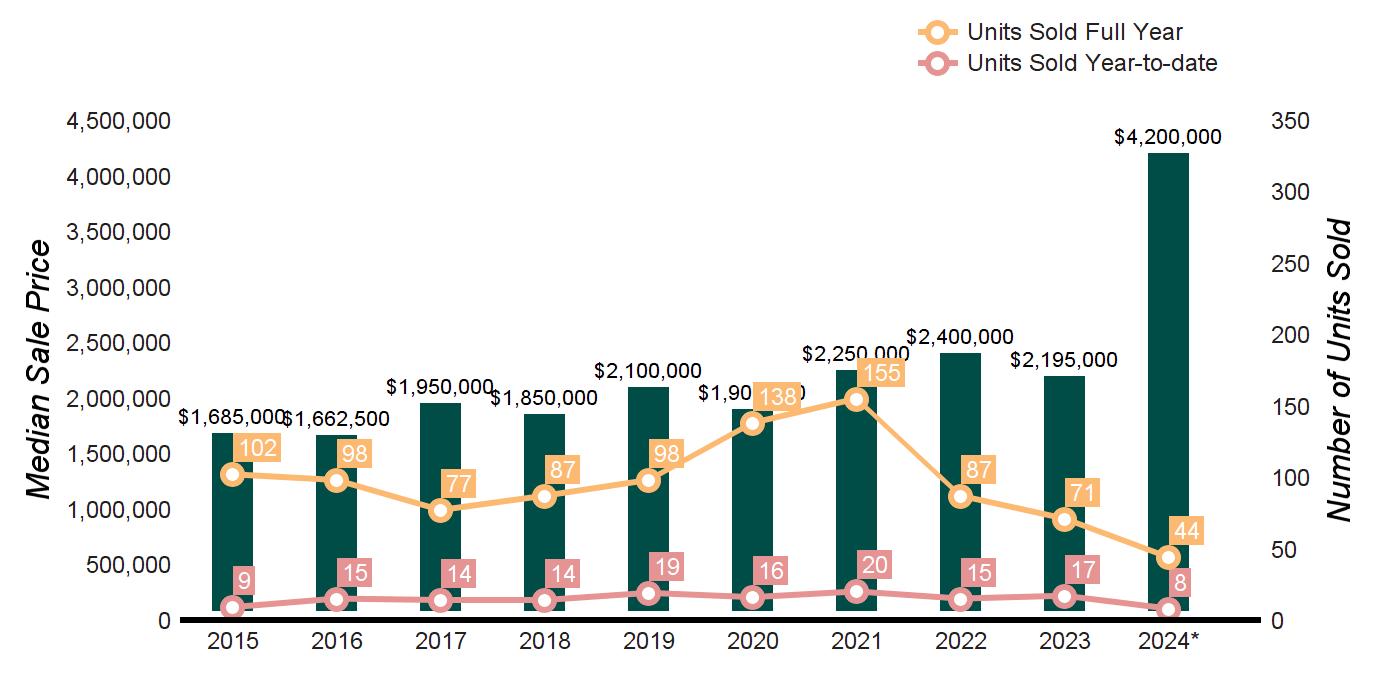
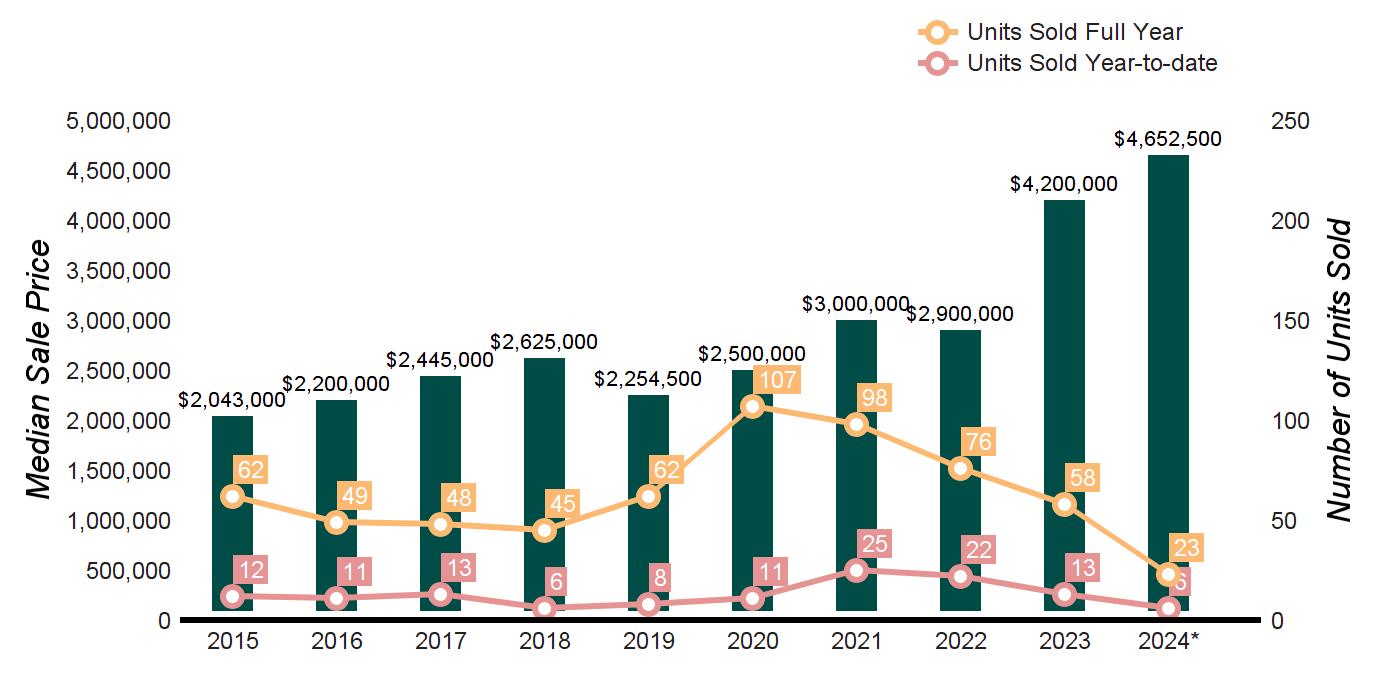
Q1 2024 Q1 2023 % CHANGE FULL YEAR 2023 FULL YEAR 2022 % CHANGE HOMES SOLD 6 13 -53.8% 58 76 -23.7% AVERAGE SALE PRICE $4,200,833 $5,157,280 -18.5% $5,210,226 $3,494,702 49.1% MEDIAN SALE PRICE $4,652,500 $4,700,000 -1.0% $4,200,000 $2,900,000 44.8% AVERAGE PRICE PER SQUARE FOOT $629 $631 -0.3% $662 $596 11.1% AVERAGE DAYS ON MARKET 93 129 -27.9% 166 102 62.7% % SALE PRICE TO LIST PRICE 96.8% 94.8% 2.1% 94.3% 97.3% -3.1%
Average Sale Price $2,834,463 $2,939,222 $3,590,745 $3,264,086 $3,156,247 $2,851,219 $3,919,488 $3,494,702 $5,210,226 $4,200,833 Average Sale Price Average Price/SqFt $524 $470 $501 $495 $503 $455 $553 $596 $662 $629 Average Price/SqFt Days On Market 250 237 310 210 251 231 167 102 166 93 Days On Market %Sale Price to List Price 92.7 91.8 85.7 91.9 90.1 94.2 96.5 97.3 94.3 96.8 %Sale Price to List Price
* Homes sold for 2024 are annualized based on actual sales year-to-date.
NORTH OF THE PARKWAY SUPPLY
GREENWICH
AS OF MARCH 31, 2024 AS OF MARCH 31, 2023 2024 vs. 2023 PRICE RANGE SUPPLY: ACTIVE LISTINGS DEMAND: PENDING SALES SUPPLY/ DEMAND RATIO* SUPPLY: ACTIVE LISTINGS DEMAND: PENDING SALES SUPPLY/ DEMAND RATIO* % CHANGE IN LISTINGS % CHANGE IN PENDINGS $0 - $999,999 0 0 Not Valid 0 0 Not Valid 0.0% 0.0% $1,000,000 - $1,999,999 4 2 2 3 2 2 33.3% 0.0% $2,000,000 - $2,999,999 6 1 6 4 1 4 50.0% 0.0% $3,000,000 - $3,999,999 5 2 3 4 3 1 25.0% -33.3% $4,000,000 - $4,999,999 2 2 1 6 1 6 -66.7% 100.0% $5,000,000 - $5,999,999 3 0 Not Valid 3 0 Not Valid 0.0% 0.0% $6,000,000 - $7,999,999 6 0 Not Valid 1 2 1 500.0% -100.0% $8,000,000 - $9,999,999 2 1 2 1 2 1 100.0% -50.0% $10,000,000 and up 5 0 Not Valid 5 1 5 0.0% -100.0% MarketTotals 33 8 4 27 12 2 22.2% -33.3% *Supply Demand Ratio Key 1-4: High Demand 5-6: Balanced 7-9: Low Demand 10+: Very Low Demand
YEAR-TO-DATE YEAR-OVER-YEAR 01/01/202403/31/2024 01/01/202303/31/2023 % CHANGE 2024/2023 04/01/202303/31/2024 04/01/202203/31/2023 % CHANGE 2024/2023 $0 - $999,999 0 0 Not Valid 1 1 0.0% $1,000,000 - $1,999,999 1 2 -50.0% 8 13 -38.5% $2,000,000 - $2,999,999 1 1 0.0% 10 18 -44.4% $3,000,000 - $3,999,999 1 1 0.0% 7 11 -36.4% $4,000,000 - $4,999,999 0 3 -100.0% 6 6 0.0% $5,000,000 - $5,999,999 2 2 0.0% 6 6 0.0% $6,000,000 - $7,999,999 1 1 0.0% 5 7 -28.6% $8,000,000 - $9,999,999 0 3 -100.0% 3 4 -25.0% $10,000,000 and up 0 0 Not Valid 5 1 400.0% MarketTotals 6 13 -53.8% 51 67 -23.9%
Greenwich Multiple Listing Service, Single-family homes
DEMAND ANALYSIS
SOLD PROPERTIES
Source:
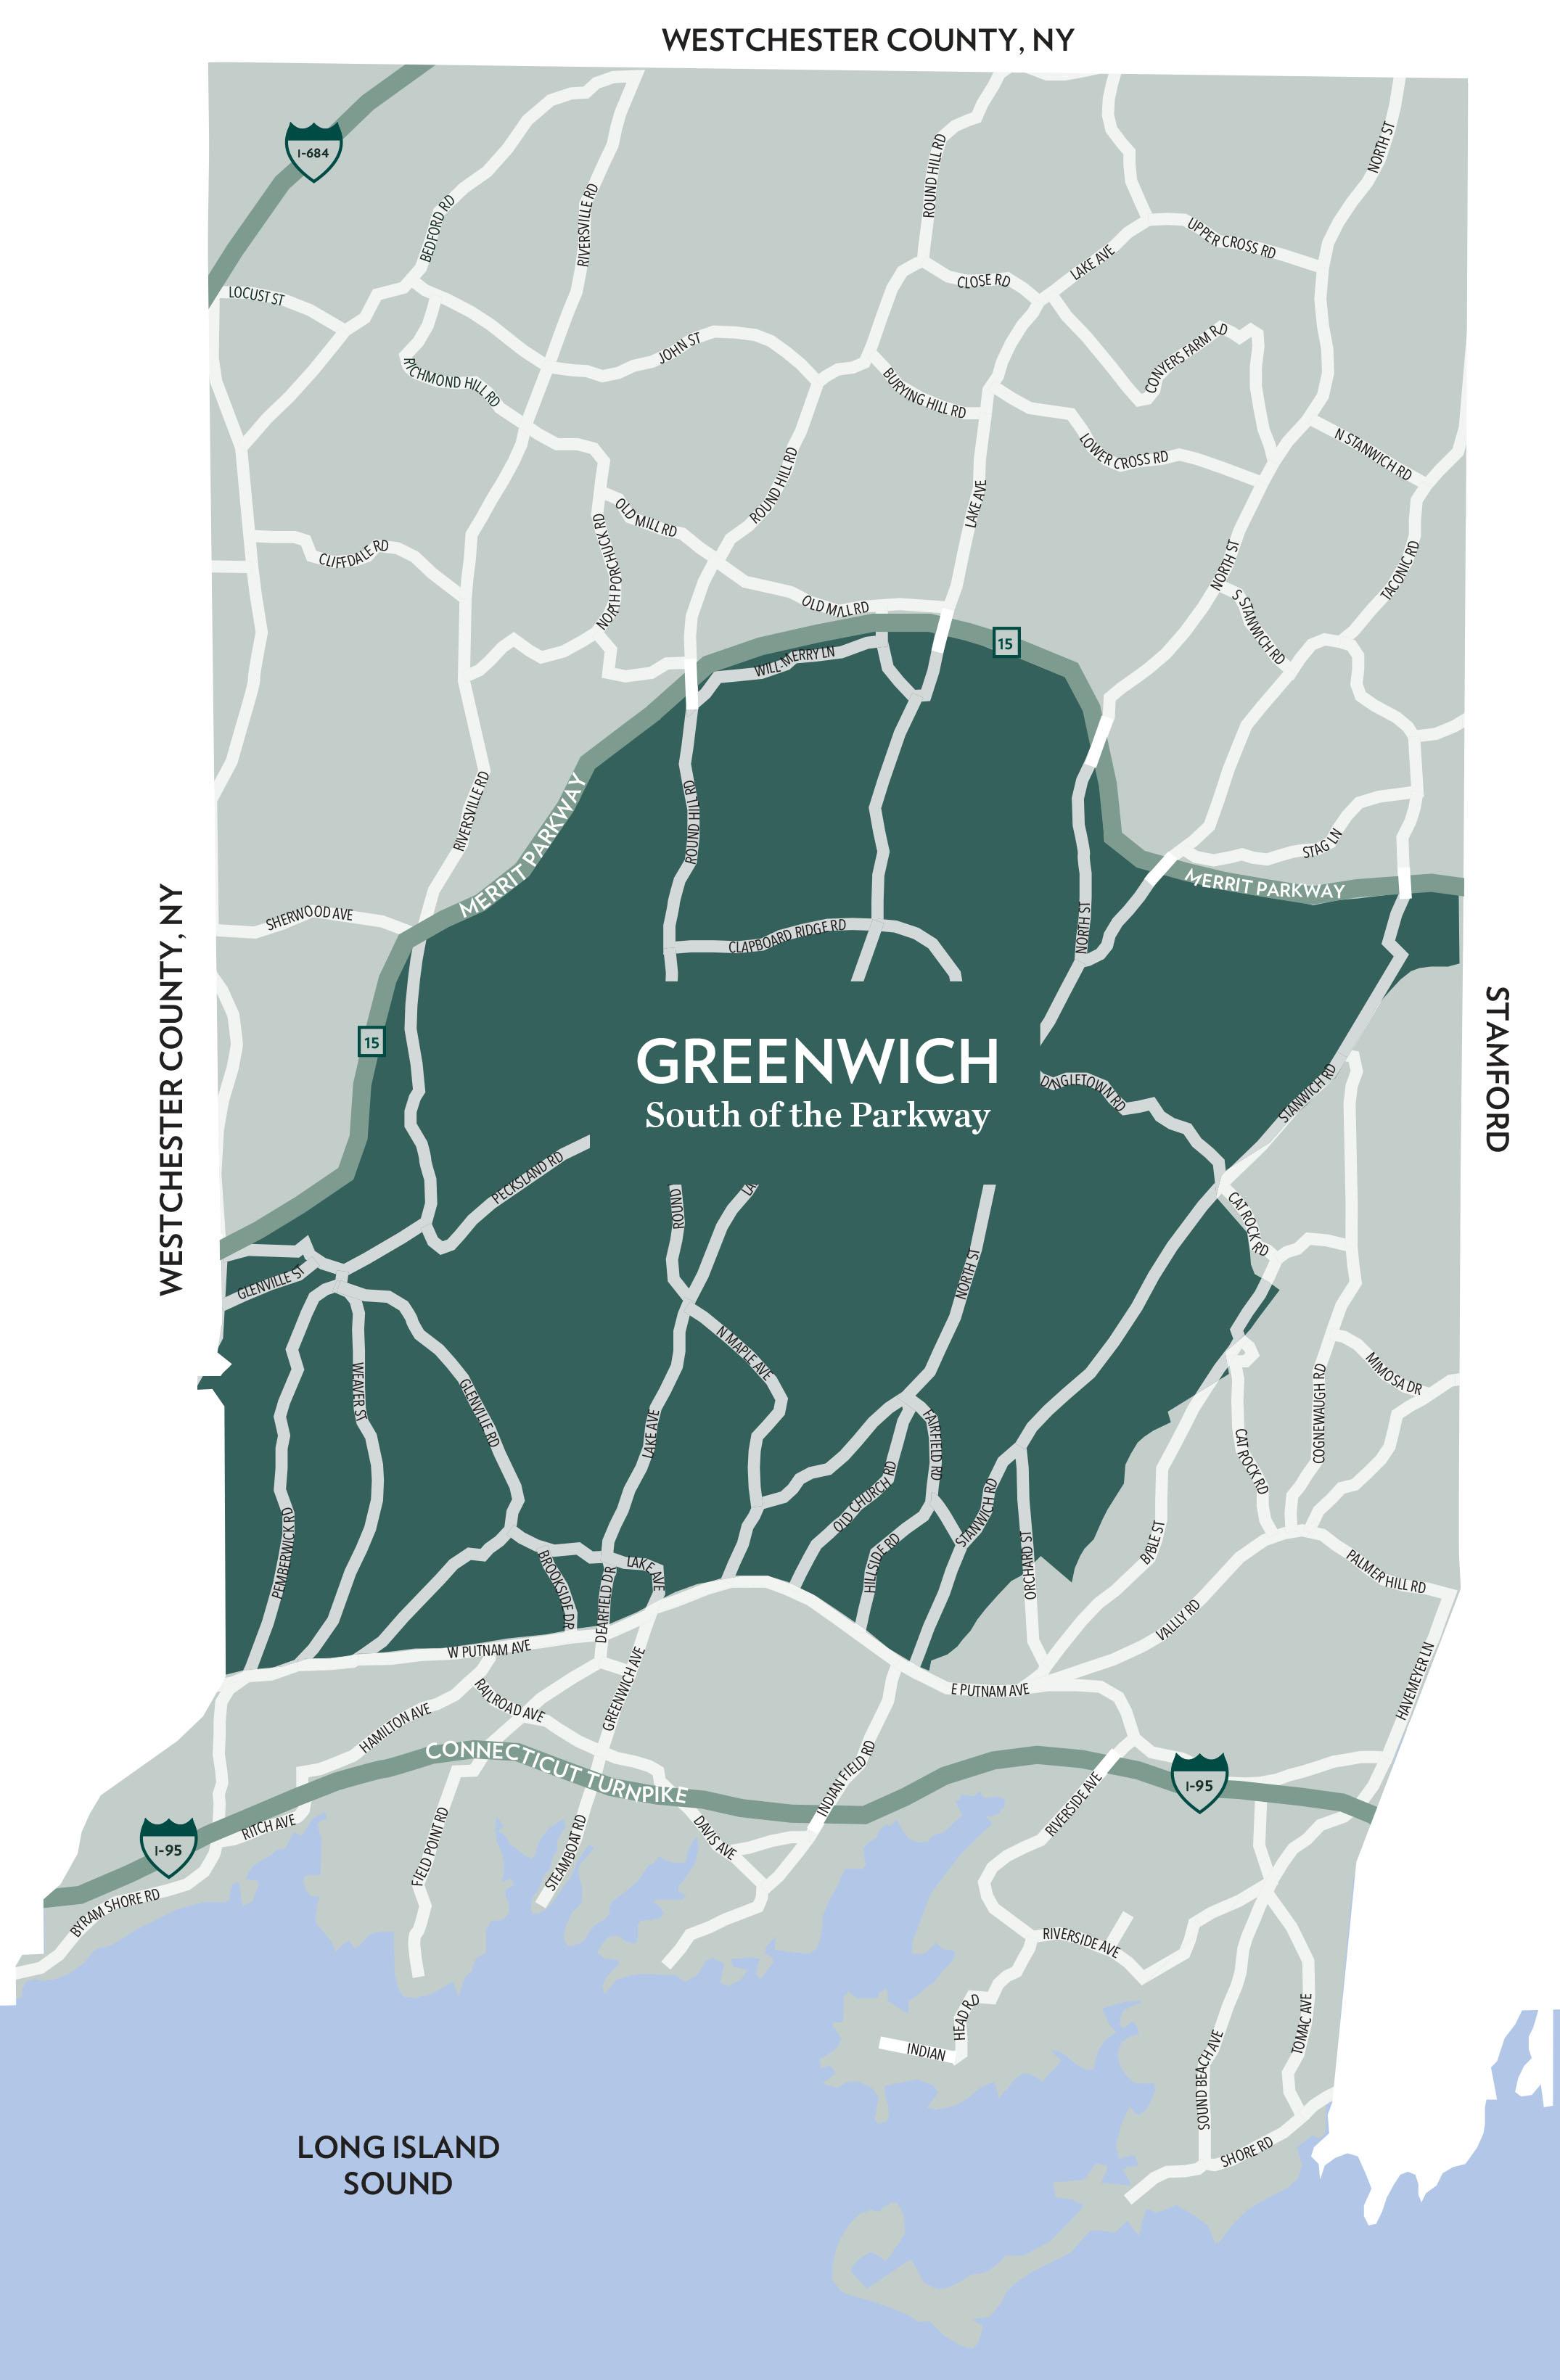
SOUTH OF THE PARKWAY
QUARTERLY MARKET OVERVIEW
TEN-YEAR MARKET HISTORY

GREENWICH
Q1 2024 Q1 2023 % CHANGE FULL YEAR 2023 FULL YEAR 2022 % CHANGE HOMES SOLD 29 30 -3.3% 203 226 -10.2% AVERAGE SALE PRICE $4,589,859 $3,429,940 33.8% $3,647,901 $3,634,903 0.4% MEDIAN SALE PRICE $4,125,000 $3,075,000 34.1% $3,250,000 $3,007,500 8.1% AVERAGE PRICE PER SQUARE FOOT $774 $618 25.2% $693 $674 2.8% AVERAGE DAYS ON MARKET 107 72 48.6% 85 94 -9.6% % SALE PRICE TO LIST PRICE 97.6% 96.7% 0.9% 98.7% 98.9% -0.2%
Average Sale Price $3,075,190 $2,403,016 $2,769,791 $2,670,378 $2,537,605 $2,941,272 $3,212,533 $3,634,903 $3,647,901 $4,589,859 Average Sale Price Average Price/SqFt $587 $535 $550 $537 $499 $530 $596 $674 $693 $774 Average Price/SqFt Days On Market 167 176 203 188 234 197 126 94 85 107 Days On Market %Sale Price to List Price 93.7 94.0 93.0 92.8 91.9 94.9 97.0 98.9 98.7 97.6 %Sale Price to List Price
* Homes sold for 2024 are annualized based on actual sales year-to-date.
SOUTH OF THE PARKWAY
ANALYSIS
GREENWICH
DEMAND
AS OF MARCH 31, 2024 AS OF MARCH 31, 2023 2024 vs. 2023 PRICE RANGE SUPPLY: ACTIVE LISTINGS DEMAND: PENDING SALES SUPPLY/ DEMAND RATIO* SUPPLY: ACTIVE LISTINGS DEMAND: PENDING SALES SUPPLY/ DEMAND RATIO* % CHANGE IN LISTINGS % CHANGE IN PENDINGS $0 - $999,999 1 2 1 2 2 1 -50.0% 0.0% $1,000,000 - $1,999,999 2 3 1 10 3 3 -80.0% 0.0% $2,000,000 - $2,999,999 6 8 1 5 6 1 20.0% 33.3% $3,000,000 - $3,999,999 2 5 1 11 4 3 -81.8% 25.0% $4,000,000 - $4,999,999 1 7 1 10 7 1 -90.0% 0.0% $5,000,000 - $5,999,999 3 1 3 10 4 3 -70.0% -75.0% $6,000,000 - $7,999,999 8 5 2 6 8 1 33.3% -37.5% $8,000,000 - $9,999,999 3 2 2 2 2 1 50.0% 0.0% $10,000,000 and up 13 2 7 8 3 3 62.5% -33.3% MarketTotals 39 35 1 64 39 2 -39.1% -10.3% *Supply Demand Ratio Key 1-4: High Demand 5-6: Balanced 7-9: Low Demand 10+: Very Low Demand
YEAR-TO-DATE YEAR-OVER-YEAR 01/01/202403/31/2024 01/01/202303/31/2023 % CHANGE 2024/2023 04/01/202303/31/2024 04/01/202203/31/2023 % CHANGE 2024/2023 $0 - $999,999 1 4 -75.0% 16 22 -27.3% $1,000,000 - $1,999,999 3 5 -40.0% 40 35 14.3% $2,000,000 - $2,999,999 4 6 -33.3% 34 40 -15.0% $3,000,000 - $3,999,999 4 5 -20.0% 25 30 -16.7% $4,000,000 - $4,999,999 7 4 75.0% 33 25 32.0% $5,000,000 - $5,999,999 3 4 -25.0% 20 21 -4.8% $6,000,000 - $7,999,999 6 1 500.0% 22 17 29.4% $8,000,000 - $9,999,999 0 0 Not Valid 9 4 125.0% $10,000,000 and up 1 1 0.0% 3 6 -50.0% MarketTotals 29 30 -3.3% 202 200 1.0%
Greenwich Multiple Listing Service, Single-family homes
SUPPLY
SOLD PROPERTIES
Source:
SOUTH OF THE POST ROAD
QUARTERLY MARKET OVERVIEW

TEN-YEAR MARKET HISTORY
GREENWICH
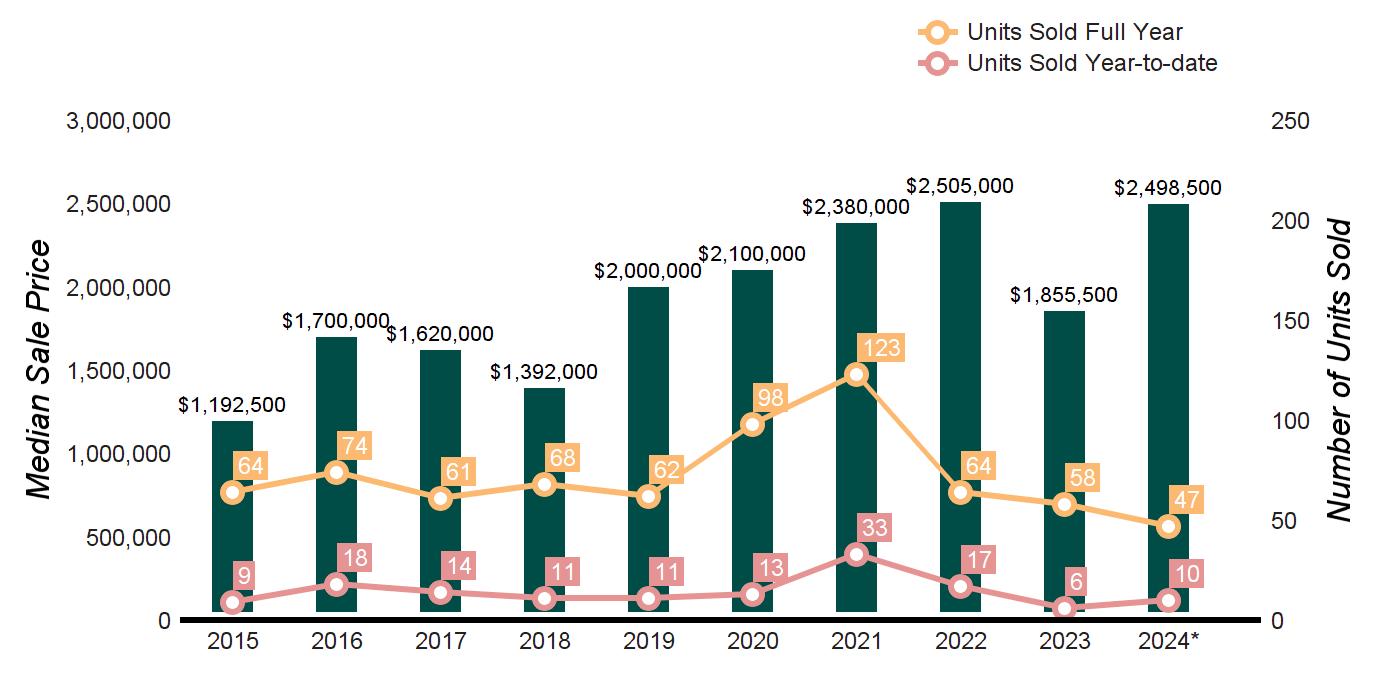
Q1 2024 Q1 2023 % CHANGE FULL YEAR 2023 FULL YEAR 2022 % CHANGE HOMES SOLD 10 6 66.7% 58 64 -9.4% AVERAGE SALE PRICE $3,696,900 $3,287,333 12.5% $5,494,005 $3,288,974 67.0% MEDIAN SALE PRICE $2,498,500 $3,350,000 -25.4% $1,855,500 $2,505,000 -25.9% AVERAGE PRICE PER SQUARE FOOT $942 $929 1.4% $1,096 $752 45.7% AVERAGE DAYS ON MARKET 110 146 -24.7% 85 85 0.0% % SALE PRICE TO LIST PRICE 103.1% 97.4% 5.9% 93.6% 99.6% -6.0%
Average Sale Price $2,043,325 $2,545,622 $2,977,955 $2,371,594 $2,896,440 $3,458,830 $3,907,564 $3,288,974 $5,494,005 $3,696,900 Average Sale Price Average Price/SqFt $598 $623 $639 $666 $667 $676 $709 $752 $1,096 $942 Average Price/SqFt Days On Market 172 133 141 208 211 182 138 85 85 110 Days On Market %Sale Price to List Price 96.2 92.3 91.5 94.5 92.6 91.1 95.5 99.6 93.6 103.1 %Sale Price to List Price
2024
on
* Homes sold for
are annualized based
actual sales year-to-date.
SOUTH OF THE POST ROAD SUPPLY
SOLD PROPERTIES
GREENWICH
AS OF MARCH 31, 2024 AS OF MARCH 31, 2023 2024 vs. 2023 PRICE RANGE SUPPLY: ACTIVE LISTINGS DEMAND: PENDING SALES SUPPLY/ DEMAND RATIO* SUPPLY: ACTIVE LISTINGS DEMAND: PENDING SALES SUPPLY/ DEMAND RATIO* % CHANGE IN LISTINGS % CHANGE IN PENDINGS $0 - $999,999 2 3 1 4 2 2 -50.0% 50.0% $1,000,000 - $1,999,999 0 2 0 3 0 Not Valid -100.0% 0.0% $2,000,000 - $2,999,999 1 2 1 5 1 5 -80.0% 100.0% $3,000,000 - $3,999,999 2 2 1 3 1 3 -33.3% 100.0% $4,000,000 - $4,999,999 1 1 1 2 0 Not Valid -50.0% 0.0% $5,000,000 - $5,999,999 0 0 Not Valid 0 0 Not Valid 0.0% 0.0% $6,000,000 - $7,999,999 3 1 3 4 0 Not Valid -25.0% 0.0% $8,000,000 - $9,999,999 1 0 Not Valid 0 0 Not Valid 0.0% 0.0% $10,000,000 and up 6 0 Not Valid 6 0 Not Valid 0.0% 0.0% MarketTotals 16 11 1 27 4 7 -40.7% 175.0% *Supply Demand Ratio Key 1-4: High Demand 5-6: Balanced 7-9: Low Demand 10+: Very Low Demand
DEMAND ANALYSIS
YEAR-TO-DATE YEAR-OVER-YEAR 01/01/202403/31/2024 01/01/202303/31/2023 % CHANGE 2024/2023 04/01/202303/31/2024 04/01/202203/31/2023 % CHANGE 2024/2023 $0 - $999,999 2 1 100.0% 18 9 100.0% $1,000,000 - $1,999,999 1 0 Not Valid 15 12 25.0% $2,000,000 - $2,999,999 4 2 100.0% 9 9 0.0% $3,000,000 - $3,999,999 1 0 Not Valid 4 1 300.0% $4,000,000 - $4,999,999 1 2 -50.0% 5 6 -16.7% $5,000,000 - $5,999,999 0 1 -100.0% 2 11 -81.8% $6,000,000 - $7,999,999 0 0 Not Valid 3 4 -25.0% $8,000,000 - $9,999,999 0 0 Not Valid 2 1 100.0% $10,000,000 and up 1 0 Not Valid 4 0 Not Valid MarketTotals 10 6 66.7% 62 53 17.0%
Greenwich Multiple Listing Service, Single-family homes
Source:
QUARTERLY MARKET OVERVIEW

TEN-YEAR
MARKET HISTORY

COS COB
Q1 2024 Q1 2023 % CHANGE FULL YEAR 2023 FULL YEAR 2022 % CHANGE HOMES SOLD 16 10 60.0% 65 77 -15.6% AVERAGE SALE PRICE $1,711,351 $1,393,680 22.8% $1,793,257 $1,815,667 -1.2% MEDIAN SALE PRICE $1,595,365 $1,310,000 21.8% $1,700,000 $1,650,000 3.0% AVERAGE PRICE PER SQUARE FOOT $629 $519 21.2% $602 $583 3.3% AVERAGE DAYS ON MARKET 67 97 -30.9% 69 51 35.3% % SALE PRICE TO LIST PRICE 104.8% 97.2% 7.8% 102.2% 101.0% 1.2%
Average Sale Price $1,365,294 $1,321,116 $1,331,751 $1,564,416 $1,248,246 $1,408,910 $1,645,808 $1,815,667 $1,793,257 $1,711,351 Average Sale Price Average Price/SqFt $506 $490 $456 $486 $436 $444 $532 $583 $602 $629 Average Price/SqFt Days On Market 137 139 142 153 141 157 100 51 69 67 Days On Market %Sale Price to List Price 96.2 96.0 95.0 95.4 94.4 96.1 98.1 101.0 102.2 104.8 %Sale Price to List Price
* Homes sold for 2024 are annualized based on actual sales year-to-date.
SOLD PROPERTIES
AS OF MARCH 31, 2024 AS OF MARCH 31, 2023 2024 vs. 2023 PRICE RANGE SUPPLY: ACTIVE LISTINGS DEMAND: PENDING SALES SUPPLY/ DEMAND RATIO* SUPPLY: ACTIVE LISTINGS DEMAND: PENDING SALES SUPPLY/ DEMAND RATIO* % CHANGE IN LISTINGS % CHANGE IN PENDINGS $0 - $999,999 0 0 Not Valid 1 1 1 -100.0% -100.0% $1,000,000 - $1,999,999 0 9 0 7 5 1 -100.0% 80.0% $2,000,000 - $2,999,999 0 4 0 2 1 2 -100.0% 300.0% $3,000,000 - $3,999,999 0 1 0 1 0 Not Valid -100.0% 0.0% $4,000,000 - $4,999,999 1 0 Not Valid 0 1 0 0.0% -100.0% $5,000,000 - $5,999,999 0 0 Not Valid 0 0 Not Valid 0.0% 0.0% $6,000,000 - $7,999,999 0 0 Not Valid 0 0 Not Valid 0.0% 0.0% $8,000,000 - $9,999,999 0 0 Not Valid 0 0 Not Valid 0.0% 0.0% $10,000,000 and up 0 0 Not Valid 0 0 Not Valid 0.0% 0.0% MarketTotals 1 14 1 11 8 1 -90.9% 75.0% *Supply Demand Ratio Key 1-4: High Demand 5-6: Balanced 7-9: Low Demand 10+: Very Low Demand
COS COB SUPPLY DEMAND ANALYSIS
YEAR-TO-DATE YEAR-OVER-YEAR 01/01/202403/31/2024 01/01/202303/31/2023 % CHANGE 2024/2023 04/01/202303/31/2024 04/01/202203/31/2023 % CHANGE 2024/2023 $0 - $999,999 0 3 -100.0% 5 11 -54.5% $1,000,000 - $1,999,999 12 6 100.0% 43 37 16.2% $2,000,000 - $2,999,999 3 1 200.0% 19 16 18.8% $3,000,000 - $3,999,999 1 0 Not Valid 2 4 -50.0% $4,000,000 - $4,999,999 0 0 Not Valid 2 2 0.0% $5,000,000 - $5,999,999 0 0 Not Valid 0 0 Not Valid $6,000,000 - $7,999,999 0 0 Not Valid 0 0 Not Valid $8,000,000 - $9,999,999 0 0 Not Valid 0 0 Not Valid $10,000,000 and up 0 0 Not Valid 0 0 Not Valid MarketTotals 16 10 60.0% 71 70 1.4%
Source: Greenwich Multiple Listing Service, Single-family homes
QUARTERLY MARKET OVERVIEW

TEN-YEAR MARKET HISTORY
* Homes sold for 2024 are annualized based on actual sales year-to-date.
RIVERSIDE
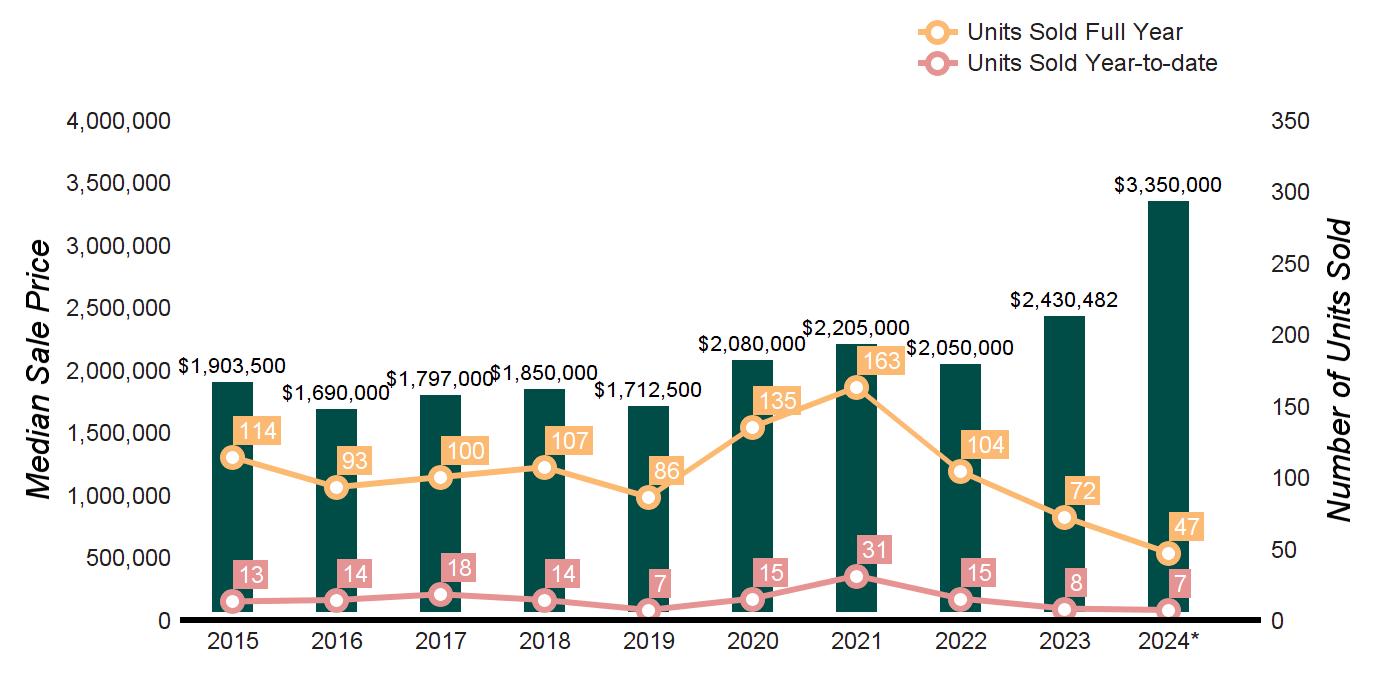
Q1 2024 Q1 2023 % CHANGE FULL YEAR 2023 FULL YEAR 2022 % CHANGE HOMES SOLD 7 8 -12.5% 72 104 -30.8% AVERAGE SALE PRICE $3,368,431 $3,450,407 -2.4% $2,968,875 $2,507,628 18.4% MEDIAN SALE PRICE $3,350,000 $2,857,750 17.2% $2,430,482 $2,050,000 18.6% AVERAGE PRICE PER SQUARE FOOT $1,006 $844 19.2% $807 $757 6.6% AVERAGE DAYS ON MARKET 30 47 -36.2% 47 54 -13.0% % SALE PRICE TO LIST PRICE 103.1% 103.6% -0.5% 101.2% 102.0% -0.8%
Average Sale Price $2,275,811 $2,121,616 $2,371,435 $2,353,592 $1,945,173 $2,587,852 $2,614,485 $2,507,628 $2,968,875 $3,368,431 Average Sale Price Average Price/SqFt $634 $601 $619 $595 $542 $618 $678 $757 $807 $1,006 Average Price/SqFt Days On Market 122 138 147 168 180 125 75 54 47 30 Days On Market %Sale Price to List Price 94.6 93.9 94.7 94.9 94.1 94.3 99.7 102.0 101.2 103.1 %Sale Price to List Price
SOLD PROPERTIES
SUPPLY DEMAND
AS OF MARCH 31, 2024 AS OF MARCH 31, 2023 2024 vs. 2023 PRICE RANGE SUPPLY: ACTIVE LISTINGS DEMAND: PENDING SALES SUPPLY/ DEMAND RATIO* SUPPLY: ACTIVE LISTINGS DEMAND: PENDING SALES SUPPLY/ DEMAND RATIO* % CHANGE IN LISTINGS % CHANGE IN PENDINGS $0 - $999,999 0 1 0 1 0 Not Valid -100.0% 0.0% $1,000,000 - $1,999,999 2 3 1 1 3 1 100.0% 0.0% $2,000,000 - $2,999,999 6 2 3 4 5 1 50.0% -60.0% $3,000,000 - $3,999,999 3 3 1 1 5 1 200.0% -40.0% $4,000,000 - $4,999,999 1 1 1 2 2 1 -50.0% -50.0% $5,000,000 - $5,999,999 1 0 Not Valid 2 0 Not Valid -50.0% 0.0% $6,000,000 - $7,999,999 0 0 Not Valid 0 0 Not Valid 0.0% 0.0% $8,000,000 - $9,999,999 0 0 Not Valid 0 0 Not Valid 0.0% 0.0% $10,000,000 and up 2 0 Not Valid 2 0 Not Valid 0.0% 0.0% MarketTotals 15 10 2 13 15 1 15.4% -33.3% *Supply Demand Ratio Key 1-4: High Demand 5-6: Balanced 7-9: Low Demand 10+: Very Low Demand
RIVERSIDE
ANALYSIS
YEAR-TO-DATE YEAR-OVER-YEAR 01/01/202403/31/2024 01/01/202303/31/2023 % CHANGE 2024/2023 04/01/202303/31/2024 04/01/202203/31/2023 % CHANGE 2024/2023 $0 - $999,999 0 0 Not Valid 3 8 -62.5% $1,000,000 - $1,999,999 1 2 -50.0% 16 33 -51.5% $2,000,000 - $2,999,999 2 2 0.0% 27 26 3.8% $3,000,000 - $3,999,999 2 1 100.0% 11 12 -8.3% $4,000,000 - $4,999,999 2 0 Not Valid 9 10 -10.0% $5,000,000 - $5,999,999 0 2 -100.0% 3 4 -25.0% $6,000,000 - $7,999,999 0 1 -100.0% 0 3 -100.0% $8,000,000 - $9,999,999 0 0 Not Valid 0 1 -100.0% $10,000,000 and up 0 0 Not Valid 2 0 Not Valid MarketTotals 7 8 -12.5% 71 97 -26.8%
Greenwich Multiple Listing Service, Single-family homes
Source:
QUARTERLY MARKET OVERVIEW
GREATER GREENWICH CONDOMINIUMS
SUPPLY DEMAND ANALYSIS
SOLD PROPERTIES
AS OF MARCH 31, 2024 AS OF MARCH 31, 2023 2024 vs. 2023 PRICE RANGE SUPPLY: ACTIVE LISTINGS DEMAND: PENDING SALES SUPPLY/ DEMAND RATIO* SUPPLY: ACTIVE LISTINGS DEMAND: PENDING SALES SUPPLY/ DEMAND RATIO* % CHANGE IN LISTINGS % CHANGE IN PENDINGS $0 - $999,999 6 12 1 15 9 2 -60.0% 33.3% $1,000,000 - $1,999,999 8 12 1 10 7 1 -20.0% 71.4% $2,000,000 - $2,999,999 0 2 0 6 1 6 -100.0% 100.0% $3,000,000 - $3,999,999 1 2 1 6 3 2 -83.3% -33.3% $4,000,000 - $4,999,999 1 1 1 1 0 Not Valid 0.0% 0.0% $5,000,000 - $5,999,999 0 0 Not Valid 0 0 Not Valid 0.0% 0.0% $6,000,000 - $7,999,999 0 1 0 0 0 Not Valid 0.0% 0.0% $8,000,000 - $9,999,999 0 0 Not Valid 0 0 Not Valid 0.0% 0.0% $10,000,000 and up 0 0 Not Valid 0 0 Not Valid 0.0% 0.0% MarketTotals 16 30 1 38 20 2 -57.9% 50.0% *Supply Demand Ratio Key 1-4: High Demand 5-6: Balanced 7-9: Low Demand 10+: Very Low Demand
YEAR-TO-DATE YEAR-OVER-YEAR 01/01/202403/31/2024 01/01/202303/31/2023 % CHANGE 2024/2023 04/01/202303/31/2024 04/01/202203/31/2023 % CHANGE 2024/2023 $0 - $999,999 18 29 -37.9% 74 113 -34.5% $1,000,000 - $1,999,999 10 10 0.0% 54 51 5.9% $2,000,000 - $2,999,999 3 3 0.0% 14 14 0.0% $3,000,000 - $3,999,999 2 2 0.0% 4 9 -55.6% $4,000,000 - $4,999,999 0 1 -100.0% 1 4 -75.0% $5,000,000 - $5,999,999 0 0 Not Valid 0 0 Not Valid $6,000,000 - $7,999,999 0 0 Not Valid 0 0 Not Valid $8,000,000 - $9,999,999 0 0 Not Valid 0 0 Not Valid $10,000,000 and up 0 0 Not Valid 0 0 Not Valid MarketTotals 33 45 -26.7% 147 191 -23.0%
Source: Greenwich Multiple Listing Service, Condominium

GREENWICH, CT · $20,850,000
Spectacular custom construction with pool, tennis & guest house on 5+ acres close to town. Jim Hoffman & Doron Sabag | M 203.517.8105
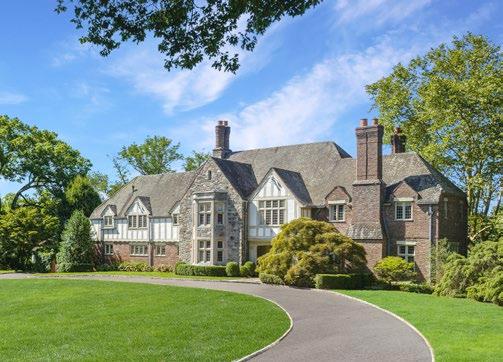
GREENWICH, CT · $9,650,000
Stylish updated Mid-Country English Manor with a pool house, tennis court & guest cottage. Ellen Mosher & Julie Church | M 203.705.9680

GREENWICH, CT · $6,585,000
8,000+ sq ft 2024 smart home on 2.16 acres in quiet neighborhood with pool and loggia. Amanda Bates Goodro | M 203.536.1195
SELLING BROKERAGE IN GREENWICH 8 YEARS IN A ROW

GREENWICH, CT · $11,950,000
Extraordinary custom stone/clapboard home on 2.46 private acres with pool and cabana.
Ellen Mosher | M 203.705.9680

GREENWICH, CT · $6,895,000
Totally transformed four bedroom home set high with Long Island Sound views near town. Barbara Wells | M 203.912.5644

GREENWICH, CT · $6,495,000
Set on 4 manicured acres with 6 bedrooms & expansive terraces in peaceful backcountry. Julie Church | M 203.561.9373
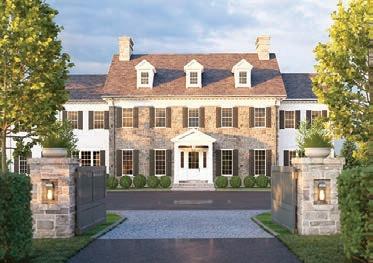
GREENWICH, CT · $10,750,000
Kaali-Nagy's newest to-be-built ultra-chic luxury home sits on 1.55 gated acres with pool. K. de la Sierra & E. Mosher | M 203.526.6007
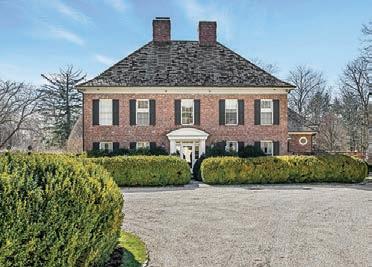
GREENWICH, CT · $6,795,000
Exquisite sunlit five bedroom Georgian with pool set on 2.53 acres in Mid-Country. BK Bates | M 203.536.4997
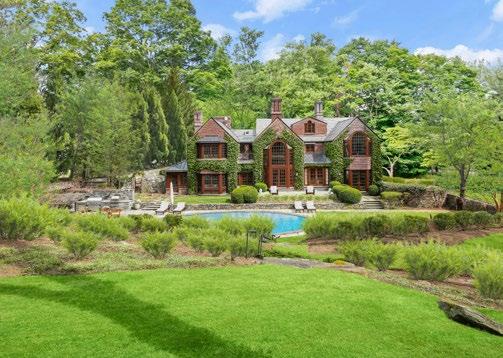
GREENWICH, CT · $6,350,000
Charm & style meet at this entertainer's oasis in Mid-Country with pool & outdoor kitchen. Amanda Miller | M 203.912.9233
Source:
203.869.0700 · HOULIHANLAWRENCE.COM @AROUNDGREENWICH @AROUNDGREENWICH /GREENWICHCTREALESTATE
GMLS, 2016, 2017, 2018, 2019, 2020, 2021, 2022, 2023 total units of single family homes sold by company, Greater Greenwich.
# 1
AREA’S MOST POWERFUL GLOBAL NETWORK
Leading Real Estates Companies of the World | Luxury Portfolio International
Mayfair International Realty | Board of Regents Luxury Real Estate

